Estimated redshift from machine learning (Ukwatta et al. 2016) - may take a few minute to calcaulte
Image
Pre-slew 15.0-350.0 keV image (Event data)
# RAcent DECcent POSerr Theta Phi Peak Cts SNR Name
191.9894 -28.7620 0.0254 12.5029 30.9171 0.5312100 7.538 TRIG_01093611
Foreground time interval of the image:
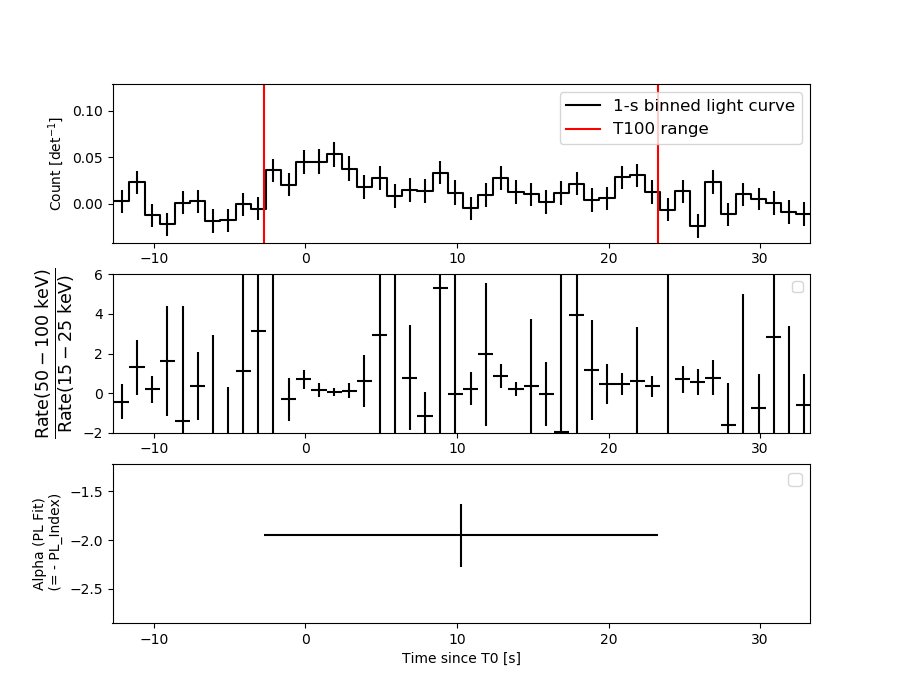
-2.728 23.288 (delta_t = 26.016 [sec])
Background time interval of the image:
-239.608 -2.728 (delta_t = 236.880 [sec])
Lightcurves
Notes:
- 1) The mask-weighted light curves are using the flight position.
- 2) Multiple plots of different time binning/intervals are shown to cover all scenarios of short/long GRBs, rate/image triggers, and real/false positives.
- 3) For all the mask-weighted lightcurves, the y-axis units are counts/sec/det where a det is 0.4 x 0.4 = 0.16 sq cm.
- 4) The verticle lines correspond to following: green dotted lines are T50 interval, black dotted lines are T90 interval, blue solid line(s) is a spacecraft slew start time, and orange solid line(s) is a spacecraft slew end time.
- 5) Time of each bin is in the middle of the bin.
1 s binning
From T0-310 s to T0+310 s
From T100_start - 20 s to T100_end + 30 s
Full time interval
64 ms binning
Full time interval

From T100_start to T100_end
From T0-5 sec to T0+5 sec

16 ms binning
From T100_start-5 s to T100_start+5 s
Blue+Cyan dotted lines: Time interval of the scaled map
From 0.000000 to 4.096000
8 ms binning
From T100_start-3 s to T100_start+3 s
Blue+Cyan dotted lines: Time interval of the scaled map
From 0.000000 to 4.096000
2 ms binning
From T100_start-1 s to T100_start+1 s
Blue+Cyan dotted lines: Time interval of the scaled map
From 0.000000 to 4.096000
SN=5 or 10 sec. binning (whichever binning is satisfied first)
SN=5 or 10 sec. binning (T < 200 sec)

Quad-rate summed light curves (from T0-300s to T0+1000s)

Spectral Evolution
Spectra
Notes:
- 1) The fitting includes the systematic errors.
- 2) When the burst includes telescope slew time periods, the fitting uses an average response file made from multiple 5-s response files through out the slew time plus single time preiod for the non-slew times, and weighted by the total counts in the corresponding time period using addrmf. An average response file is needed becuase a spectral fit using the pre-slew DRM will introduce some errors in both a spectral shape and a normalization if the PHA file contains a lot of the slew/post-slew time interval.
- 3) For fits to more complicated models (e.g. a power-law over a cutoff power-law), the BAT team has decided to require a chi-square improvement of more than 6 for each extra dof.
Time averaged spectrum fit using the average DRM
Power-law model

Time interval is from   -2.728 sec. to   23.288 sec.

Spectral model in power-law:
------------------------------------------------------------
Parameters  : value       lower 90%   higher 90%
Photon index: 1.94384     ( -0.309294   0.336631 )
Norm@50keV  : 1.21028E-03    ( -0.000280404   0.000272533 )
------------------------------------------------------------
#Fit statistic  : Chi-Squared                   80.54     using 59 bins.
 Reduced chi-squared = 1.41298
# Null hypothesis probability of 2.18e-02 with 57 degrees of freedom

Photon flux (15-150 keV)    in 26.02 sec: 0.177023 ( -0.030979  0.030984 ) ph/cm2/s
Energy fluence (15-150 keV)             : 2.89806e-07 ( -6.29354e-08  6.58891e-08 ) ergs/cm2
Cutoff power-law model

Time interval is from   -2.728 sec. to   23.288 sec.
Spectral model in the cutoff power-law:
------------------------------------------------------------
Parameters  : value       lower 90%   higher 90%
Photon index: 0.637247     ( -2.97674   1.58898 )
Epeak [keV] : 38.2440      ( -37.9963 80.5102 )
Norm@50keV  : 7.96806E-03    ( -0.00847553   0.791566 )
------------------------------------------------------------
#Fit statistic  : Chi-Squared                   78.74     using 59 bins.
 Reduced chi-squared = 1.40607
# Null hypothesis probability of 2.42e-02 with 56 degrees of freedom

Photon flux (15-150 keV)    in 26.02 sec: 0.169720 ( -0.031603  0.032198 ) ph/cm2/s
Energy fluence (15-150 keV)             : 2.44145e-07 ( -6.46311e-08  8.5873e-08 ) ergs/cm2
Band function

Time interval is from   -2.728 sec. to   23.288 sec.


Spectral model in the Band function:
------------------------------------------------------------
Parameters  : value       lower 90%   higher 90%
alpha       :    (     )
beta        :     (     )
Epeak [keV] :       (   )
Norm@50keV   :     (     )
------------------------------------------------------------

Photon flux (15-150 keV)    in  sec:  (    ) ph/cm2/s
Energy fluence (15-150 keV)             : 0 ( 0  0 ) ergs/cm2
Single BB
Spectral model blackbody:
------------------------------------------------------------
Parameters  : value    Lower 90%  Upper 90%
kT [keV]    : 8.83745  (-1.51671  1.90971)
R^2/D10^2   : 0.137191  (-0.0730127   0.146918)
(R is the radius in km and D10 is the distance to the source in units of 10 kpc)
------------------------------------------------------------
#Fit statistic  : Chi-Squared                   80.63     using 59 bins.
 Reduced chi-squared =
# Null hypothesis probability of 2.14e-02 with 57 degrees of freedom

Energy  Fluence     90% Error
[keV]   [erg/cm2]   [erg/cm2]
15- 25  5.375e-08   1.821e-08
25- 50  1.110e-07   2.956e-08
50-150  4.004e-08   1.944e-08
15-150  2.048e-07   5.839e-08
Thermal bremsstrahlung (OTTB)
Spectral model: thermal bremsstrahlung
------------------------------------------------------------
Parameters  : value         Lower 90%    Upper 90%
kT [keV]    : 63.0149       (-25.7269      63.6817)
Norm        : 0.916769       (-0.22918     0.315783)
------------------------------------------------------------
#Fit statistic  : Chi-Squared                   79.09     using 59 bins.
 Reduced chi-squared =
# Null hypothesis probability of 2.80e-02 with 57 degrees of freedom

Energy  Fluence     90% Error
[keV]   [erg/cm2]   [erg/cm2]
15- 25  6.040e-08   1.475e-08
25- 50  9.330e-08   2.520e-08
50-150  1.105e-07   6.378e-08
15-150  2.642e-07   7.966e-08
Double BB
Spectral model: bbodyrad<1> + bbodyrad<2>
------------------------------------------------------------
Parameters  : value         Lower 90%    Upper 90%
kT1 [keV]   : 7.20028        (-3.01498      1.92274)
R1^2/D10^2  : 0.254117        (-0.140628      0.668116)
kT2 [keV]   : 27.7392        (-16.3878      -35.1578)
R2^2/D10^2  : 8.50300E-04    (-0.000424469   0.0568233)
------------------------------------------------------------
#Fit statistic  : Chi-Squared                   76.89     using 59 bins.
 Reduced chi-squared =
# Null hypothesis probability of 2.73e-02 with 55 degrees of freedom

Energy  Fluence     90% Error
[keV]   [erg/cm2]   [erg/cm2]
15- 25  5.945e-08   3.519e-08
25- 50  9.854e-08   5.581e-08
50-150  1.079e-07   7.920e-08
15-150  2.659e-07   1.388e-07
Peak spectrum fit
Power-law model

Time interval is from   -0.132 sec. to    0.868 sec.

Spectral model in power-law:
------------------------------------------------------------
Parameters  : value       lower 90%   higher 90%
Photon index: 1.41181     ( -0.60216   0.584754 )
Norm@50keV  : 4.25328E-03    ( -0.00135168   0.00131658 )
------------------------------------------------------------
#Fit statistic  : Chi-Squared                   69.66     using 59 bins.
 Reduced chi-squared = 1.22211
# Null hypothesis probability of 1.21e-01 with 57 degrees of freedom

Photon flux (15-150 keV)    in 1 sec: 0.519384 ( -0.15975  0.160246 ) ph/cm2/s
Energy fluence (15-150 keV)             : 4.10053e-08 ( -1.42044e-08  1.48044e-08 ) ergs/cm2
Cutoff power-law model
Time interval is from   -0.132 sec. to    0.868 sec.
Spectral model in the cutoff power-law:
------------------------------------------------------------
Parameters  : value       lower 90%   higher 90%
Photon index: 1.42320     ( -1.0543   0.577941 )
Epeak [keV] : 9999.30      ( -9999.36 -9999.36 )
Norm@50keV  : 4.23822E-03    ( -0.00135583   0.0471917 )
------------------------------------------------------------
#Fit statistic  : Chi-Squared                   69.66     using 59 bins.
 Reduced chi-squared = 1.24393
# Null hypothesis probability of 1.04e-01 with 56 degrees of freedom

Photon flux (15-150 keV)    in 1 sec: 0.520802 ( -0.161533  0.159299 ) ph/cm2/s
Energy fluence (15-150 keV)             : 4.19411e-08 ( -1.62342e-08  1.35994e-08 ) ergs/cm2
Band function

Time interval is from   -0.132 sec. to    0.868 sec.


Spectral model in the Band function:
------------------------------------------------------------
Parameters  : value       lower 90%   higher 90%
alpha       :    (     )
beta        :     (     )
Epeak [keV] :       (   )
Norm@50keV   :     (     )
------------------------------------------------------------

Photon flux (15-150 keV)    in  sec:  (    ) ph/cm2/s
Energy fluence (15-150 keV)             : 0 ( 0  0 ) ergs/cm2
Single BB
Spectral model blackbody:
------------------------------------------------------------
Parameters  : value    Lower 90%  Upper 90%
kT [keV]    : 11.4715  (-3.72739  10.9384)
R^2/D10^2   : 0.146077  (-0.145202   0.476295)
(R is the radius in km and D10 is the distance to the source in units of 10 kpc)
------------------------------------------------------------
#Fit statistic  : Chi-Squared                   73.63     using 59 bins.
 Reduced chi-squared =
# Null hypothesis probability of 6.83e-02 with 57 degrees of freedom

Energy  Fluence     90% Error
[keV]   [erg/cm2]   [erg/cm2]
15- 25  4.045e-09   2.558e-09
25- 50  1.206e-08   7.465e-09
50-150  9.248e-09   6.575e-09
15-150  2.535e-08   1.613e-08
Thermal bremsstrahlung (OTTB)

Spectral model: thermal bremsstrahlung
------------------------------------------------------------
Parameters  : value         Lower 90%    Upper 90%
kT [keV]    : 199.362       (-199.363      -199.363)
Norm        : 2.12354       (-0.647277     0.647275)
------------------------------------------------------------
#Fit statistic  : Chi-Squared                   70.06     using 59 bins.
 Reduced chi-squared =
# Null hypothesis probability of 1.15e-01 with 57 degrees of freedom

Energy  Fluence     90% Error
[keV]   [erg/cm2]   [erg/cm2]
15- 25  5.288e-09   3.308e-09
25- 50  1.017e-08   6.270e-09
50-150  2.231e-08   1.341e-08
15-150  3.777e-08   2.338e-08
Double BB
Spectral model: bbodyrad<1> + bbodyrad<2>
------------------------------------------------------------
Parameters  : value         Lower 90%    Upper 90%
kT1 [keV]   : 8.28546        (-3.01315      4.54823)
R1^2/D10^2  : 0.407125        (-0.3262      1.68578)
kT2 [keV]   : 144.622        (-121.826      -144.064)
R2^2/D10^2  : 1.51699E-04    (-0.000114577   0.0108313)
------------------------------------------------------------
#Fit statistic  : Chi-Squared                   67.63     using 59 bins.
 Reduced chi-squared =
# Null hypothesis probability of 1.18e-01 with 55 degrees of freedom

Energy  Fluence     90% Error
[keV]   [erg/cm2]   [erg/cm2]
15- 25  5.277e-09   3.274e-09
25- 50  1.076e-08   6.410e-09
50-150  2.883e-08   1.628e-08
15-150  4.486e-08   2.101e-08
Pre-slew spectrum (Pre-slew PHA with pre-slew DRM)
Power-law model
Spectral model in power-law:
------------------------------------------------------------
Parameters  : value       lower 90%   higher 90%
Photon index: 1.94384     ( -0.309294   0.336631 )
Norm@50keV  : 1.21028E-03    ( -0.000280404   0.000272533 )
------------------------------------------------------------
#Fit statistic  : Chi-Squared                   80.54     using 59 bins.
 Reduced chi-squared =
# Null hypothesis probability of 2.18e-02 with 57 degrees of freedom

Photon flux (15-150 keV)    in 26.02 sec: 0.177011 ( -0.0309778  0.0309815 ) ph/cm2/s
Energy fluence (15-150 keV)             : 2.89759e-07 ( -6.28219e-08  6.59573e-08 ) ergs/cm2
Cutoff power-law model
Spectral model in the cutoff power-law:
------------------------------------------------------------
Parameters  : value       lower 90%   higher 90%
Photon index: 0.593792     ( -2.94853   1.5826 )
Epeak [keV] : 38.0513      ( -37.8861 76.9056 )
Norm@50keV  : 8.52789E-03    ( -0.00857491   0.786243 )
------------------------------------------------------------
#Fit statistic  : Chi-Squared                   78.74     using 59 bins.
 Reduced chi-squared =
# Null hypothesis probability of 2.42e-02 with 56 degrees of freedom

Photon flux (15-150 keV)    in 26.02 sec: 0.169685 ( -0.031588  0.032186 ) ph/cm2/s
Energy fluence (15-150 keV)             : 2.44174e-07 ( -6.45569e-08  8.60611e-08 ) ergs/cm2
Band function
Spectral model in the Band function:
------------------------------------------------------------
Parameters  : value       lower 90%   higher 90%
alpha       :    (     )
beta        :     (     )
Epeak [keV] :       (   )
Norm@50keV   :     (     )
------------------------------------------------------------

Photon flux (15-150 keV)    in  sec:  (    ) ph/cm2/s
Energy fluence (15-150 keV)             : 0 ( 0  0 ) ergs/cm2
S(25-50 keV) vs. S(50-100 keV) plot
S(25-50 keV)  = 8.59e-08
S(50-100 keV) = 8.92e-08
T90 vs. Hardness ratio plot

T90                                   = 24.3680000305176 sec.
Hardness ratio (energy fluence ratio) = 1.03842
Color vs. Color plot

Count Ratio  (25-50 keV) / (15-25 keV) = 1.56695
Count Ratio (50-100 keV) / (15-25 keV) = 0.611302
Mask shadow pattern
IMX = 1.902394694622780E-01, IMY = -1.139329220769786E-01
TIME vs. PHA plot around the trigger time
Blue+Cyan dotted lines: Time interval of the scaled map
From 0.000000 to 4.096000
TIME vs. DetID plot around the trigger time

Blue+Cyan dotted lines: Time interval of the scaled map
From 0.000000 to 4.096000
100 us light curve (15-350 keV)
Blue+Cyan dotted lines: Time interval of the scaled map
From 0.000000 to 4.096000
Spacecraft aspect plot

Bright source in the pre-burst/pre-slew/post-slew images
Pre-burst image of 15-350 keV band
Time interval of the image:
-239.608000 -2.728000

# RAcent  DECcent POSerr Theta    Phi  PeakCts   SNR AngSep     Name
#  [deg]    [deg]    ['] [deg]  [deg]                   [']
170.2684 -60.6251    4.0  45.0   -2.2   1.4277   2.9    1.4	Cen X-3
186.6297 -62.7046   17.8  42.2  -13.1   0.2920   0.6    4.0	GX 301-2
244.9459 -15.6451    1.1  39.4 -116.9   6.3811  10.4    2.0	Sco X-1
163.0911 -13.4384    3.0  39.6   70.9   3.9015   3.8 ------	UNKNOWN
192.5181 -30.0471    2.6  12.8   24.8   1.1671   4.5 ------	UNKNOWN
189.3391 -44.7288    2.5  25.5   -0.5   1.2987   4.6 ------	UNKNOWN
213.6585 -18.9264    3.2   9.8 -132.1   0.8618   3.6 ------	UNKNOWN
Pre-slew background subtracted image of 15-350 keV band
Time interval of the image:
-2.728000 23.288000

# RAcent  DECcent POSerr Theta    Phi  PeakCts   SNR AngSep     Name
#  [deg]    [deg]    ['] [deg]  [deg]                   [']
170.4796 -60.5203    4.7  44.8   -2.2   0.2838   2.4    7.8	Cen X-3
186.4822 -62.6895   21.2  42.2  -13.0   0.0580   0.5    6.8	GX 301-2
245.1265 -15.6702    8.1  39.6 -116.7   0.2358   1.4    8.7	Sco X-1
191.9891 -28.7619    1.5  12.5   30.9   0.5315   7.5 ------	UNKNOWN
Post-slew image of 15-350 keV band
Time interval of the image:
84.692590 306.292620

# RAcent  DECcent POSerr Theta    Phi  PeakCts   SNR AngSep     Name
#  [deg]    [deg]    ['] [deg]  [deg]                   [']
135.5998 -40.3534   23.0  47.0   33.7  -0.3465  -0.5   12.5	Vela X-1
170.0640 -60.5731    4.7  35.0   -7.8   0.8095   2.5    8.0	Cen X-3
186.6076 -62.6669    8.2  34.1  -22.1   0.4500   1.4    6.3	GX 301-2
207.3323 -86.5141    1.8  57.9  -27.5   9.0730   6.3 ------	UNKNOWN
Plot creation:
Mon Oct 24 05:09:06 EDT 2022