Estimated redshift from machine learning (Ukwatta et al. 2016) - may take a few minute to calcaulte
Image
Pre-slew 15.0-350.0 keV image (Event data)

#   RAcent    DECcent   POSerr    Theta     Phi              Peak Cts       SNR   Name
  218.1402    61.2893   0.0157    29.5707  -105.4347         0.5277579     12.179 TRIG_01098132

Foreground time interval of the image:
 -0.364   6.564 (delta_t =   6.928 [sec])
Background time interval of the image:
-239.144  -0.364 (delta_t = 238.780 [sec])
Lightcurves
Notes:
- 1) The mask-weighted light curves are using the flight position.
- 2) Multiple plots of different time binning/intervals are shown to cover all scenarios of short/long GRBs, rate/image triggers, and real/false positives.
- 3) For all the mask-weighted lightcurves, the y-axis units are counts/sec/det where a det is 0.4 x 0.4 = 0.16 sq cm.
- 4) The verticle lines correspond to following: green dotted lines are T50 interval, black dotted lines are T90 interval, blue solid line(s) is a spacecraft slew start time, and orange solid line(s) is a spacecraft slew end time.
- 5) Time of each bin is in the middle of the bin.
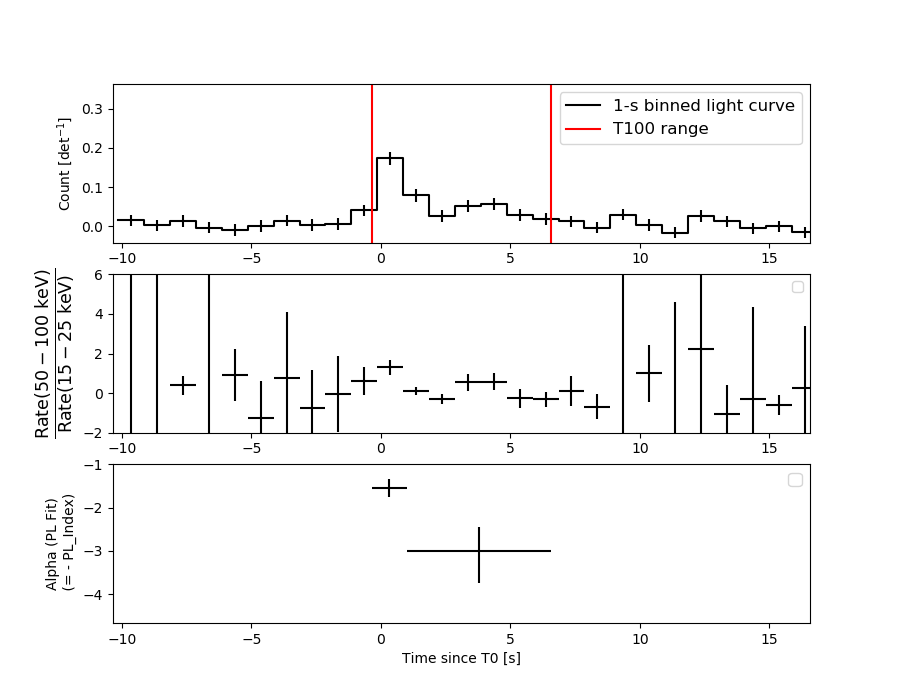
1 s binning
From T0-310 s to T0+310 s
From T100_start - 20 s to T100_end + 30 s

Full time interval
64 ms binning
Full time interval

From T100_start to T100_end
From T0-5 sec to T0+5 sec

16 ms binning
From T100_start-5 s to T100_start+5 s

Blue+Cyan dotted lines: Time interval of the scaled map
From 0.000000 to 1.024000
8 ms binning
From T100_start-3 s to T100_start+3 s
Blue+Cyan dotted lines: Time interval of the scaled map
From 0.000000 to 1.024000
2 ms binning
From T100_start-1 s to T100_start+1 s
Blue+Cyan dotted lines: Time interval of the scaled map
From 0.000000 to 1.024000
SN=5 or 10 sec. binning (whichever binning is satisfied first)

SN=5 or 10 sec. binning (T < 200 sec)
Quad-rate summed light curves (from T0-300s to T0+1000s)

Spectral Evolution
Spectra
Notes:
- 1) The fitting includes the systematic errors.
- 2) When the burst includes telescope slew time periods, the fitting uses an average response file made from multiple 5-s response files through out the slew time plus single time preiod for the non-slew times, and weighted by the total counts in the corresponding time period using addrmf. An average response file is needed becuase a spectral fit using the pre-slew DRM will introduce some errors in both a spectral shape and a normalization if the PHA file contains a lot of the slew/post-slew time interval.
- 3) For fits to more complicated models (e.g. a power-law over a cutoff power-law), the BAT team has decided to require a chi-square improvement of more than 6 for each extra dof.
Time averaged spectrum fit using the average DRM
Power-law model

Time interval is from   -0.364 sec. to    6.564 sec.

Spectral model in power-law:
------------------------------------------------------------
Parameters  : value       lower 90%   higher 90%
Photon index: 2.15355     ( -0.271917   0.299411 )
Norm@50keV  : 3.60513E-03    ( -0.000732104   0.000707162 )
------------------------------------------------------------
#Fit statistic  : Chi-Squared                   42.88     using 59 bins.
 Reduced chi-squared = 0.752281
# Null hypothesis probability of 9.17e-01 with 57 degrees of freedom

Photon flux (15-150 keV)    in 6.928 sec: 0.582696 ( -0.081823  0.081824 ) ph/cm2/s
Energy fluence (15-150 keV)             : 2.33458e-07 ( -4.05907e-08  4.19258e-08 ) ergs/cm2
Cutoff power-law model

Time interval is from   -0.364 sec. to    6.564 sec.
Spectral model in the cutoff power-law:
------------------------------------------------------------
Parameters  : value       lower 90%   higher 90%
Photon index: 1.97658     (     )
Epeak [keV] : 5.28272      (   )
Norm@50keV  : 4.60262E-03    (     )
------------------------------------------------------------
#Fit statistic  : Chi-Squared                   42.86     using 59 bins.
 Reduced chi-squared = 0.765357
# Null hypothesis probability of 9.02e-01 with 56 degrees of freedom

Photon flux (15-150 keV)    in 6.928 sec: 0.582011 ( -0.081464  0.083493 ) ph/cm2/s
Energy fluence (15-150 keV)             : 2.29186e-07 ( -4.36329e-08  4.6445e-08 ) ergs/cm2
Band function

Time interval is from   -0.364 sec. to    6.564 sec.


Spectral model in the Band function:
------------------------------------------------------------
Parameters  : value       lower 90%   higher 90%
alpha       :    (     )
beta        :     (     )
Epeak [keV] :       (   )
Norm@50keV   :     (     )
------------------------------------------------------------

Photon flux (15-150 keV)    in  sec:  (    ) ph/cm2/s
Energy fluence (15-150 keV)             : 0 ( 0  0 ) ergs/cm2
Single BB
Spectral model blackbody:
------------------------------------------------------------
Parameters  : value    Lower 90%  Upper 90%
kT [keV]    : 8.32284  (-1.35736  1.62601)
R^2/D10^2   : 0.541107  (-0.273781   0.557761)
(R is the radius in km and D10 is the distance to the source in units of 10 kpc)
------------------------------------------------------------
#Fit statistic  : Chi-Squared                   53.46     using 59 bins.
 Reduced chi-squared =
# Null hypothesis probability of 6.09e-01 with 57 degrees of freedom

Energy  Fluence     90% Error
[keV]   [erg/cm2]   [erg/cm2]
15- 25  4.828e-08   1.405e-08
25- 50  9.040e-08   2.043e-08
50-150  2.699e-08   1.210e-08
15-150  1.657e-07   3.793e-08
Thermal bremsstrahlung (OTTB)

Spectral model: thermal bremsstrahlung
------------------------------------------------------------
Parameters  : value         Lower 90%    Upper 90%
kT [keV]    : 49.8515       (-16.8611      31.8359)
Norm        : 3.29964       (-0.763467     1.10357)
------------------------------------------------------------
#Fit statistic  : Chi-Squared                   43.67     using 59 bins.
 Reduced chi-squared =
# Null hypothesis probability of 9.03e-01 with 57 degrees of freedom

Energy  Fluence     90% Error
[keV]   [erg/cm2]   [erg/cm2]
15- 25  5.586e-08   1.041e-08
25- 50  8.014e-08   1.456e-08
50-150  7.759e-08   3.304e-08
15-150  2.136e-07   4.822e-08
Double BB

Spectral model: bbodyrad<1> + bbodyrad<2>
------------------------------------------------------------
Parameters  : value         Lower 90%    Upper 90%
kT1 [keV]   : 5.53602        (-2.48069      2.45755)
R1^2/D10^2  : 2.08264        (-1.53831      12.7544)
kT2 [keV]   : 19.3212        (-18.4712      -21.8362)
R2^2/D10^2  : 1.20638E-02    (-0.0076477   0.129054)
------------------------------------------------------------
#Fit statistic  : Chi-Squared                   43.57     using 59 bins.
 Reduced chi-squared =
# Null hypothesis probability of 8.67e-01 with 55 degrees of freedom

Energy  Fluence     90% Error
[keV]   [erg/cm2]   [erg/cm2]
15- 25  5.795e-08   3.277e-08
25- 50  7.283e-08   3.862e-08
50-150  8.445e-08   5.244e-08
15-150  2.152e-07   1.155e-07
Peak spectrum fit
Power-law model
Time interval is from   -0.236 sec. to    0.764 sec.

Spectral model in power-law:
------------------------------------------------------------
Parameters  : value       lower 90%   higher 90%
Photon index: 1.58891     ( -0.220829   0.225704 )
Norm@50keV  : 1.18096E-02    ( -0.00177554   0.00176377 )
------------------------------------------------------------
#Fit statistic  : Chi-Squared                   56.58     using 59 bins.
 Reduced chi-squared = 0.992632
# Null hypothesis probability of 4.91e-01 with 57 degrees of freedom

Photon flux (15-150 keV)    in 1 sec: 1.51247 ( -0.22344  0.22381 ) ph/cm2/s
Energy fluence (15-150 keV)             : 1.10614e-07 ( -1.75118e-08  1.76574e-08 ) ergs/cm2
Cutoff power-law model

Time interval is from   -0.236 sec. to    0.764 sec.
Spectral model in the cutoff power-law:
------------------------------------------------------------
Parameters  : value       lower 90%   higher 90%
Photon index: -0.136759     ( -1.49525   1.15329 )
Epeak [keV] : 60.0203      ( -10.6977 27.8721 )
Norm@50keV  : 9.27983E-02    ( -0.0928   0.426892 )
------------------------------------------------------------
#Fit statistic  : Chi-Squared                   49.48     using 59 bins.
 Reduced chi-squared = 0.883571
# Null hypothesis probability of 7.18e-01 with 56 degrees of freedom

Photon flux (15-150 keV)    in 1 sec: 1.45291 ( -0.22826  0.22853 ) ph/cm2/s
Energy fluence (15-150 keV)             : 1.01986e-07 ( -1.77108e-08  1.8451e-08 ) ergs/cm2
Band function

Time interval is from   -0.236 sec. to    0.764 sec.


Spectral model in the Band function:
------------------------------------------------------------
Parameters  : value       lower 90%   higher 90%
alpha       :    (     )
beta        :     (     )
Epeak [keV] :       (   )
Norm@50keV   :     (     )
------------------------------------------------------------

Photon flux (15-150 keV)    in  sec:  (    ) ph/cm2/s
Energy fluence (15-150 keV)             : 0 ( 0  0 ) ergs/cm2
Single BB

Spectral model blackbody:
------------------------------------------------------------
Parameters  : value    Lower 90%  Upper 90%
kT [keV]    : 14.1928  (-1.91356  2.19659)
R^2/D10^2   : 0.225472  (-0.0926941   0.153554)
(R is the radius in km and D10 is the distance to the source in units of 10 kpc)
------------------------------------------------------------
#Fit statistic  : Chi-Squared                   51.77     using 59 bins.
 Reduced chi-squared =
# Null hypothesis probability of 6.71e-01 with 57 degrees of freedom

Energy  Fluence     90% Error
[keV]   [erg/cm2]   [erg/cm2]
15- 25  9.581e-09   2.513e-09
25- 50  3.612e-08   8.035e-09
50-150  4.824e-08   1.310e-08
15-150  9.394e-08   1.765e-08
Thermal bremsstrahlung (OTTB)

Spectral model: thermal bremsstrahlung
------------------------------------------------------------
Parameters  : value         Lower 90%    Upper 90%
kT [keV]    : 164.529       (-72.7864      -163.149)
Norm        : 6.33803       (-0.961739     1.17439)
------------------------------------------------------------
#Fit statistic  : Chi-Squared                   53.70     using 59 bins.
 Reduced chi-squared =
# Null hypothesis probability of 6.00e-01 with 57 degrees of freedom

Energy  Fluence     90% Error
[keV]   [erg/cm2]   [erg/cm2]
15- 25  1.614e-08   8.970e-09
25- 50  3.031e-08   1.649e-08
50-150  6.206e-08   3.602e-08
15-150  1.085e-07   6.105e-08
Double BB
Spectral model: bbodyrad<1> + bbodyrad<2>
------------------------------------------------------------
Parameters  : value         Lower 90%    Upper 90%
kT1 [keV]   : 6.09471        (-6.04491      -6.04491)
R1^2/D10^2  : 1.38157        (-1.39786      -1.39786)
kT2 [keV]   : 16.7124        (-3.45051      -16.6925)
R2^2/D10^2  : 0.107070    (-0.107572   0.169659)
------------------------------------------------------------
#Fit statistic  : Chi-Squared                   49.27     using 59 bins.
 Reduced chi-squared =
# Null hypothesis probability of 6.92e-01 with 55 degrees of freedom

Energy  Fluence     90% Error
[keV]   [erg/cm2]   [erg/cm2]
15- 25  1.309e-08   7.535e-09
25- 50  3.389e-08   1.801e-08
50-150  5.365e-08   3.045e-08
15-150  1.006e-07   5.225e-08
Pre-slew spectrum (Pre-slew PHA with pre-slew DRM)
Power-law model
Spectral model in power-law:
------------------------------------------------------------
Parameters  : value       lower 90%   higher 90%
Photon index: 2.15355     ( -0.271917   0.299411 )
Norm@50keV  : 3.60513E-03    ( -0.000732104   0.000707162 )
------------------------------------------------------------
#Fit statistic  : Chi-Squared                   42.88     using 59 bins.
 Reduced chi-squared =
# Null hypothesis probability of 9.17e-01 with 57 degrees of freedom

Photon flux (15-150 keV)    in 6.928 sec: 0.582642 ( -0.0818144  0.0818156 ) ph/cm2/s
Energy fluence (15-150 keV)             : 2.33411e-07 ( -4.05674e-08  4.19361e-08 ) ergs/cm2
Cutoff power-law model

Spectral model in the cutoff power-law:
------------------------------------------------------------
Parameters  : value       lower 90%   higher 90%
Photon index: 1.95369     (     )
Epeak [keV] : 9.27734      (   )
Norm@50keV  : 4.74758E-03    (     )
------------------------------------------------------------
#Fit statistic  : Chi-Squared                   42.86     using 59 bins.
 Reduced chi-squared =
# Null hypothesis probability of 9.01e-01 with 56 degrees of freedom

Photon flux (15-150 keV)    in 6.928 sec: 0.580269 ( -0.082359  0.083507 ) ph/cm2/s
Energy fluence (15-150 keV)             : 2.30172e-07 ( -4.9741e-08  4.46683e-08 ) ergs/cm2
Band function

Spectral model in the Band function:
------------------------------------------------------------
Parameters  : value       lower 90%   higher 90%
alpha       :    (     )
beta        :     (     )
Epeak [keV] :       (   )
Norm@50keV   :     (     )
------------------------------------------------------------

Photon flux (15-150 keV)    in  sec:  (    ) ph/cm2/s
Energy fluence (15-150 keV)             : 0 ( 0  0 ) ergs/cm2
S(25-50 keV) vs. S(50-100 keV) plot

S(25-50 keV)  = 7.34e-08
S(50-100 keV) = 6.58e-08
T90 vs. Hardness ratio plot

T90                                   = 6.41999995708466 sec.
Hardness ratio (energy fluence ratio) = 0.896458
Color vs. Color plot

Count Ratio  (25-50 keV) / (15-25 keV) = 0.947227
Count Ratio (50-100 keV) / (15-25 keV) = 0.397278
Mask shadow pattern

IMX = -1.510084145816508E-01, IMY = 5.469381589651889E-01
TIME vs. PHA plot around the trigger time

Blue+Cyan dotted lines: Time interval of the scaled map
From 0.000000 to 1.024000
TIME vs. DetID plot around the trigger time

Blue+Cyan dotted lines: Time interval of the scaled map
From 0.000000 to 1.024000
100 us light curve (15-350 keV)

Blue+Cyan dotted lines: Time interval of the scaled map
From 0.000000 to 1.024000
Spacecraft aspect plot
Bright source in the pre-burst/pre-slew/post-slew images
Pre-burst image of 15-350 keV band
Time interval of the image:
-239.144000 -0.364000

# RAcent  DECcent POSerr Theta    Phi  PeakCts   SNR AngSep     Name
#  [deg]    [deg]    ['] [deg]  [deg]                   [']
254.3785  35.1488    5.9  41.5  -46.9   0.9312   2.0   12.2	Her X-1
173.9007   9.9906    4.0  35.9  117.0   1.6405   2.9 ------	UNKNOWN
244.7998  -1.2003    2.6  51.8    3.7   2.1435   4.4 ------	UNKNOWN
250.5458  19.1225    2.6  44.0  -22.9   1.8042   4.5 ------	UNKNOWN
Pre-slew background subtracted image of 15-350 keV band
Time interval of the image:
-0.364000 6.564000

# RAcent  DECcent POSerr Theta    Phi  PeakCts   SNR AngSep     Name
#  [deg]    [deg]    ['] [deg]  [deg]                   [']
254.5944  35.3215    5.2  41.7  -47.2  -0.1316  -2.2    6.8	Her X-1
139.2371  31.7017    2.2  53.5  167.7   0.5580   5.1 ------	UNKNOWN
218.1401  61.2893    0.9  29.6 -105.4   0.5279  12.2 ------	UNKNOWN
Post-slew image of 15-350 keV band
Time interval of the image:
84.356590 962.922100

# RAcent  DECcent POSerr Theta    Phi  PeakCts   SNR AngSep     Name
#  [deg]    [deg]    ['] [deg]  [deg]                   [']
254.4788  35.3260    8.6  34.6  -10.9  -1.3884  -1.3    1.4	Her X-1
174.1658  37.7594    3.5  35.9  117.0   6.2625   3.3 ------	UNKNOWN
141.7559  44.0709    2.7  46.3  152.3  10.9356   4.3 ------	UNKNOWN
113.5844  45.9776    3.8  56.9  173.9   8.4027   3.0 ------	UNKNOWN
226.5933  44.0077    2.2  18.0   27.4   3.6043   5.2 ------	UNKNOWN
258.7257  12.4865    2.8  56.9   -1.9   9.4539   4.1 ------	UNKNOWN
278.6235  65.7368    2.7  26.2  -78.7   4.1734   4.3 ------	UNKNOWN
276.9083  41.4979    3.0  39.8  -40.6   4.2387   3.9 ------	UNKNOWN
 73.7167  57.5390    2.9  58.0 -154.2  18.1437   4.0 ------	UNKNOWN
Plot creation:
Mon Oct 24 05:05:32 EDT 2022