Estimated redshift from machine learning (Ukwatta et al. 2016) - may take a few minute to calcaulte
Image
Pre-slew 15.0-350.0 keV image (Event data)
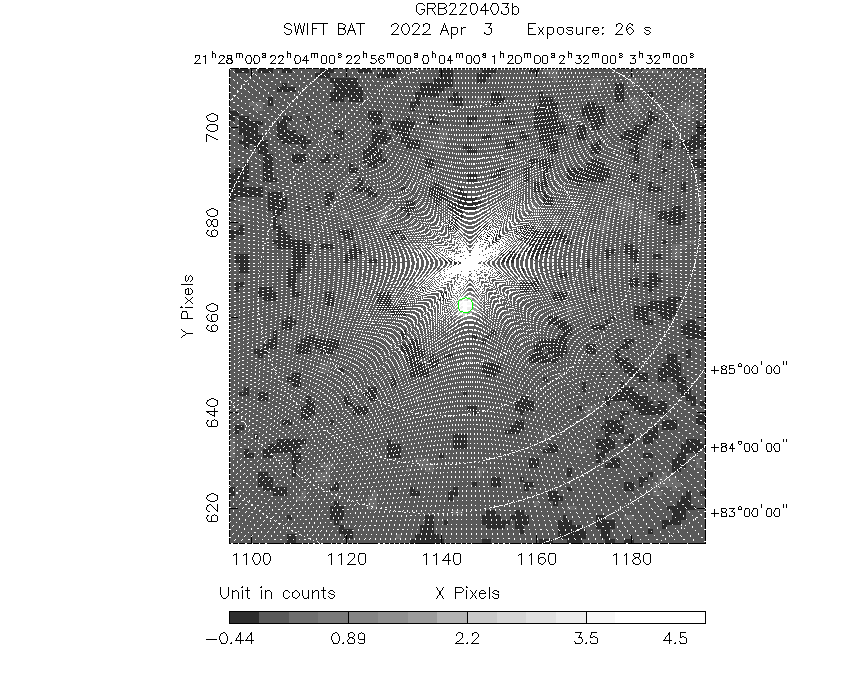
#   RAcent    DECcent   POSerr    Theta     Phi              Peak Cts       SNR   Name
  190.9728    89.1803   0.0042    34.2555  -144.9794         5.1340339     45.540 TRIG_01101053

Foreground time interval of the image:
-14.420  11.949 (delta_t =  26.369 [sec])
Background time interval of the image:
-239.552 -14.420 (delta_t = 225.132 [sec])
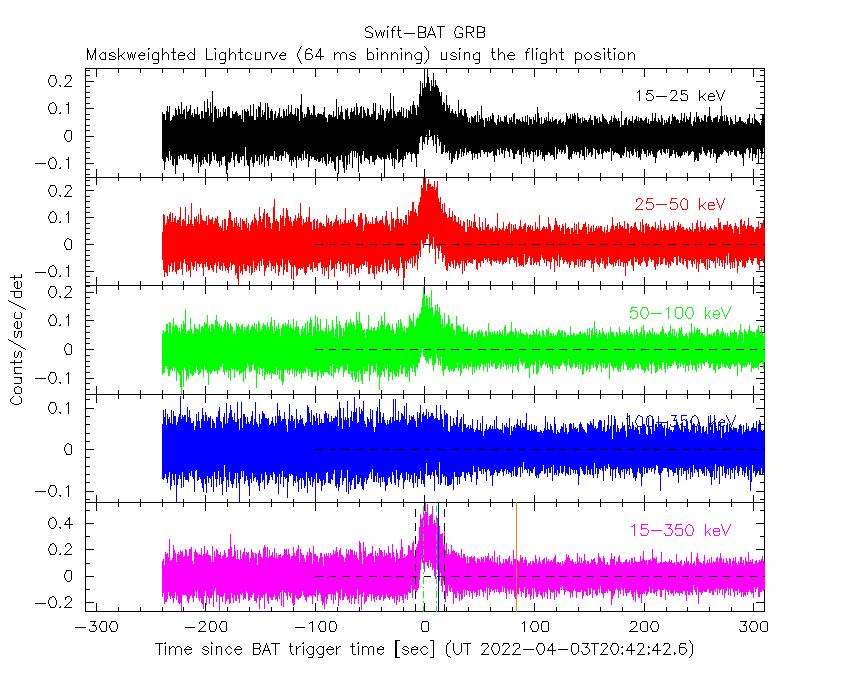
Lightcurves
Notes:
- 1) The mask-weighted light curves are using the flight position.
- 2) Multiple plots of different time binning/intervals are shown to cover all scenarios of short/long GRBs, rate/image triggers, and real/false positives.
- 3) For all the mask-weighted lightcurves, the y-axis units are counts/sec/det where a det is 0.4 x 0.4 = 0.16 sq cm.
- 4) The verticle lines correspond to following: green dotted lines are T50 interval, black dotted lines are T90 interval, blue solid line(s) is a spacecraft slew start time, and orange solid line(s) is a spacecraft slew end time.
- 5) Time of each bin is in the middle of the bin.
1 s binning
From T0-310 s to T0+310 s

From T100_start - 20 s to T100_end + 30 s

Full time interval

64 ms binning
Full time interval
From T100_start to T100_end
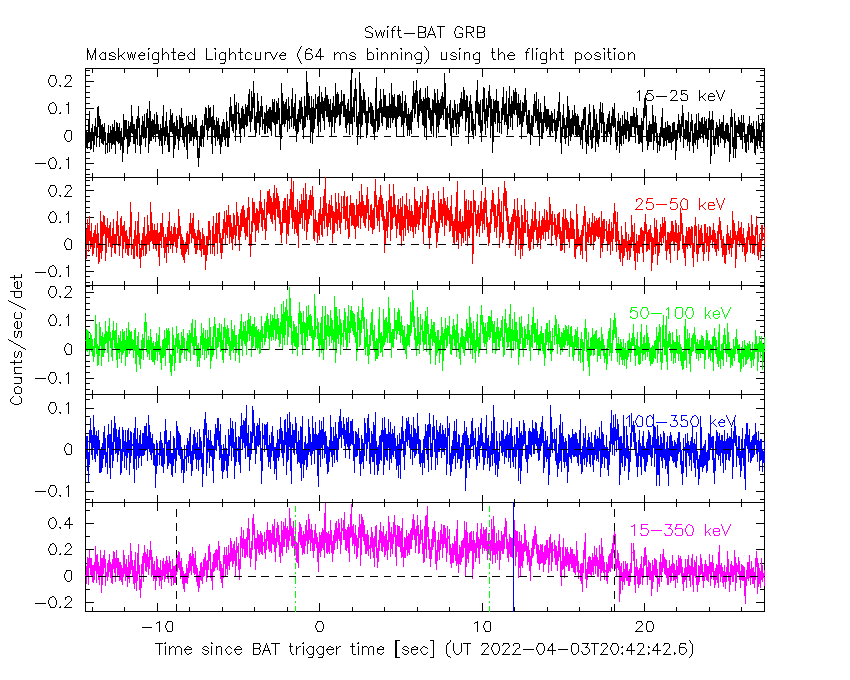
From T0-5 sec to T0+5 sec

16 ms binning
From T100_start-5 s to T100_start+5 s

Blue+Cyan dotted lines: Time interval of the scaled map
From 0.000000 to 1.024000
8 ms binning
From T100_start-3 s to T100_start+3 s

Blue+Cyan dotted lines: Time interval of the scaled map
From 0.000000 to 1.024000
2 ms binning
From T100_start-1 s to T100_start+1 s

Blue+Cyan dotted lines: Time interval of the scaled map
From 0.000000 to 1.024000
SN=5 or 10 sec. binning (whichever binning is satisfied first)
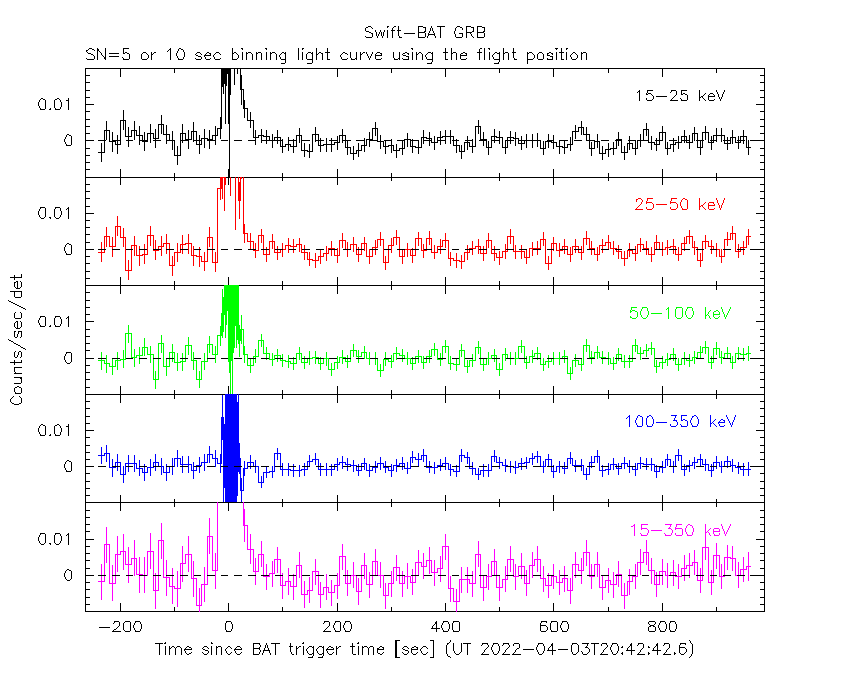
SN=5 or 10 sec. binning (T < 200 sec)

Quad-rate summed light curves (from T0-300s to T0+1000s)

Spectral Evolution

Spectra
Notes:
- 1) The fitting includes the systematic errors.
- 2) When the burst includes telescope slew time periods, the fitting uses an average response file made from multiple 5-s response files through out the slew time plus single time preiod for the non-slew times, and weighted by the total counts in the corresponding time period using addrmf. An average response file is needed becuase a spectral fit using the pre-slew DRM will introduce some errors in both a spectral shape and a normalization if the PHA file contains a lot of the slew/post-slew time interval.
- 3) For fits to more complicated models (e.g. a power-law over a cutoff power-law), the BAT team has decided to require a chi-square improvement of more than 6 for each extra dof.
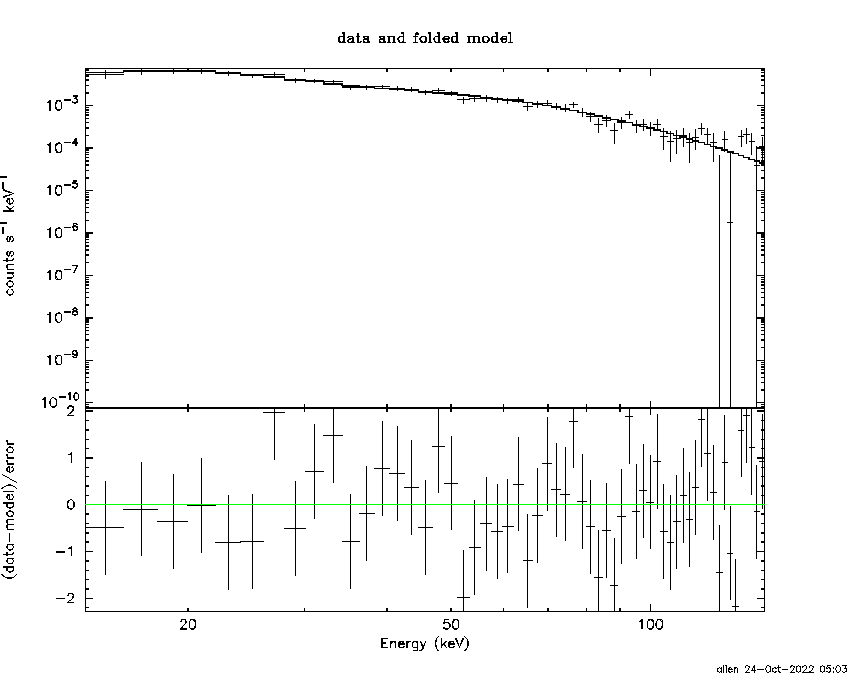
Time averaged spectrum fit using the average DRM
Power-law model
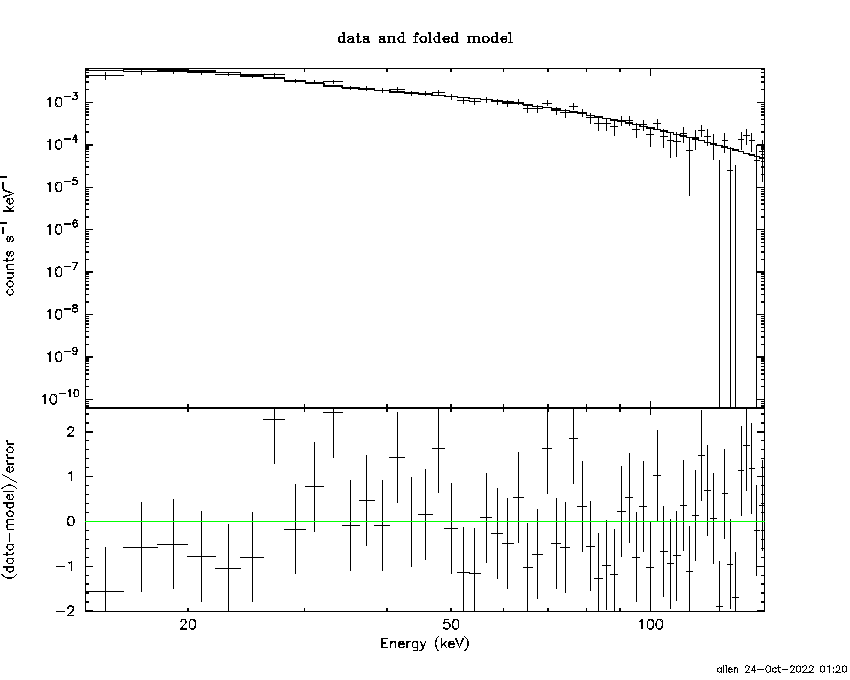
Time interval is from  -14.420 sec. to   27.396 sec.

Spectral model in power-law:
------------------------------------------------------------
Parameters  : value       lower 90%   higher 90%
Photon index: 1.93037     ( -0.0641229   0.0647122 )
Norm@50keV  : 9.62971E-03    ( -0.000339221   0.000337821 )
------------------------------------------------------------
#Fit statistic  : Chi-Squared                   60.56     using 59 bins.
 Reduced chi-squared = 1.06246
# Null hypothesis probability of 3.49e-01 with 57 degrees of freedom

Photon flux (15-150 keV)    in 41.82 sec: 1.40022 ( -0.05004  0.05023 ) ph/cm2/s
Energy fluence (15-150 keV)             : 3.70479e-06 ( -1.28162e-07  1.28519e-07 ) ergs/cm2
Cutoff power-law model

Time interval is from  -14.420 sec. to   27.396 sec.
Spectral model in the cutoff power-law:
------------------------------------------------------------
Parameters  : value       lower 90%   higher 90%
Photon index: 1.64218     ( -0.273615   0.256366 )
Epeak [keV] : 59.2477      ( -11.5735 78.0145 )
Norm@50keV  : 1.35480E-02    ( -0.00346826   0.00508178 )
------------------------------------------------------------
#Fit statistic  : Chi-Squared                   56.86     using 59 bins.
 Reduced chi-squared = 1.01536
# Null hypothesis probability of 4.43e-01 with 56 degrees of freedom

Photon flux (15-150 keV)    in 41.82 sec: 1.37067 ( -0.05601  0.0562 ) ph/cm2/s
Energy fluence (15-150 keV)             : 3.60657e-06 ( -1.5446e-07  1.53835e-07 ) ergs/cm2
Band function

Time interval is from  -14.420 sec. to   27.396 sec.


Spectral model in the Band function:
------------------------------------------------------------
Parameters  : value       lower 90%   higher 90%
alpha       :    (     )
beta        :     (     )
Epeak [keV] :       (   )
Norm@50keV   :     (     )
------------------------------------------------------------

Photon flux (15-150 keV)    in  sec:  (    ) ph/cm2/s
Energy fluence (15-150 keV)             : 0 ( 0  0 ) ergs/cm2
Single BB
Spectral model blackbody:
------------------------------------------------------------
Parameters  : value    Lower 90%  Upper 90%
kT [keV]    : 11.8236  (  )
R^2/D10^2   : 0.326674  (   )
(R is the radius in km and D10 is the distance to the source in units of 10 kpc)
------------------------------------------------------------
#Fit statistic  : Chi-Squared                  248.63     using 59 bins.
 Reduced chi-squared =
# Null hypothesis probability of 9.09e-26 with 57 degrees of freedom

Energy  Fluence     90% Error
[keV]   [erg/cm2]   [erg/cm2]
15- 25  4.034e-07   2.674e-08
25- 50  1.247e-06   4.851e-08
50-150  1.038e-06   7.758e-08
15-150  2.689e-06   9.765e-08
Thermal bremsstrahlung (OTTB)

Spectral model: thermal bremsstrahlung
------------------------------------------------------------
Parameters  : value         Lower 90%    Upper 90%
kT [keV]    : 85.0801       (-9.45223      11.4339)
Norm        : 6.27747       (-0.350145     0.377251)
------------------------------------------------------------
#Fit statistic  : Chi-Squared                   60.62     using 59 bins.
 Reduced chi-squared =
# Null hypothesis probability of 3.47e-01 with 57 degrees of freedom

Energy  Fluence     90% Error
[keV]   [erg/cm2]   [erg/cm2]
15- 25  6.835e-07   3.638e-08
25- 50  1.142e-06   4.057e-08
50-150  1.678e-06   1.079e-07
15-150  3.503e-06   1.282e-07
Double BB

Spectral model: bbodyrad<1> + bbodyrad<2>
------------------------------------------------------------
Parameters  : value         Lower 90%    Upper 90%
kT1 [keV]   : 7.07492        (-0.689241      0.708304)
R1^2/D10^2  : 1.70855        (-0.479248      0.748678)
kT2 [keV]   : 24.9107        (-3.3941      4.84523)
R2^2/D10^2  : 1.37021E-02    (-0.00659498   0.0106442)
------------------------------------------------------------
#Fit statistic  : Chi-Squared                   57.06     using 59 bins.
 Reduced chi-squared =
# Null hypothesis probability of 3.98e-01 with 55 degrees of freedom

Energy  Fluence     90% Error
[keV]   [erg/cm2]   [erg/cm2]
15- 25  6.560e-07   2.099e-07
25- 50  1.065e-06   2.118e-07
50-150  1.516e-06   3.017e-07
15-150  3.237e-06   5.322e-07
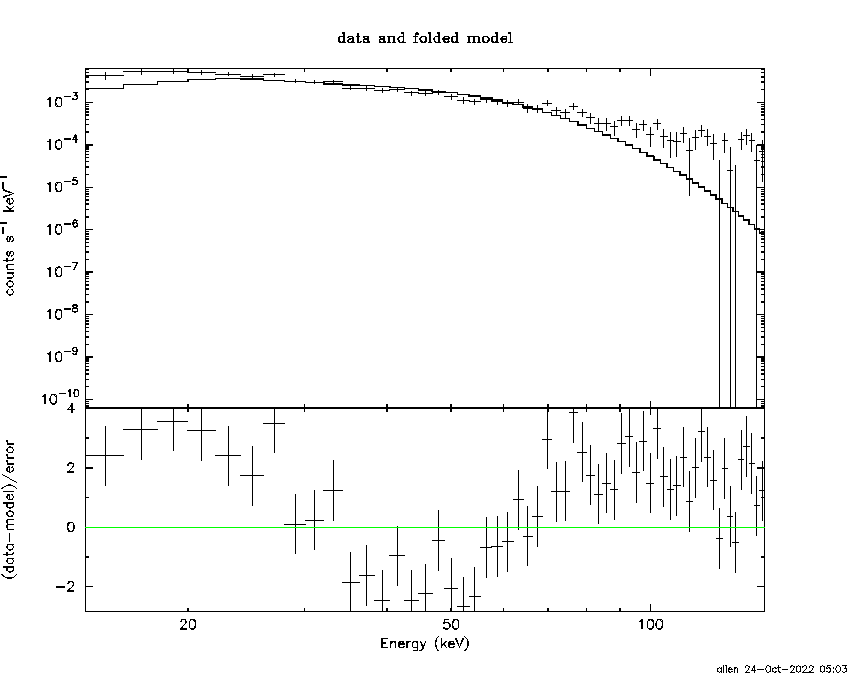
Peak spectrum fit
Power-law model
Time interval is from    1.064 sec. to    2.064 sec.

Spectral model in power-law:
------------------------------------------------------------
Parameters  : value       lower 90%   higher 90%
Photon index: 1.66439     ( -0.168726   0.171316 )
Norm@50keV  : 2.04833E-02    ( -0.0021028   0.00207983 )
------------------------------------------------------------
#Fit statistic  : Chi-Squared                   58.45     using 59 bins.
 Reduced chi-squared = 1.02544
# Null hypothesis probability of 4.22e-01 with 57 degrees of freedom

Photon flux (15-150 keV)    in 1 sec: 2.68755 ( -0.26388  0.26427 ) ph/cm2/s
Energy fluence (15-150 keV)             : 1.90265e-07 ( -2.05579e-08  2.07192e-08 ) ergs/cm2
Cutoff power-law model

Time interval is from    1.064 sec. to    2.064 sec.
Spectral model in the cutoff power-law:
------------------------------------------------------------
Parameters  : value       lower 90%   higher 90%
Photon index: 1.66663     ( -0.172253   0.169888 )
Epeak [keV] : 9999.34      ( -9999.35 -9999.36 )
Norm@50keV  : 2.04297E-02    ( -0.0110125   0.0194697 )
------------------------------------------------------------
#Fit statistic  : Chi-Squared                   58.46     using 59 bins.
 Reduced chi-squared = 1.04393
# Null hypothesis probability of 3.85e-01 with 56 degrees of freedom

Photon flux (15-150 keV)    in 1 sec: 2.69099 ( -0.27459  0.26764 ) ph/cm2/s
Energy fluence (15-150 keV)             : 1.90687e-07 ( -1.21945e-08  2.08274e-08 ) ergs/cm2
Band function

Time interval is from    1.064 sec. to    2.064 sec.


Spectral model in the Band function:
------------------------------------------------------------
Parameters  : value       lower 90%   higher 90%
alpha       :    (     )
beta        :     (     )
Epeak [keV] :       (   )
Norm@50keV   :     (     )
------------------------------------------------------------

Photon flux (15-150 keV)    in  sec:  (    ) ph/cm2/s
Energy fluence (15-150 keV)             : 0 ( 0  0 ) ergs/cm2
Single BB
Spectral model blackbody:
------------------------------------------------------------
Parameters  : value    Lower 90%  Upper 90%
kT [keV]    : 12.1303  (-1.4596  1.72892)
R^2/D10^2   : 0.621159  (-0.240948   0.377697)
(R is the radius in km and D10 is the distance to the source in units of 10 kpc)
------------------------------------------------------------
#Fit statistic  : Chi-Squared                   91.04     using 59 bins.
 Reduced chi-squared =
# Null hypothesis probability of 2.80e-03 with 57 degrees of freedom

Energy  Fluence     90% Error
[keV]   [erg/cm2]   [erg/cm2]
15- 25  1.935e-08   3.590e-09
25- 50  6.166e-08   7.205e-09
50-150  5.495e-08   1.193e-08
15-150  1.360e-07   1.765e-08
Thermal bremsstrahlung (OTTB)

Spectral model: thermal bremsstrahlung
------------------------------------------------------------
Parameters  : value         Lower 90%    Upper 90%
kT [keV]    : 157.120       (-60.2602      -155.861)
Norm        : 10.9735       (-1.16912     1.5676)
------------------------------------------------------------
#Fit statistic  : Chi-Squared                   59.96     using 59 bins.
 Reduced chi-squared =
# Null hypothesis probability of 3.69e-01 with 57 degrees of freedom

Energy  Fluence     90% Error
[keV]   [erg/cm2]   [erg/cm2]
15- 25  2.807e-08   5.295e-09
25- 50  5.237e-08   1.499e-08
50-150  1.053e-07   5.317e-08
15-150  1.858e-07   7.355e-08
Double BB

Spectral model: bbodyrad<1> + bbodyrad<2>
------------------------------------------------------------
Parameters  : value         Lower 90%    Upper 90%
kT1 [keV]   : 8.49656        (-1.77625      1.69582)
R1^2/D10^2  : 1.91819        (-0.917481      1.99034)
kT2 [keV]   : 55.2900        (-27.1689      -55.5453)
R2^2/D10^2  : 3.06887E-03    (-0.00261768   0.0186477)
------------------------------------------------------------
#Fit statistic  : Chi-Squared                   56.30     using 59 bins.
 Reduced chi-squared =
# Null hypothesis probability of 4.26e-01 with 55 degrees of freedom

Energy  Fluence     90% Error
[keV]   [erg/cm2]   [erg/cm2]
15- 25  2.704e-08   6.685e-09
25- 50  5.755e-08   1.499e-08
50-150  1.098e-07   5.405e-08
15-150  1.944e-07   6.645e-08
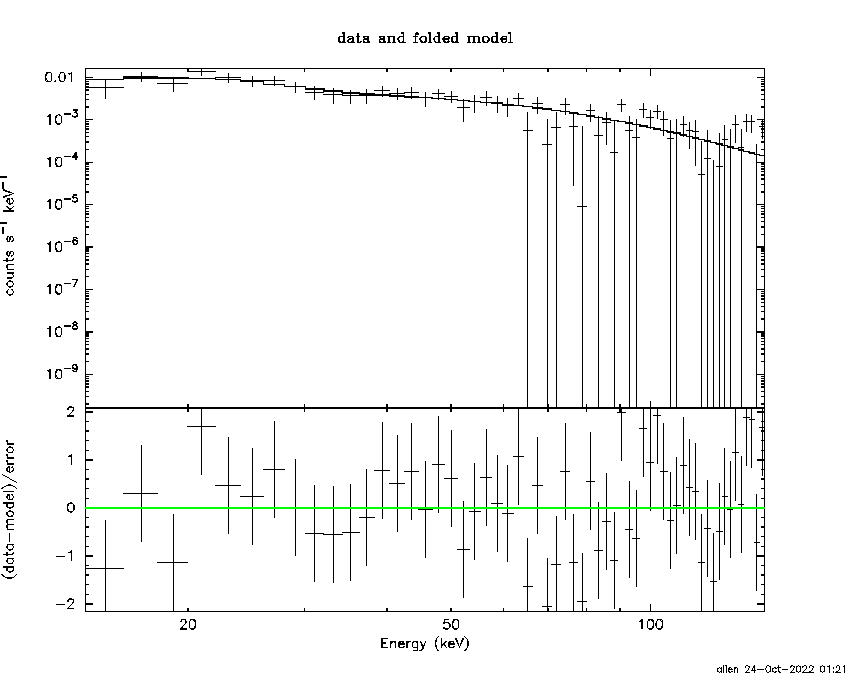
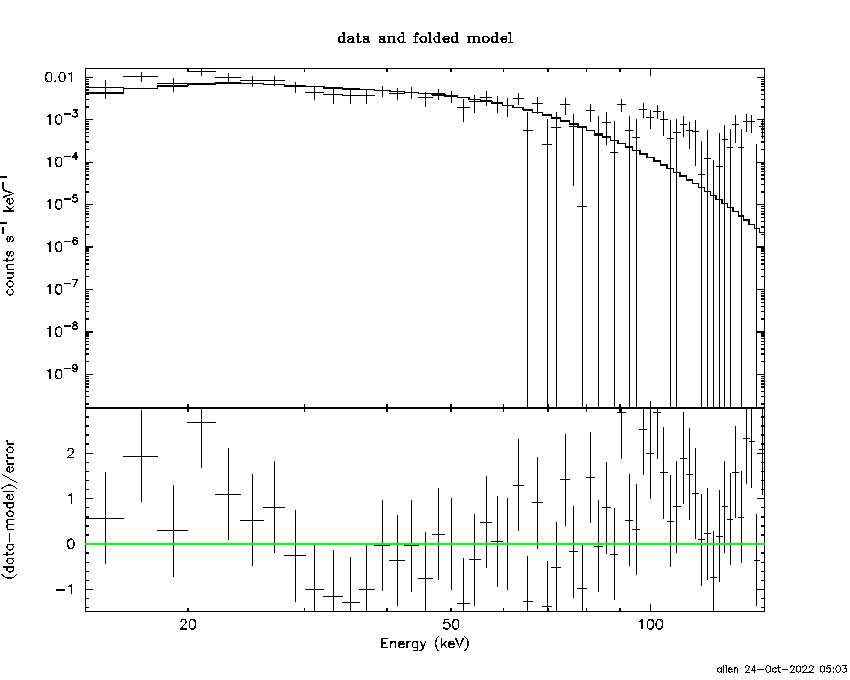
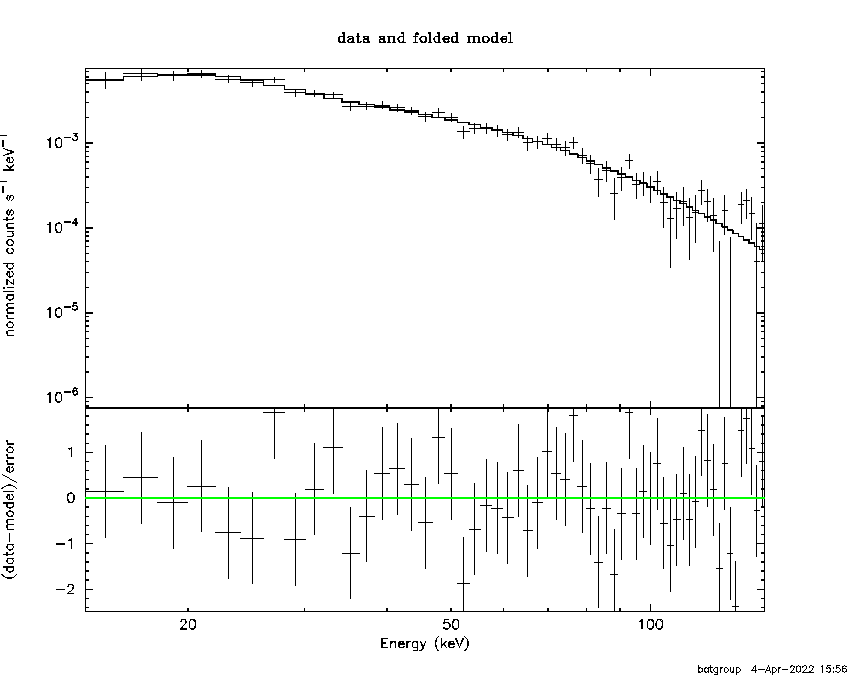
Pre-slew spectrum (Pre-slew PHA with pre-slew DRM)
Power-law model

Spectral model in power-law:
------------------------------------------------------------
Parameters  : value       lower 90%   higher 90%
Photon index: 1.87578     ( -0.063158   0.0637143 )
Norm@50keV  : 1.25198E-02    ( -0.000438976   0.000437453 )
------------------------------------------------------------
#Fit statistic  : Chi-Squared                   65.38     using 59 bins.
 Reduced chi-squared =
# Null hypothesis probability of 2.09e-01 with 57 degrees of freedom

Photon flux (15-150 keV)    in 26.37 sec: 1.77853 ( -0.0637886  0.0639962 ) ph/cm2/s
Energy fluence (15-150 keV)             : 3.03503e-06 ( -1.06224e-07  1.06494e-07 ) ergs/cm2
Cutoff power-law model
Spectral model in the cutoff power-law:
------------------------------------------------------------
Parameters  : value       lower 90%   higher 90%
Photon index: 1.44384     ( -0.282205   0.264431 )
Epeak [keV] : 62.3012      ( -9.05626 24.4619 )
Norm@50keV  : 2.07745E-02    ( -0.00541905   0.0079985 )
------------------------------------------------------------
#Fit statistic  : Chi-Squared                   57.32     using 59 bins.
 Reduced chi-squared =
# Null hypothesis probability of 4.26e-01 with 56 degrees of freedom

Photon flux (15-150 keV)    in 26.37 sec: 1.72434 ( -0.07088  0.07114 ) ph/cm2/s
Energy fluence (15-150 keV)             : 2.92388e-06 ( -1.25785e-07  1.25495e-07 ) ergs/cm2
Band function
Spectral model in the Band function:
------------------------------------------------------------
Parameters  : value       lower 90%   higher 90%
alpha       :    (     )
beta        :     (     )
Epeak [keV] :       (   )
Norm@50keV   :     (     )
------------------------------------------------------------

Photon flux (15-150 keV)    in  sec:  (    ) ph/cm2/s
Energy fluence (15-150 keV)             : 0 ( 0  0 ) ergs/cm2
S(25-50 keV) vs. S(50-100 keV) plot
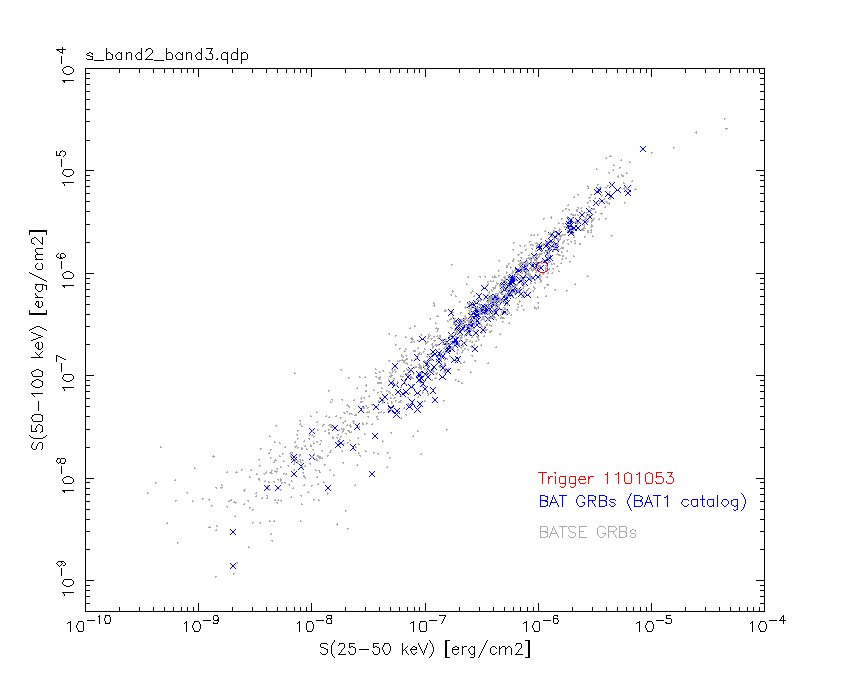
S(25-50 keV)  = 1.09e-06
S(50-100 keV) = 1.15e-06
T90 vs. Hardness ratio plot
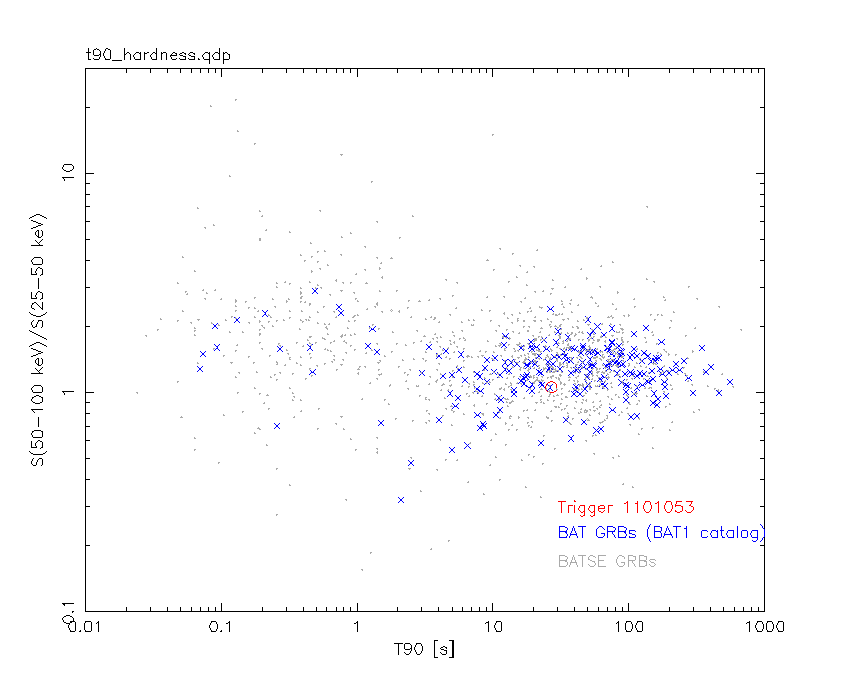
T90                                   = 26.9679999351501 sec.
Hardness ratio (energy fluence ratio) = 1.05505
Color vs. Color plot
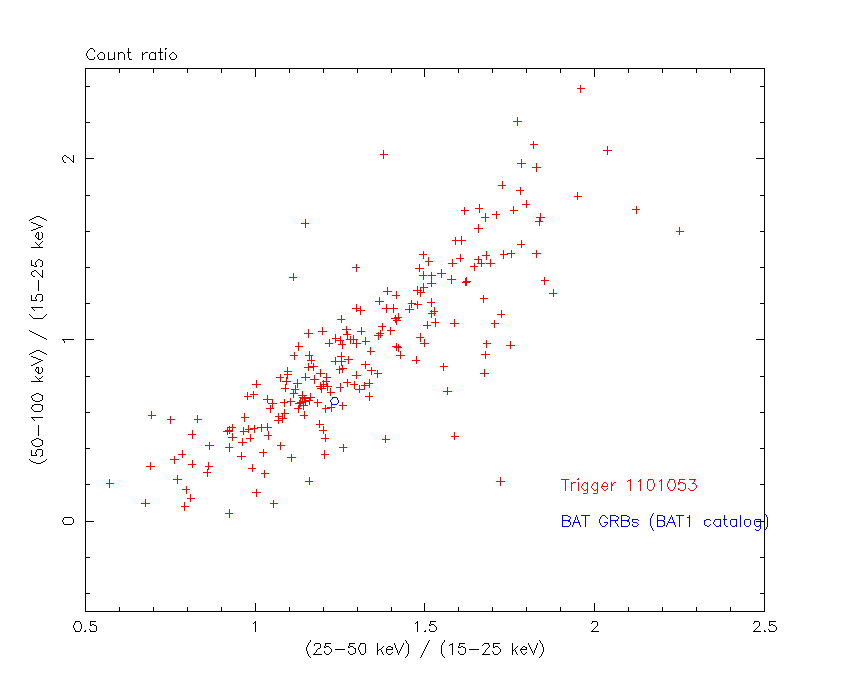
Count Ratio  (25-50 keV) / (15-25 keV) = 1.23331
Count Ratio (50-100 keV) / (15-25 keV) = 0.662613
Mask shadow pattern
IMX = -5.577144555556388E-01, IMY = 3.908152373076193E-01
TIME vs. PHA plot around the trigger time
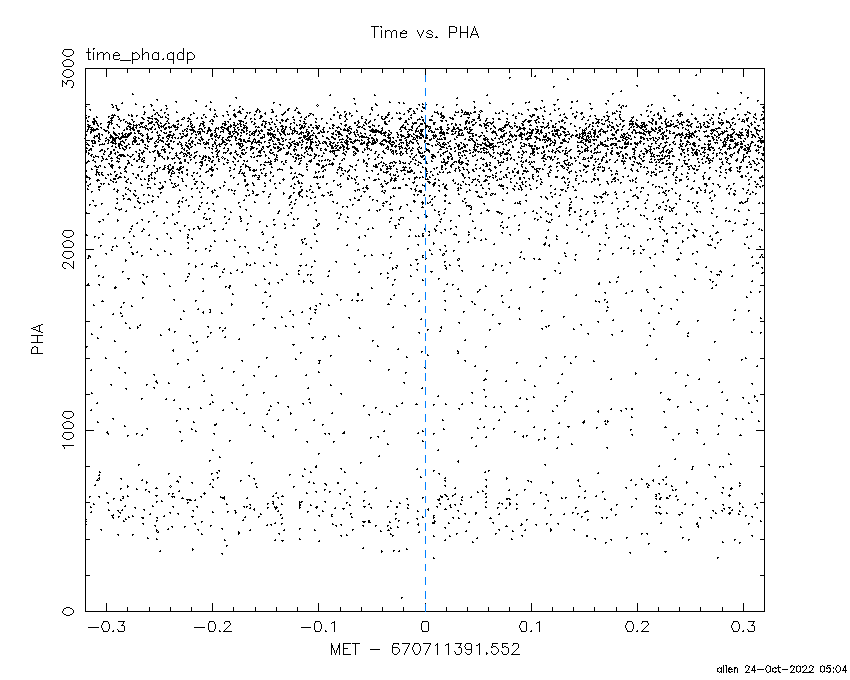
Blue+Cyan dotted lines: Time interval of the scaled map
From 0.000000 to 1.024000
TIME vs. DetID plot around the trigger time

Blue+Cyan dotted lines: Time interval of the scaled map
From 0.000000 to 1.024000
100 us light curve (15-350 keV)

Blue+Cyan dotted lines: Time interval of the scaled map
From 0.000000 to 1.024000
Spacecraft aspect plot

Bright source in the pre-burst/pre-slew/post-slew images
Pre-burst image of 15-350 keV band
Time interval of the image:
-239.552000 -14.420000

# RAcent  DECcent POSerr Theta    Phi  PeakCts   SNR AngSep     Name
#  [deg]    [deg]    ['] [deg]  [deg]                   [']
254.4401  35.3844    2.8  21.1   12.6   1.2651   4.2    2.7	Her X-1
288.7860  10.9194    3.3  56.3  -19.6   3.4671   3.5    1.7	GRS 1915+105
299.6157  35.2150    1.0  42.4  -49.3   7.7473  11.1    1.5	Cyg X-1
308.2631  40.8563   27.5  43.4  -62.2   0.4978   0.4    9.0	Cyg X-3
252.3759   2.6894    4.0  53.0   26.0   3.2551   2.9 ------	UNKNOWN
218.9846  40.2576    2.4  22.5   94.8   1.7622   4.8 ------	UNKNOWN
179.4802  54.9803    2.7  35.7  153.3   1.9719   4.4 ------	UNKNOWN
127.0683  71.7576    2.7  45.7 -166.7   2.2950   4.2 ------	UNKNOWN
300.0947  34.3563    3.0  43.3  -48.8   2.6209   3.9 ------	UNKNOWN
 22.0912  73.6895    2.6  47.9 -129.1   5.8130   4.5 ------	UNKNOWN
Pre-slew background subtracted image of 15-350 keV band
Time interval of the image:
-14.420000 11.948600

# RAcent  DECcent POSerr Theta    Phi  PeakCts   SNR AngSep     Name
#  [deg]    [deg]    ['] [deg]  [deg]                   [']
254.3434  35.4243   18.7  21.0   12.8   0.0509   0.6    7.4	Her X-1
288.7525  11.0173    4.2  56.2  -19.6   0.9064   2.7    5.1	GRS 1915+105
299.7838  35.2817   61.1  42.4  -49.5  -0.0403  -0.2   10.6	Cyg X-1
308.0482  40.8627    4.1  43.3  -62.0   0.9868   2.9    6.1	Cyg X-3
284.3199   5.9781    2.1  58.7  -12.3   2.7572   5.5 ------	UNKNOWN
284.5508   6.1482    2.4  58.6  -12.6   2.6392   5.3 ------	UNKNOWN
190.9732  89.1803    0.3  34.3 -145.0   5.1337  45.5 ------	UNKNOWN
Post-slew image of 15-350 keV band
Time interval of the image:
83.948600 962.479900

# RAcent  DECcent POSerr Theta    Phi  PeakCts   SNR AngSep     Name
#  [deg]    [deg]    ['] [deg]  [deg]                   [']
299.5862  35.1984    0.9  55.1  -17.0  31.7397  13.1    0.3	Cyg X-1
308.2970  40.9619    7.5  49.4  -25.8  -3.3352  -1.5    8.5	Cyg X-3
257.6382  39.8537    2.7  49.8   24.9   8.1328   4.3 ------	UNKNOWN
188.3550  66.7495    3.0  22.4   94.9   4.8727   3.8 ------	UNKNOWN
109.8627  33.0489    2.8  56.8  173.8  14.6252   4.1 ------	UNKNOWN
106.2693  33.0364    3.1  56.9  177.4  14.3876   3.7 ------	UNKNOWN
 68.9251  35.2414    4.4  55.2 -145.3  13.9234   2.7 ------	UNKNOWN
Plot creation:
Mon Oct 24 05:04:14 EDT 2022