Estimated redshift from machine learning (Ukwatta et al. 2016) - may take a few minute to calcaulte
Image
Pre-slew 15.0-350.0 keV image (Event data)
#   RAcent    DECcent   POSerr    Theta     Phi              Peak Cts       SNR   Name
  202.3958    47.0654   0.0081    37.1088   146.9556         2.0030748     23.624 TRIG_01101675

Foreground time interval of the image:
 -0.548  10.149 (delta_t =  10.697 [sec])
Background time interval of the image:
-51.051  -0.548 (delta_t =  50.503 [sec])
Lightcurves
Notes:
- 1) The mask-weighted light curves are using the flight position.
- 2) Multiple plots of different time binning/intervals are shown to cover all scenarios of short/long GRBs, rate/image triggers, and real/false positives.
- 3) For all the mask-weighted lightcurves, the y-axis units are counts/sec/det where a det is 0.4 x 0.4 = 0.16 sq cm.
- 4) The verticle lines correspond to following: green dotted lines are T50 interval, black dotted lines are T90 interval, blue solid line(s) is a spacecraft slew start time, and orange solid line(s) is a spacecraft slew end time.
- 5) Time of each bin is in the middle of the bin.
1 s binning
From T0-310 s to T0+310 s

From T100_start - 20 s to T100_end + 30 s

Full time interval
64 ms binning
Full time interval
From T100_start to T100_end
From T0-5 sec to T0+5 sec

16 ms binning
From T100_start-5 s to T100_start+5 s

Blue+Cyan dotted lines: Time interval of the scaled map
From 0.000000 to 0.512000
8 ms binning
From T100_start-3 s to T100_start+3 s

Blue+Cyan dotted lines: Time interval of the scaled map
From 0.000000 to 0.512000
2 ms binning
From T100_start-1 s to T100_start+1 s

Blue+Cyan dotted lines: Time interval of the scaled map
From 0.000000 to 0.512000
SN=5 or 10 sec. binning (whichever binning is satisfied first)

SN=5 or 10 sec. binning (T < 200 sec)

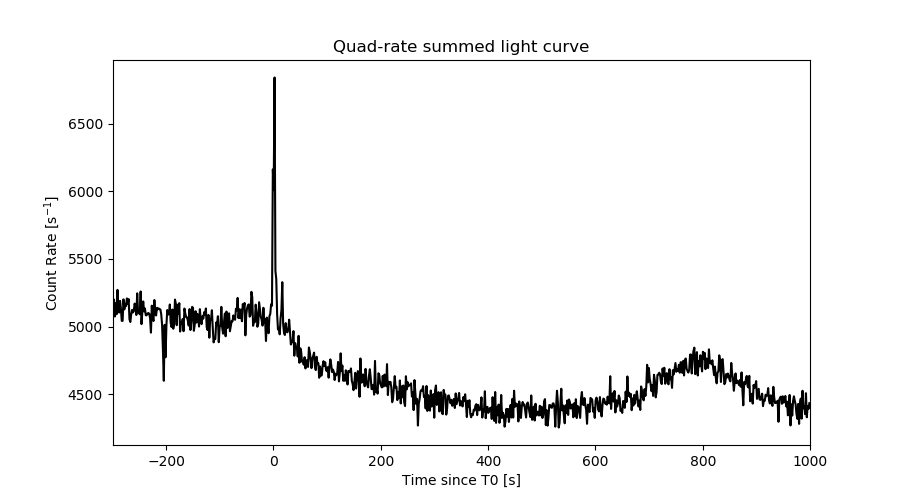
Quad-rate summed light curves (from T0-300s to T0+1000s)
Spectral Evolution

Spectra
Notes:
- 1) The fitting includes the systematic errors.
- 2) When the burst includes telescope slew time periods, the fitting uses an average response file made from multiple 5-s response files through out the slew time plus single time preiod for the non-slew times, and weighted by the total counts in the corresponding time period using addrmf. An average response file is needed becuase a spectral fit using the pre-slew DRM will introduce some errors in both a spectral shape and a normalization if the PHA file contains a lot of the slew/post-slew time interval.
- 3) For fits to more complicated models (e.g. a power-law over a cutoff power-law), the BAT team has decided to require a chi-square improvement of more than 6 for each extra dof.
Time averaged spectrum fit using the average DRM
Power-law model

Time interval is from   -0.548 sec. to   18.256 sec.

Spectral model in power-law:
------------------------------------------------------------
Parameters  : value       lower 90%   higher 90%
Photon index: 2.13695     ( -0.12535   0.130455 )
Norm@50keV  : 7.12773E-03    ( -0.000625011   0.000616886 )
------------------------------------------------------------
#Fit statistic  : Chi-Squared                   68.28     using 59 bins.
 Reduced chi-squared = 1.19789
# Null hypothesis probability of 1.46e-01 with 57 degrees of freedom

Photon flux (15-150 keV)    in 18.8 sec: 1.14237 ( -0.07859  0.07865 ) ph/cm2/s
Energy fluence (15-150 keV)             : 1.25008e-06 ( -9.79328e-08  9.91561e-08 ) ergs/cm2
Cutoff power-law model

Time interval is from   -0.548 sec. to   18.256 sec.
Spectral model in the cutoff power-law:
------------------------------------------------------------
Parameters  : value       lower 90%   higher 90%
Photon index: 1.15898     ( -0.613502   0.533713 )
Epeak [keV] : 35.6756      ( -10.0503 6.8226 )
Norm@50keV  : 2.61070E-02    ( -0.0130798   0.0330975 )
------------------------------------------------------------
#Fit statistic  : Chi-Squared                   57.37     using 59 bins.
 Reduced chi-squared = 1.02446
# Null hypothesis probability of 4.24e-01 with 56 degrees of freedom

Photon flux (15-150 keV)    in 18.8 sec: 1.10117 ( -0.08097  0.08115 ) ph/cm2/s
Energy fluence (15-150 keV)             : 1.15361e-06 ( -1.04239e-07  1.07952e-07 ) ergs/cm2
Band function

Time interval is from   -0.548 sec. to   18.256 sec.


Spectral model in the Band function:
------------------------------------------------------------
Parameters  : value       lower 90%   higher 90%
alpha       :    (     )
beta        :     (     )
Epeak [keV] :       (   )
Norm@50keV   :     (     )
------------------------------------------------------------

Photon flux (15-150 keV)    in  sec:  (    ) ph/cm2/s
Energy fluence (15-150 keV)             : 0 ( 0  0 ) ergs/cm2
Single BB

Spectral model blackbody:
------------------------------------------------------------
Parameters  : value    Lower 90%  Upper 90%
kT [keV]    : 9.43685  (-0.759009  0.822712)
R^2/D10^2   : 0.651993  (-0.182884   0.255426)
(R is the radius in km and D10 is the distance to the source in units of 10 kpc)
------------------------------------------------------------
#Fit statistic  : Chi-Squared                   91.19     using 59 bins.
 Reduced chi-squared =
# Null hypothesis probability of 2.71e-03 with 57 degrees of freedom

Energy  Fluence     90% Error
[keV]   [erg/cm2]   [erg/cm2]
15- 25  2.174e-07   2.776e-08
25- 50  4.968e-07   3.854e-08
50-150  2.187e-07   4.158e-08
15-150  9.328e-07   7.623e-08
Thermal bremsstrahlung (OTTB)

Spectral model: thermal bremsstrahlung
------------------------------------------------------------
Parameters  : value         Lower 90%    Upper 90%
kT [keV]    : 53.9705       (-9.10579      12.1698)
Norm        : 6.22858       (-0.677546     0.823881)
------------------------------------------------------------
#Fit statistic  : Chi-Squared                   57.58     using 59 bins.
 Reduced chi-squared =
# Null hypothesis probability of 4.53e-01 with 57 degrees of freedom

Energy  Fluence     90% Error
[keV]   [erg/cm2]   [erg/cm2]
15- 25  2.910e-07   2.181e-08
25- 50  4.291e-07   6.383e-08
50-150  4.470e-07   1.465e-07
15-150  1.167e-06   2.421e-07
Double BB
Spectral model: bbodyrad<1> + bbodyrad<2>
------------------------------------------------------------
Parameters  : value         Lower 90%    Upper 90%
kT1 [keV]   : 5.74920        (-0.991767      1.04933)
R1^2/D10^2  : 3.13242        (-1.40803      3.16851)
kT2 [keV]   : 17.1773        (-3.10235      4.50405)
R2^2/D10^2  : 4.08483E-02    (-0.0261449   0.0586568)
------------------------------------------------------------
#Fit statistic  : Chi-Squared                   53.44     using 59 bins.
 Reduced chi-squared =
# Null hypothesis probability of 5.34e-01 with 55 degrees of freedom

Energy  Fluence     90% Error
[keV]   [erg/cm2]   [erg/cm2]
15- 25  2.886e-07   7.901e-08
25- 50  4.254e-07   1.280e-07
50-150  4.507e-07   2.303e-07
15-150  1.165e-06   3.920e-07
Peak spectrum fit
Power-law model

Time interval is from    2.476 sec. to    3.476 sec.

Spectral model in power-law:
------------------------------------------------------------
Parameters  : value       lower 90%   higher 90%
Photon index: 2.09386     ( -0.136789   0.142883 )
Norm@50keV  : 3.08836E-02    ( -0.00323091   0.00319175 )
------------------------------------------------------------
#Fit statistic  : Chi-Squared                   78.40     using 59 bins.
 Reduced chi-squared = 1.37544
# Null hypothesis probability of 3.16e-02 with 57 degrees of freedom

Photon flux (15-150 keV)    in 1 sec: 4.84461 ( -0.41566  0.4158 ) ph/cm2/s
Energy fluence (15-150 keV)             : 2.86807e-07 ( -2.76458e-08  2.79533e-08 ) ergs/cm2
Cutoff power-law model

Time interval is from    2.476 sec. to    3.476 sec.
Spectral model in the cutoff power-law:
------------------------------------------------------------
Parameters  : value       lower 90%   higher 90%
Photon index: -4.12222E-02     ( -0.942641   0.785074 )
Epeak [keV] : 39.4036      ( -4.13515 4.4791 )
Norm@50keV  : 0.538059    ( -0.539948   1.40583 )
------------------------------------------------------------
#Fit statistic  : Chi-Squared                   50.45     using 59 bins.
 Reduced chi-squared = 0.900893
# Null hypothesis probability of 6.84e-01 with 56 degrees of freedom

Photon flux (15-150 keV)    in 1 sec: 4.67404 ( -0.41718  0.41801 ) ph/cm2/s
Energy fluence (15-150 keV)             : 2.58607e-07 ( -2.63601e-08  2.75537e-08 ) ergs/cm2
Band function

Time interval is from    2.476 sec. to    3.476 sec.


Spectral model in the Band function:
------------------------------------------------------------
Parameters  : value       lower 90%   higher 90%
alpha       :    (     )
beta        :     (     )
Epeak [keV] :       (   )
Norm@50keV   :     (     )
------------------------------------------------------------

Photon flux (15-150 keV)    in  sec:  (    ) ph/cm2/s
Energy fluence (15-150 keV)             : 0 ( 0  0 ) ergs/cm2
Single BB

Spectral model blackbody:
------------------------------------------------------------
Parameters  : value    Lower 90%  Upper 90%
kT [keV]    : 10.0254  (-0.807478  0.869314)
R^2/D10^2   : 2.41271  (-0.671509   0.929671)
(R is the radius in km and D10 is the distance to the source in units of 10 kpc)
------------------------------------------------------------
#Fit statistic  : Chi-Squared                   57.21     using 59 bins.
 Reduced chi-squared =
# Null hypothesis probability of 4.67e-01 with 57 degrees of freedom

Energy  Fluence     90% Error
[keV]   [erg/cm2]   [erg/cm2]
15- 25  4.943e-08   5.935e-09
25- 50  1.233e-07   1.190e-08
50-150  6.484e-08   1.520e-08
15-150  2.376e-07   2.365e-08
Thermal bremsstrahlung (OTTB)
Spectral model: thermal bremsstrahlung
------------------------------------------------------------
Parameters  : value         Lower 90%    Upper 90%
kT [keV]    : 55.8308       (-10.3941      13.4533)
Norm        : 27.1140       (-3.46324     3.73934)
------------------------------------------------------------
#Fit statistic  : Chi-Squared                   59.63     using 59 bins.
 Reduced chi-squared =
# Null hypothesis probability of 3.80e-01 with 57 degrees of freedom

Energy  Fluence     90% Error
[keV]   [erg/cm2]   [erg/cm2]
15- 25  6.729e-08   6.785e-09
25- 50  1.001e-07   8.740e-09
50-150  1.071e-07   2.416e-08
15-150  2.745e-07   2.850e-08
Double BB

Spectral model: bbodyrad<1> + bbodyrad<2>
------------------------------------------------------------
Parameters  : value         Lower 90%    Upper 90%
kT1 [keV]   : 6.14896        (-2.58565      2.66412)
R1^2/D10^2  : 7.40527        (-4.42455      34.3718)
kT2 [keV]   : 13.4050        (-2.73245      8.51641)
R2^2/D10^2  : 0.533355    (-0.499796   0.708847)
------------------------------------------------------------
#Fit statistic  : Chi-Squared                   49.87     using 59 bins.
 Reduced chi-squared =
# Null hypothesis probability of 6.70e-01 with 55 degrees of freedom

Energy  Fluence     90% Error
[keV]   [erg/cm2]   [erg/cm2]
15- 25  5.881e-08   3.111e-08
25- 50  1.127e-07   5.740e-08
50-150  8.764e-08   5.065e-08
15-150  2.592e-07   1.341e-07
Pre-slew spectrum (Pre-slew PHA with pre-slew DRM)
Power-law model
Spectral model in power-law:
------------------------------------------------------------
Parameters  : value       lower 90%   higher 90%
Photon index: 2.07289     ( -0.114532   0.118317 )
Norm@50keV  : 1.09228E-02    ( -0.000860326   0.000850399 )
------------------------------------------------------------
#Fit statistic  : Chi-Squared                   66.91     using 59 bins.
 Reduced chi-squared =
# Null hypothesis probability of 1.73e-01 with 57 degrees of freedom

Photon flux (15-150 keV)    in 10.7 sec: 1.69581 ( -0.109742  0.109821 ) ph/cm2/s
Energy fluence (15-150 keV)             : 1.08321e-06 ( -7.87087e-08  7.94533e-08 ) ergs/cm2
Cutoff power-law model
Spectral model in the cutoff power-law:
------------------------------------------------------------
Parameters  : value       lower 90%   higher 90%
Photon index: 1.11985     ( -0.560002   0.491376 )
Epeak [keV] : 38.8575      ( -7.73913 6.8363 )
Norm@50keV  : 3.83162E-02    ( -0.0180064   0.0420274 )
------------------------------------------------------------
#Fit statistic  : Chi-Squared                   54.60     using 59 bins.
 Reduced chi-squared =
# Null hypothesis probability of 5.28e-01 with 56 degrees of freedom

Photon flux (15-150 keV)    in 10.7 sec: 1.63678 ( -0.11295  0.11315 ) ph/cm2/s
Energy fluence (15-150 keV)             : 1.00171e-06 ( -8.47643e-08  8.71226e-08 ) ergs/cm2
Band function

Spectral model in the Band function:
------------------------------------------------------------
Parameters  : value       lower 90%   higher 90%
alpha       :    (     )
beta        :     (     )
Epeak [keV] :       (   )
Norm@50keV   :     (     )
------------------------------------------------------------

Photon flux (15-150 keV)    in  sec:  (    ) ph/cm2/s
Energy fluence (15-150 keV)             : 0 ( 0  0 ) ergs/cm2
S(25-50 keV) vs. S(50-100 keV) plot

S(25-50 keV)  = 3.91e-07
S(50-100 keV) = 3.55e-07
T90 vs. Hardness ratio plot

T90                                   = 17.2439999580383 sec.
Hardness ratio (energy fluence ratio) = 0.907928
Color vs. Color plot

Count Ratio  (25-50 keV) / (15-25 keV) = 1.03999
Count Ratio (50-100 keV) / (15-25 keV) = 0.527769
Mask shadow pattern
IMX = -6.341652372335767E-01, IMY = -4.125302674174665E-01
TIME vs. PHA plot around the trigger time

Blue+Cyan dotted lines: Time interval of the scaled map
From 0.000000 to 0.512000
TIME vs. DetID plot around the trigger time

Blue+Cyan dotted lines: Time interval of the scaled map
From 0.000000 to 0.512000
100 us light curve (15-350 keV)
Blue+Cyan dotted lines: Time interval of the scaled map
From 0.000000 to 0.512000
Spacecraft aspect plot

Bright source in the pre-burst/pre-slew/post-slew images
Pre-burst image of 15-350 keV band
Time interval of the image:
-51.051400 -0.548000

# RAcent  DECcent POSerr Theta    Phi  PeakCts   SNR AngSep     Name
#  [deg]    [deg]    ['] [deg]  [deg]                   [']
254.4086  35.1845   30.8   4.7   18.6   0.0358   0.4    9.8	Her X-1
268.4880  -1.5663    4.9  43.6    6.3   0.3910   2.4    9.9	SW J1753.5-0127
274.0149 -14.1197    5.9  57.2    4.4   1.0207   1.9    5.0	GX 17+2
288.6804  10.8765    5.8  42.5  -28.6  -0.3400  -2.0    8.1	GRS 1915+105
299.5804  35.2010    1.3  36.5  -69.5   1.8255   8.9    0.5	Cyg X-1
308.1922  41.0338    3.7  41.0  -81.8   1.1991   3.1    6.1	Cyg X-3
277.8208  17.6796    2.5  30.5  -22.3   0.5127   4.7 ------	UNKNOWN
286.4542  50.1673    2.5  25.3  -96.9   0.5653   4.6 ------	UNKNOWN
304.8104  38.5920    2.5  39.3  -77.0   1.2933   4.6 ------	UNKNOWN
Pre-slew background subtracted image of 15-350 keV band
Time interval of the image:
-0.548000 10.148580

# RAcent  DECcent POSerr Theta    Phi  PeakCts   SNR AngSep     Name
#  [deg]    [deg]    ['] [deg]  [deg]                   [']
254.4578  35.3322  243.7   4.5   17.8   0.0020   0.0    0.6	Her X-1
268.2799  -1.5222    5.1  43.5    6.5  -0.1808  -2.3    6.7	SW J1753.5-0127
273.9900 -13.9963    5.9  57.1    4.4   0.5320   2.0    2.6	GX 17+2
288.8522  11.0604    7.9  42.5  -29.0  -0.1115  -1.5    7.6	GRS 1915+105
299.4210  35.2621   37.0  36.3  -69.5   0.0273   0.3    9.1	Cyg X-1
308.2433  40.9986    6.5  41.1  -81.8  -0.3260  -1.8    6.6	Cyg X-3
229.5167   4.1897    2.2  41.6   65.9   1.1268   5.3 ------	UNKNOWN
202.3958  47.0654    0.5  37.1  147.0   2.0030  23.6 ------	UNKNOWN
286.6969  45.6739    2.2  24.9  -86.3   0.2907   5.2 ------	UNKNOWN
Post-slew image of 15-350 keV band
Time interval of the image:
91.948590 183.111400

# RAcent  DECcent POSerr Theta    Phi  PeakCts   SNR AngSep     Name
#  [deg]    [deg]    ['] [deg]  [deg]                   [']
254.4526  35.4093    3.6  40.0   -8.9  -0.6173  -3.2    4.0	Her X-1
151.5640  24.8951    2.9  45.7  162.9   1.4388   4.0 ------	UNKNOWN
162.2029  48.7793    2.4  26.7 -167.8   0.6492   4.8 ------	UNKNOWN
128.0964  61.7596    2.0  43.0 -138.4   1.5248   5.7 ------	UNKNOWN
275.7708  58.8901    2.4  43.3  -50.3   1.6498   4.9 ------	UNKNOWN
Plot creation:
Mon Oct 24 05:02:57 EDT 2022