Estimated redshift from machine learning (Ukwatta et al. 2016) - may take a few minute to calcaulte
Image
Pre-slew 15.0-350.0 keV image (Event data)

#   RAcent    DECcent   POSerr    Theta     Phi              Peak Cts       SNR   Name
   97.6173     9.5473   0.0038     1.4259   -54.0754         3.3173963     50.244 TRIG_01104692

Foreground time interval of the image:
 -6.532  11.877 (delta_t =  18.409 [sec])
Background time interval of the image:
-239.024  -6.532 (delta_t = 232.492 [sec])
Lightcurves
Notes:
- 1) The mask-weighted light curves are using the flight position.
- 2) Multiple plots of different time binning/intervals are shown to cover all scenarios of short/long GRBs, rate/image triggers, and real/false positives.
- 3) For all the mask-weighted lightcurves, the y-axis units are counts/sec/det where a det is 0.4 x 0.4 = 0.16 sq cm.
- 4) The verticle lines correspond to following: green dotted lines are T50 interval, black dotted lines are T90 interval, blue solid line(s) is a spacecraft slew start time, and orange solid line(s) is a spacecraft slew end time.
- 5) Time of each bin is in the middle of the bin.
1 s binning
From T0-310 s to T0+310 s

From T100_start - 20 s to T100_end + 30 s

Full time interval

64 ms binning
Full time interval

From T100_start to T100_end

From T0-5 sec to T0+5 sec

16 ms binning
From T100_start-5 s to T100_start+5 s

Blue+Cyan dotted lines: Time interval of the scaled map
From 0.000000 to 1.024000
8 ms binning
From T100_start-3 s to T100_start+3 s

Blue+Cyan dotted lines: Time interval of the scaled map
From 0.000000 to 1.024000
2 ms binning
From T100_start-1 s to T100_start+1 s

Blue+Cyan dotted lines: Time interval of the scaled map
From 0.000000 to 1.024000
SN=5 or 10 sec. binning (whichever binning is satisfied first)

SN=5 or 10 sec. binning (T < 200 sec)

Quad-rate summed light curves (from T0-300s to T0+1000s)

Spectral Evolution

Spectra
Notes:
- 1) The fitting includes the systematic errors.
- 2) When the burst includes telescope slew time periods, the fitting uses an average response file made from multiple 5-s response files through out the slew time plus single time preiod for the non-slew times, and weighted by the total counts in the corresponding time period using addrmf. An average response file is needed becuase a spectral fit using the pre-slew DRM will introduce some errors in both a spectral shape and a normalization if the PHA file contains a lot of the slew/post-slew time interval.
- 3) For fits to more complicated models (e.g. a power-law over a cutoff power-law), the BAT team has decided to require a chi-square improvement of more than 6 for each extra dof.
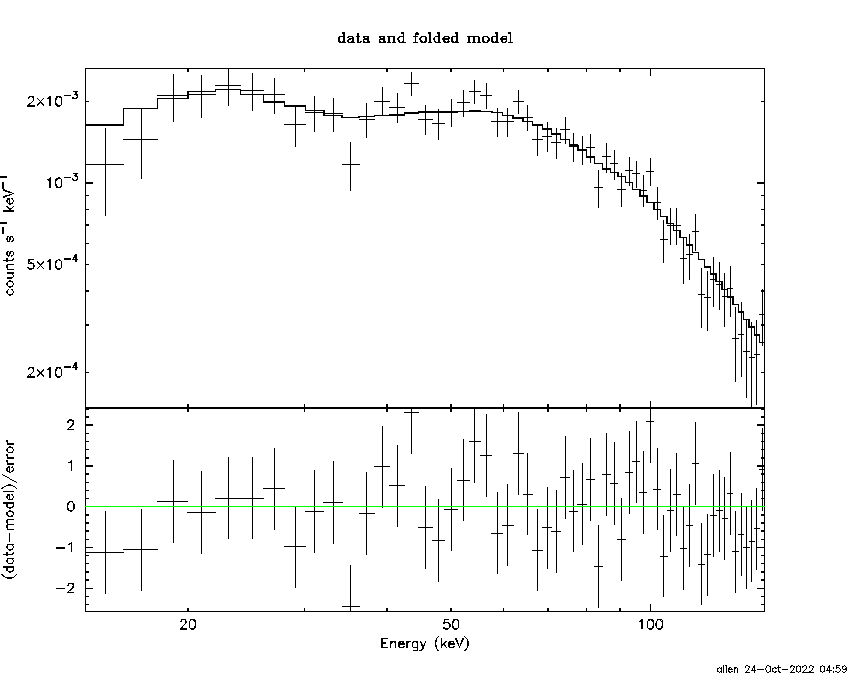
Time averaged spectrum fit using the average DRM
Power-law model

Time interval is from   -6.532 sec. to   94.604 sec.

Spectral model in power-law:
------------------------------------------------------------
Parameters  : value       lower 90%   higher 90%
Photon index: 1.25005     ( -0.0207862   0.0206947 )
Norm@50keV  : 4.31055E-02    ( -0.00054605   0.000544778 )
------------------------------------------------------------
#Fit statistic  : Chi-Squared                   22.58     using 59 bins.
 Reduced chi-squared = 0.39614
# Null hypothesis probability of 1.00e+00 with 57 degrees of freedom

Photon flux (15-150 keV)    in 101.1 sec: 5.09829 ( -0.07444  0.07468 ) ph/cm2/s
Energy fluence (15-150 keV)             : 4.36186e-05 ( -4.8047e-07  4.80661e-07 ) ergs/cm2
Cutoff power-law model

Time interval is from   -6.532 sec. to   94.604 sec.
Spectral model in the cutoff power-law:
------------------------------------------------------------
Parameters  : value       lower 90%   higher 90%
Photon index: 1.16069     ( -0.0867215   0.0432498 )
Epeak [keV] : 635.164      ( -275.558 7084.34 )
Norm@50keV  : 4.65144E-02    ( -0.00302791   0.00349053 )
------------------------------------------------------------
#Fit statistic  : Chi-Squared                   19.41     using 59 bins.
 Reduced chi-squared = 0.346607
# Null hypothesis probability of 1.00e+00 with 56 degrees of freedom

Photon flux (15-150 keV)    in 101.1 sec: 2.89154 (    ) ph/cm2/s
Energy fluence (15-150 keV)             : 4.35412e-05 ( -4.85492e-07  4.85966e-07 ) ergs/cm2
Band function

Time interval is from   -6.532 sec. to   94.604 sec.


Spectral model in the Band function:
------------------------------------------------------------
Parameters  : value       lower 90%   higher 90%
alpha       :    (     )
beta        :     (     )
Epeak [keV] :       (   )
Norm@50keV   :     (     )
------------------------------------------------------------

Photon flux (15-150 keV)    in  sec:  (    ) ph/cm2/s
Energy fluence (15-150 keV)             : 0 ( 0  0 ) ergs/cm2
Single BB

Spectral model blackbody:
------------------------------------------------------------
Parameters  : value    Lower 90%  Upper 90%
kT [keV]    : 24.1766  (  )
R^2/D10^2   : 0.121331  (   )
(R is the radius in km and D10 is the distance to the source in units of 10 kpc)
------------------------------------------------------------
#Fit statistic  : Chi-Squared                 1493.52     using 59 bins.
 Reduced chi-squared =
# Null hypothesis probability of 9.03e-275 with 57 degrees of freedom

Energy  Fluence     90% Error
[keV]   [erg/cm2]   [erg/cm2]
15- 25  1.267e-06   3.084e-08
25- 50  7.067e-06   1.426e-07
50-150  3.075e-05   3.892e-07
15-150  3.909e-05   4.145e-07
Thermal bremsstrahlung (OTTB)

Spectral model: thermal bremsstrahlung
------------------------------------------------------------
Parameters  : value         Lower 90%    Upper 90%
kT [keV]    : 199.363       (      )
Norm        : 23.3728       (     )
------------------------------------------------------------
#Fit statistic  : Chi-Squared                 1011.06     using 59 bins.
 Reduced chi-squared =
# Null hypothesis probability of 1.17e-174 with 57 degrees of freedom

Energy  Fluence     90% Error
[keV]   [erg/cm2]   [erg/cm2]
15- 25  5.884e-06   7.633e-08
25- 50  1.132e-05   1.618e-07
50-150  2.482e-05   3.538e-07
15-150  4.203e-05   5.561e-07
Double BB

Spectral model: bbodyrad<1> + bbodyrad<2>
------------------------------------------------------------
Parameters  : value         Lower 90%    Upper 90%
kT1 [keV]   : 9.08913        (-0.448744      0.469033)
R1^2/D10^2  : 1.83594        (-0.279959      0.341699)
kT2 [keV]   : 36.4050        (-1.48374      1.7085)
R2^2/D10^2  : 2.66063E-02    (-0.00380842   0.00407539)
------------------------------------------------------------
#Fit statistic  : Chi-Squared                   40.19     using 59 bins.
 Reduced chi-squared =
# Null hypothesis probability of 9.33e-01 with 55 degrees of freedom

Energy  Fluence     90% Error
[keV]   [erg/cm2]   [erg/cm2]
15- 25  3.492e-06   1.628e-07
25- 50  9.732e-06   2.128e-07
50-150  3.010e-05   4.499e-07
15-150  4.333e-05   7.128e-07
Peak spectrum fit
Power-law model

Time interval is from   42.004 sec. to   43.004 sec.

Spectral model in power-law:
------------------------------------------------------------
Parameters  : value       lower 90%   higher 90%
Photon index: 1.12826     ( -0.0362801   0.0361994 )
Norm@50keV  : 0.254136    ( -0.00511212   0.00510877 )
------------------------------------------------------------
#Fit statistic  : Chi-Squared                   53.39     using 59 bins.
 Reduced chi-squared = 0.936667
# Null hypothesis probability of 6.11e-01 with 57 degrees of freedom

Photon flux (15-150 keV)    in 1 sec: 1.18494 (    ) ph/cm2/s
Energy fluence (15-150 keV)             : 2.63384e-06 ( -5.56792e-08  5.57743e-08 ) ergs/cm2
Cutoff power-law model

Time interval is from   42.004 sec. to   43.004 sec.
Spectral model in the cutoff power-law:
------------------------------------------------------------
Parameters  : value       lower 90%   higher 90%
Photon index: 0.928372     ( -0.149351   0.14476 )
Epeak [keV] : 319.371      ( -110.05 610.777 )
Norm@50keV  : 0.309343    ( -0.0401516   0.0475518 )
------------------------------------------------------------
#Fit statistic  : Chi-Squared                   47.80     using 59 bins.
 Reduced chi-squared = 0.853571
# Null hypothesis probability of 7.74e-01 with 56 degrees of freedom

Photon flux (15-150 keV)    in 1 sec: 29.2354 ( -0.6645  0.6661 ) ph/cm2/s
Energy fluence (15-150 keV)             : 2.61228e-06 ( -5.82853e-08  5.80811e-08 ) ergs/cm2
Band function

Time interval is from   42.004 sec. to   43.004 sec.


Spectral model in the Band function:
------------------------------------------------------------
Parameters  : value       lower 90%   higher 90%
alpha       :    (     )
beta        :     (     )
Epeak [keV] :       (   )
Norm@50keV   :     (     )
------------------------------------------------------------

Photon flux (15-150 keV)    in  sec:  (    ) ph/cm2/s
Energy fluence (15-150 keV)             : 0 ( 0  0 ) ergs/cm2
Single BB

Spectral model blackbody:
------------------------------------------------------------
Parameters  : value    Lower 90%  Upper 90%
kT [keV]    : 21.3608  (  )
R^2/D10^2   : 1.11713  (   )
(R is the radius in km and D10 is the distance to the source in units of 10 kpc)
------------------------------------------------------------
#Fit statistic  : Chi-Squared                  468.55     using 59 bins.
 Reduced chi-squared =
# Null hypothesis probability of 5.22e-66 with 57 degrees of freedom

Energy  Fluence     90% Error
[keV]   [erg/cm2]   [erg/cm2]
15- 25  9.559e-08   3.890e-09
25- 50  4.966e-07   1.545e-08
50-150  1.691e-06   5.650e-08
15-150  2.283e-06   5.600e-08
Thermal bremsstrahlung (OTTB)

Spectral model: thermal bremsstrahlung
------------------------------------------------------------
Parameters  : value         Lower 90%    Upper 90%
kT [keV]    : 199.363       (      )
Norm        : 125.070       (     )
------------------------------------------------------------
#Fit statistic  : Chi-Squared                  458.00     using 59 bins.
 Reduced chi-squared =
# Null hypothesis probability of 5.48e-64 with 57 degrees of freedom

Energy  Fluence     90% Error
[keV]   [erg/cm2]   [erg/cm2]
15- 25  3.114e-07   6.550e-09
25- 50  5.991e-07   1.385e-08
50-150  1.314e-06   2.750e-08
15-150  2.224e-06   4.800e-08
Double BB

Spectral model: bbodyrad<1> + bbodyrad<2>
------------------------------------------------------------
Parameters  : value         Lower 90%    Upper 90%
kT1 [keV]   : 9.09553        (-0.834373      0.902676)
R1^2/D10^2  : 9.82391        (-2.33535      3.31234)
kT2 [keV]   : 35.9241        (-3.11996      4.22317)
R2^2/D10^2  : 0.176552    (-0.0528582   0.061991)
------------------------------------------------------------
#Fit statistic  : Chi-Squared                   53.07     using 59 bins.
 Reduced chi-squared =
# Null hypothesis probability of 5.49e-01 with 55 degrees of freedom

Energy  Fluence     90% Error
[keV]   [erg/cm2]   [erg/cm2]
15- 25  1.908e-07   1.400e-08
25- 50  5.528e-07   2.405e-08
50-150  1.873e-06   9.400e-08
15-150  2.617e-06   1.205e-07
Pre-slew spectrum (Pre-slew PHA with pre-slew DRM)
Power-law model
Spectral model in power-law:
------------------------------------------------------------
Parameters  : value       lower 90%   higher 90%
Photon index: 0.492885     ( -0.0611073   0.0598754 )
Norm@50keV  : 1.03890E-02    ( -0.000388709   0.000385277 )
------------------------------------------------------------
#Fit statistic  : Chi-Squared                   49.48     using 59 bins.
 Reduced chi-squared =
# Null hypothesis probability of 7.50e-01 with 57 degrees of freedom

Photon flux (15-150 keV)    in 18.41 sec: 1.23185 ( -0.0400652  0.0401201 ) ph/cm2/s
Energy fluence (15-150 keV)             : 2.57891e-06 ( -8.24254e-08  8.24737e-08 ) ergs/cm2
Cutoff power-law model

Spectral model in the cutoff power-law:
------------------------------------------------------------
Parameters  : value       lower 90%   higher 90%
Photon index: 0.224053     ( -0.258549   0.199355 )
Epeak [keV] : 445.991      ( -182.425 2524.57 )
Norm@50keV  : 1.30445E-02    ( -0.00236372   0.00305753 )
------------------------------------------------------------
#Fit statistic  : Chi-Squared                   45.86     using 59 bins.
 Reduced chi-squared =
# Null hypothesis probability of 8.31e-01 with 56 degrees of freedom

Photon flux (15-150 keV)    in 18.41 sec: 1.22059 ( -0.04119  0.04129 ) ph/cm2/s
Energy fluence (15-150 keV)             : 2.56956e-06 ( -8.40601e-08  8.37839e-08 ) ergs/cm2
Band function

Spectral model in the Band function:
------------------------------------------------------------
Parameters  : value       lower 90%   higher 90%
alpha       :    (     )
beta        :     (     )
Epeak [keV] :       (   )
Norm@50keV   :     (     )
------------------------------------------------------------

Photon flux (15-150 keV)    in  sec:  (    ) ph/cm2/s
Energy fluence (15-150 keV)             : 0 ( 0  0 ) ergs/cm2
S(25-50 keV) vs. S(50-100 keV) plot

S(25-50 keV)  = 9.43e-06
S(50-100 keV) = 1.59e-05
T90 vs. Hardness ratio plot

T90                                   = 43.1439999341965 sec.
Hardness ratio (energy fluence ratio) = 1.68611
Color vs. Color plot

Count Ratio  (25-50 keV) / (15-25 keV) = 1.56676
Count Ratio (50-100 keV) / (15-25 keV) = 1.44028
Mask shadow pattern

IMX = 1.460439315182145E-02, IMY = 2.015692605363580E-02
TIME vs. PHA plot around the trigger time

Blue+Cyan dotted lines: Time interval of the scaled map
From 0.000000 to 1.024000
TIME vs. DetID plot around the trigger time

Blue+Cyan dotted lines: Time interval of the scaled map
From 0.000000 to 1.024000
100 us light curve (15-350 keV)

Blue+Cyan dotted lines: Time interval of the scaled map
From 0.000000 to 1.024000
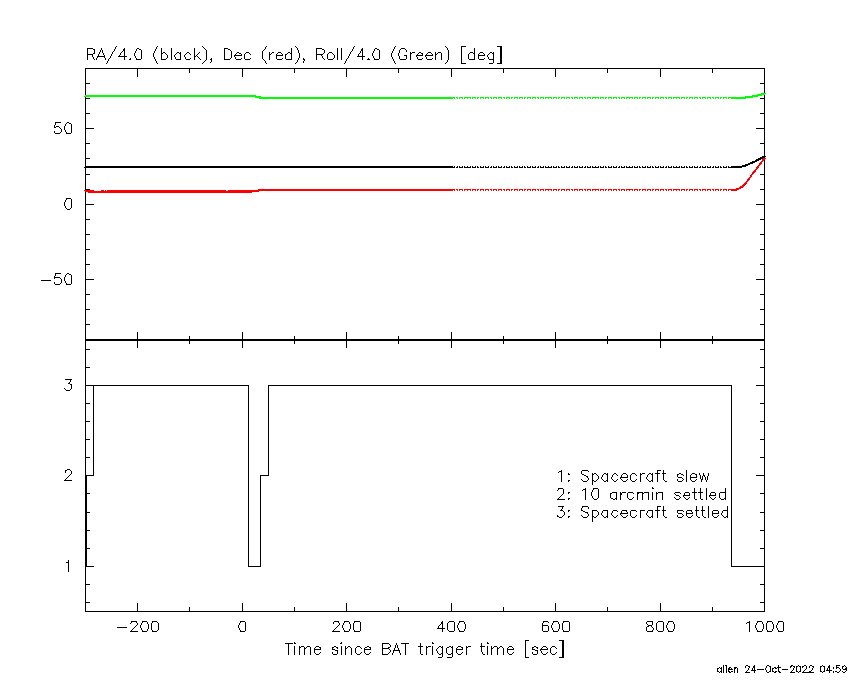
Spacecraft aspect plot
Bright source in the pre-burst/pre-slew/post-slew images
Pre-burst image of 15-350 keV band
Time interval of the image:
-239.024000 -6.532000

# RAcent  DECcent POSerr Theta    Phi  PeakCts   SNR AngSep     Name
#  [deg]    [deg]    ['] [deg]  [deg]                   [']
 83.6409  22.0072    0.5  19.7  -61.6   9.1072  21.8    0.6	Crab
111.9841 -41.6754    2.2  51.6  150.3   7.9774   5.2 ------	UNKNOWN
 66.1897  23.5245    3.1  34.4  -77.0   2.2535   3.7 ------	UNKNOWN
Pre-slew background subtracted image of 15-350 keV band
Time interval of the image:
-6.532000 11.876600

# RAcent  DECcent POSerr Theta    Phi  PeakCts   SNR AngSep     Name
#  [deg]    [deg]    ['] [deg]  [deg]                   [']
 83.5159  21.8904    6.3  19.7  -62.1   0.1445   1.8    9.9	Crab
109.7267 -38.2462    2.0  47.8  151.2   1.2217   5.7 ------	UNKNOWN
101.7909   3.9787    2.7   5.5  126.5   0.2664   4.2 ------	UNKNOWN
113.9821  46.8139    2.5  40.6   -0.6   0.4829   4.7 ------	UNKNOWN
 97.6173   9.5473    0.2   1.4  -54.1   3.3176  50.2 ------	UNKNOWN
 59.6153 -32.7422    2.8  55.3 -156.9   1.1073   4.1 ------	UNKNOWN
 58.9294  26.5201    2.2  41.6  -76.0   1.4141   5.2 ------	UNKNOWN
Post-slew image of 15-350 keV band
Time interval of the image:
35.676600 937.576590

# RAcent  DECcent POSerr Theta    Phi  PeakCts   SNR AngSep     Name
#  [deg]    [deg]    ['] [deg]  [deg]                   [']
 83.6307  22.0225    0.6  18.3  -56.9  33.1483  20.3    0.5	Crab
117.6768  42.5179    2.7  37.4   13.1   9.1175   4.3 ------	UNKNOWN
 97.1423 -26.6672    2.9  36.2  169.2   7.8742   3.9 ------	UNKNOWN
110.5160  45.3427    2.6  37.5    3.4   9.2055   4.4 ------	UNKNOWN
103.6978  32.2690    3.0  23.4    1.5   5.8098   3.9 ------	UNKNOWN
 97.5825   9.5710    0.4   0.1  -45.2  44.0944  31.7 ------	UNKNOWN
106.0851  49.8342    2.6  40.9   -3.2   9.0452   4.5 ------	UNKNOWN
 79.7488  64.6117    2.5  56.5  -20.6  19.9721   4.7 ------	UNKNOWN
Plot creation:
Mon Oct 24 05:00:16 EDT 2022