Estimated redshift from machine learning (Ukwatta et al. 2016) - may take a few minute to calcaulte
Image
Pre-slew 15.0-350.0 keV image (Event data)

#   RAcent    DECcent   POSerr    Theta     Phi              Peak Cts       SNR   Name
   55.3401   -47.5932   0.0164    41.2340    -4.6187         0.9117218     11.708 TRIG_01107050

Foreground time interval of the image:
 -8.360   7.576 (delta_t =  15.936 [sec])
Background time interval of the image:
-239.016  -8.360 (delta_t = 230.656 [sec])
Lightcurves
Notes:
- 1) The mask-weighted light curves are using the flight position.
- 2) Multiple plots of different time binning/intervals are shown to cover all scenarios of short/long GRBs, rate/image triggers, and real/false positives.
- 3) For all the mask-weighted lightcurves, the y-axis units are counts/sec/det where a det is 0.4 x 0.4 = 0.16 sq cm.
- 4) The verticle lines correspond to following: green dotted lines are T50 interval, black dotted lines are T90 interval, blue solid line(s) is a spacecraft slew start time, and orange solid line(s) is a spacecraft slew end time.
- 5) Time of each bin is in the middle of the bin.
1 s binning
From T0-310 s to T0+310 s
From T100_start - 20 s to T100_end + 30 s
Full time interval

64 ms binning
Full time interval

From T100_start to T100_end

From T0-5 sec to T0+5 sec

16 ms binning
From T100_start-5 s to T100_start+5 s
Blue+Cyan dotted lines: Time interval of the scaled map
From 0.000000 to 1.024000
8 ms binning
From T100_start-3 s to T100_start+3 s

Blue+Cyan dotted lines: Time interval of the scaled map
From 0.000000 to 1.024000
2 ms binning
From T100_start-1 s to T100_start+1 s
Blue+Cyan dotted lines: Time interval of the scaled map
From 0.000000 to 1.024000
SN=5 or 10 sec. binning (whichever binning is satisfied first)

SN=5 or 10 sec. binning (T < 200 sec)

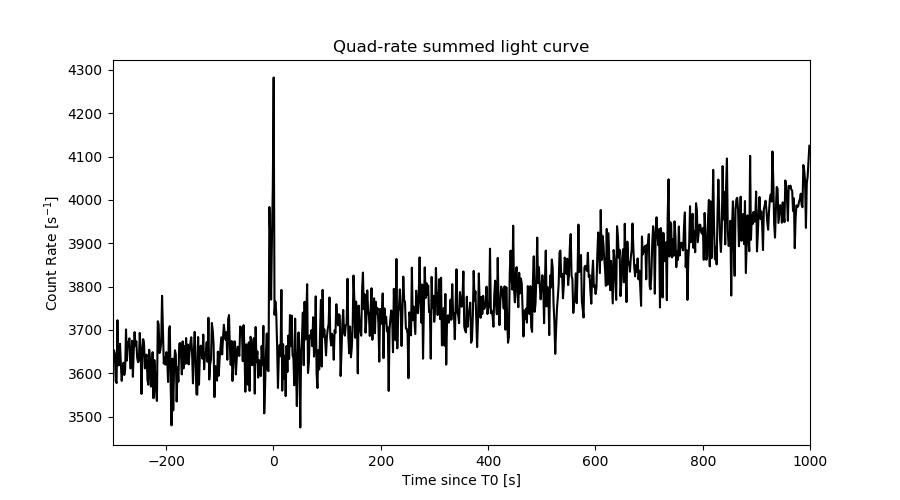
Quad-rate summed light curves (from T0-300s to T0+1000s)
Spectral Evolution

Spectra
Notes:
- 1) The fitting includes the systematic errors.
- 2) When the burst includes telescope slew time periods, the fitting uses an average response file made from multiple 5-s response files through out the slew time plus single time preiod for the non-slew times, and weighted by the total counts in the corresponding time period using addrmf. An average response file is needed becuase a spectral fit using the pre-slew DRM will introduce some errors in both a spectral shape and a normalization if the PHA file contains a lot of the slew/post-slew time interval.
- 3) For fits to more complicated models (e.g. a power-law over a cutoff power-law), the BAT team has decided to require a chi-square improvement of more than 6 for each extra dof.
Time averaged spectrum fit using the average DRM
Power-law model

Time interval is from   -8.360 sec. to    7.576 sec.

Spectral model in power-law:
------------------------------------------------------------
Parameters  : value       lower 90%   higher 90%
Photon index: 1.71667     ( -0.206253   0.212579 )
Norm@50keV  : 3.91826E-03    ( -0.000520011   0.000512912 )
------------------------------------------------------------
#Fit statistic  : Chi-Squared                   52.68     using 59 bins.
 Reduced chi-squared = 0.924211
# Null hypothesis probability of 6.38e-01 with 57 degrees of freedom

Photon flux (15-150 keV)    in 15.94 sec: 0.523479 ( -0.065223  0.065315 ) ph/cm2/s
Energy fluence (15-150 keV)             : 5.77642e-07 ( -7.91725e-08  8.00287e-08 ) ergs/cm2
Cutoff power-law model

Time interval is from   -8.360 sec. to    7.576 sec.
Spectral model in the cutoff power-law:
------------------------------------------------------------
Parameters  : value       lower 90%   higher 90%
Photon index: 1.09449     ( -1.02558   0.751972 )
Epeak [keV] : 68.2604      ( -25.1928 -68.2601 )
Norm@50keV  : 8.43094E-03    ( -0.00483912   0.0209935 )
------------------------------------------------------------
#Fit statistic  : Chi-Squared                   51.07     using 59 bins.
 Reduced chi-squared = 0.911964
# Null hypothesis probability of 6.62e-01 with 56 degrees of freedom

Photon flux (15-150 keV)    in 15.94 sec: 0.512401 ( -0.06721  0.067092 ) ph/cm2/s
Energy fluence (15-150 keV)             : 5.51999e-07 ( -8.63396e-08  8.72328e-08 ) ergs/cm2
Band function

Time interval is from   -8.360 sec. to    7.576 sec.


Spectral model in the Band function:
------------------------------------------------------------
Parameters  : value       lower 90%   higher 90%
alpha       :    (     )
beta        :     (     )
Epeak [keV] :       (   )
Norm@50keV   :     (     )
------------------------------------------------------------

Photon flux (15-150 keV)    in  sec:  (    ) ph/cm2/s
Energy fluence (15-150 keV)             : 0 ( 0  0 ) ergs/cm2
Single BB
Spectral model blackbody:
------------------------------------------------------------
Parameters  : value    Lower 90%  Upper 90%
kT [keV]    : 12.6484  (-1.75492  2.06859)
R^2/D10^2   : 0.106760  (-0.0457882   0.0783081)
(R is the radius in km and D10 is the distance to the source in units of 10 kpc)
------------------------------------------------------------
#Fit statistic  : Chi-Squared                   63.34     using 59 bins.
 Reduced chi-squared =
# Null hypothesis probability of 2.63e-01 with 57 degrees of freedom

Energy  Fluence     90% Error
[keV]   [erg/cm2]   [erg/cm2]
15- 25  5.774e-08   1.333e-08
25- 50  1.930e-07   3.582e-08
50-150  1.920e-07   5.032e-08
15-150  4.427e-07   7.508e-08
Thermal bremsstrahlung (OTTB)

Spectral model: thermal bremsstrahlung
------------------------------------------------------------
Parameters  : value         Lower 90%    Upper 90%
kT [keV]    : 127.781       (-48.2064      -124.677)
Norm        : 2.19917       (-0.319638     0.424884)
------------------------------------------------------------
#Fit statistic  : Chi-Squared                   51.22     using 59 bins.
 Reduced chi-squared =
# Null hypothesis probability of 6.91e-01 with 57 degrees of freedom

Energy  Fluence     90% Error
[keV]   [erg/cm2]   [erg/cm2]
15- 25  9.104e-08   1.665e-08
25- 50  1.646e-07   5.012e-08
50-150  3.028e-07   1.695e-07
15-150  5.584e-07   2.178e-07
Double BB
Spectral model: bbodyrad<1> + bbodyrad<2>
------------------------------------------------------------
Parameters  : value         Lower 90%    Upper 90%
kT1 [keV]   : 7.01396        (-3.25104      3.40343)
R1^2/D10^2  : 0.584394        (-0.398353      4.84576)
kT2 [keV]   : 22.5752        (-7.82139      43.547)
R2^2/D10^2  : 8.99461E-03    (-0.00850116   0.0160421)
------------------------------------------------------------
#Fit statistic  : Chi-Squared                   51.50     using 59 bins.
 Reduced chi-squared =
# Null hypothesis probability of 6.09e-01 with 55 degrees of freedom

Energy  Fluence     90% Error
[keV]   [erg/cm2]   [erg/cm2]
15- 25  8.713e-08   4.893e-08
25- 50  1.731e-07   9.221e-08
50-150  2.901e-07   1.663e-07
15-150  5.504e-07   2.911e-07
Peak spectrum fit
Power-law model

Time interval is from    0.068 sec. to    1.068 sec.

Spectral model in power-law:
------------------------------------------------------------
Parameters  : value       lower 90%   higher 90%
Photon index: 1.49411     ( -0.232917   0.23645 )
Norm@50keV  : 1.45653E-02    ( -0.00218456   0.00217854 )
------------------------------------------------------------
#Fit statistic  : Chi-Squared                   58.31     using 59 bins.
 Reduced chi-squared = 1.02298
# Null hypothesis probability of 4.27e-01 with 57 degrees of freedom

Photon flux (15-150 keV)    in 1 sec: 1.81550 ( -0.27859  0.27928 ) ph/cm2/s
Energy fluence (15-150 keV)             : 1.38325e-07 ( -2.20383e-08  2.21362e-08 ) ergs/cm2
Cutoff power-law model

Time interval is from    0.068 sec. to    1.068 sec.
Spectral model in the cutoff power-law:
------------------------------------------------------------
Parameters  : value       lower 90%   higher 90%
Photon index: 0.731436     ( -1.13591   0.860646 )
Epeak [keV] : 87.8441      ( -26.3492 -87.8441 )
Norm@50keV  : 3.44837E-02    ( -0.0210054   0.0847594 )
------------------------------------------------------------
#Fit statistic  : Chi-Squared                   56.36     using 59 bins.
 Reduced chi-squared = 1.00643
# Null hypothesis probability of 4.61e-01 with 56 degrees of freedom

Photon flux (15-150 keV)    in 1 sec: 1.78256 ( -0.28218  0.28262 ) ph/cm2/s
Energy fluence (15-150 keV)             : 7.85869e-08 ( -3.02666e-08  2.16482e-08 ) ergs/cm2
Band function

Time interval is from    0.068 sec. to    1.068 sec.


Spectral model in the Band function:
------------------------------------------------------------
Parameters  : value       lower 90%   higher 90%
alpha       :    (     )
beta        :     (     )
Epeak [keV] :       (   )
Norm@50keV   :     (     )
------------------------------------------------------------

Photon flux (15-150 keV)    in  sec:  (    ) ph/cm2/s
Energy fluence (15-150 keV)             : 0 ( 0  0 ) ergs/cm2
Single BB

Spectral model blackbody:
------------------------------------------------------------
Parameters  : value    Lower 90%  Upper 90%
kT [keV]    : 16.0803  (-2.74487  3.2693)
R^2/D10^2   : 0.170131  (-0.0817373   0.15761)
(R is the radius in km and D10 is the distance to the source in units of 10 kpc)
------------------------------------------------------------
#Fit statistic  : Chi-Squared                   64.54     using 59 bins.
 Reduced chi-squared =
# Null hypothesis probability of 2.30e-01 with 57 degrees of freedom

Energy  Fluence     90% Error
[keV]   [erg/cm2]   [erg/cm2]
15- 25  9.086e-09   2.658e-09
25- 50  3.840e-08   8.080e-09
50-150  6.953e-08   1.871e-08
15-150  1.170e-07   2.679e-08
Thermal bremsstrahlung (OTTB)

Spectral model: thermal bremsstrahlung
------------------------------------------------------------
Parameters  : value         Lower 90%    Upper 90%
kT [keV]    : 199.361       (-81.6224      -199.363)
Norm        : 7.54834       (-1.11369     1.11543)
------------------------------------------------------------
#Fit statistic  : Chi-Squared                   57.31     using 59 bins.
 Reduced chi-squared =
# Null hypothesis probability of 4.63e-01 with 57 degrees of freedom

Energy  Fluence     90% Error
[keV]   [erg/cm2]   [erg/cm2]
15- 25  1.880e-08   1.072e-08
25- 50  3.616e-08   2.040e-08
50-150  7.930e-08   4.419e-08
15-150  1.343e-07   7.655e-08
Double BB
Spectral model: bbodyrad<1> + bbodyrad<2>
------------------------------------------------------------
Parameters  : value         Lower 90%    Upper 90%
kT1 [keV]   : 7.16333        (-3.01077      4.87899)
R1^2/D10^2  : 1.53566        (-1.19795      9.28251)
kT2 [keV]   : 23.9480        (-6.46001      32.7691)
R2^2/D10^2  : 3.27666E-02    (-0.0312022   0.0798103)
------------------------------------------------------------
#Fit statistic  : Chi-Squared                   55.85     using 59 bins.
 Reduced chi-squared =
# Null hypothesis probability of 4.43e-01 with 55 degrees of freedom

Energy  Fluence     90% Error
[keV]   [erg/cm2]   [erg/cm2]
15- 25  1.630e-08   9.470e-09
25- 50  3.707e-08   1.960e-08
50-150  8.247e-08   4.702e-08
15-150  1.358e-07   7.150e-08
Pre-slew spectrum (Pre-slew PHA with pre-slew DRM)
Power-law model
Spectral model in power-law:
------------------------------------------------------------
Parameters  : value       lower 90%   higher 90%
Photon index: 1.71667     ( -0.206253   0.212579 )
Norm@50keV  : 3.91826E-03    ( -0.000520011   0.000512912 )
------------------------------------------------------------
#Fit statistic  : Chi-Squared                   52.68     using 59 bins.
 Reduced chi-squared =
# Null hypothesis probability of 6.38e-01 with 57 degrees of freedom

Photon flux (15-150 keV)    in 15.94 sec: 0.523456 ( -0.0652183  0.0653096 ) ph/cm2/s
Energy fluence (15-150 keV)             : 5.77554e-07 ( -7.91504e-08  8.00512e-08 ) ergs/cm2
Cutoff power-law model

Spectral model in the cutoff power-law:
------------------------------------------------------------
Parameters  : value       lower 90%   higher 90%
Photon index: 1.09448     ( -1.02557   0.751974 )
Epeak [keV] : 68.2600      ( -25.1833 -68.26 )
Norm@50keV  : 8.43106E-03    ( -0.00483914   0.0209934 )
------------------------------------------------------------
#Fit statistic  : Chi-Squared                   51.07     using 59 bins.
 Reduced chi-squared =
# Null hypothesis probability of 6.62e-01 with 56 degrees of freedom

Photon flux (15-150 keV)    in 15.94 sec: 0.512321 ( -0.067185  0.067074 ) ph/cm2/s
Energy fluence (15-150 keV)             : 5.52182e-07 ( -8.63852e-08  8.73034e-08 ) ergs/cm2
Band function
Spectral model in the Band function:
------------------------------------------------------------
Parameters  : value       lower 90%   higher 90%
alpha       :    (     )
beta        :     (     )
Epeak [keV] :       (   )
Norm@50keV   :     (     )
------------------------------------------------------------

Photon flux (15-150 keV)    in  sec:  (    ) ph/cm2/s
Energy fluence (15-150 keV)             : 0 ( 0  0 ) ergs/cm2
S(25-50 keV) vs. S(50-100 keV) plot
S(25-50 keV)  = 1.57e-07
S(50-100 keV) = 1.91e-07
T90 vs. Hardness ratio plot

T90                                   = 12.2879998683929 sec.
Hardness ratio (energy fluence ratio) = 1.21656
Color vs. Color plot

Count Ratio  (25-50 keV) / (15-25 keV) = 1.41965
Count Ratio (50-100 keV) / (15-25 keV) = 0.913693
Mask shadow pattern
IMX = 8.736353591956291E-01, IMY = 7.057797028375146E-02
TIME vs. PHA plot around the trigger time

Blue+Cyan dotted lines: Time interval of the scaled map
From 0.000000 to 1.024000
TIME vs. DetID plot around the trigger time

Blue+Cyan dotted lines: Time interval of the scaled map
From 0.000000 to 1.024000
100 us light curve (15-350 keV)

Blue+Cyan dotted lines: Time interval of the scaled map
From 0.000000 to 1.024000
Spacecraft aspect plot
Bright source in the pre-burst/pre-slew/post-slew images
Pre-burst image of 15-350 keV band
Time interval of the image:
-239.016000 -8.360000

# RAcent  DECcent POSerr Theta    Phi  PeakCts   SNR AngSep     Name
#  [deg]    [deg]    ['] [deg]  [deg]                   [']
Pre-slew background subtracted image of 15-350 keV band
Time interval of the image:
-8.360000 7.576000

# RAcent  DECcent POSerr Theta    Phi  PeakCts   SNR AngSep     Name
#  [deg]    [deg]    ['] [deg]  [deg]                   [']
327.2203  -1.4556    2.1  50.3  145.3   1.3797   5.5 ------	UNKNOWN
 55.3402 -47.5932    1.0  41.2   -4.6   0.9115  11.7 ------	UNKNOWN
 11.6788  23.9619    2.4  46.4 -145.9   0.4924   4.8 ------	UNKNOWN
Post-slew image of 15-350 keV band
Time interval of the image:
109.084590 963.108800

# RAcent  DECcent POSerr Theta    Phi  PeakCts   SNR AngSep     Name
#  [deg]    [deg]    ['] [deg]  [deg]                   [']
 14.7304 -10.0755    2.9  50.7 -145.5  12.9729   4.1 ------	UNKNOWN
Plot creation:
Mon Oct 24 04:58:45 EDT 2022