Estimated redshift from machine learning (Ukwatta et al. 2016) - may take a few minute to calcaulte
Image
Pre-slew 15.0-350.0 keV image (Event data)
#   RAcent    DECcent   POSerr    Theta     Phi              Peak Cts       SNR   Name
  275.2179    10.3722   0.0132    29.5142   -78.4563         1.0659374     14.698 TRIG_01107466

Foreground time interval of the image:
 -0.228   9.477 (delta_t =   9.705 [sec])
Background time interval of the image:
-239.624  -0.228 (delta_t = 239.396 [sec])
Lightcurves
Notes:
- 1) The mask-weighted light curves are using the flight position.
- 2) Multiple plots of different time binning/intervals are shown to cover all scenarios of short/long GRBs, rate/image triggers, and real/false positives.
- 3) For all the mask-weighted lightcurves, the y-axis units are counts/sec/det where a det is 0.4 x 0.4 = 0.16 sq cm.
- 4) The verticle lines correspond to following: green dotted lines are T50 interval, black dotted lines are T90 interval, blue solid line(s) is a spacecraft slew start time, and orange solid line(s) is a spacecraft slew end time.
- 5) Time of each bin is in the middle of the bin.
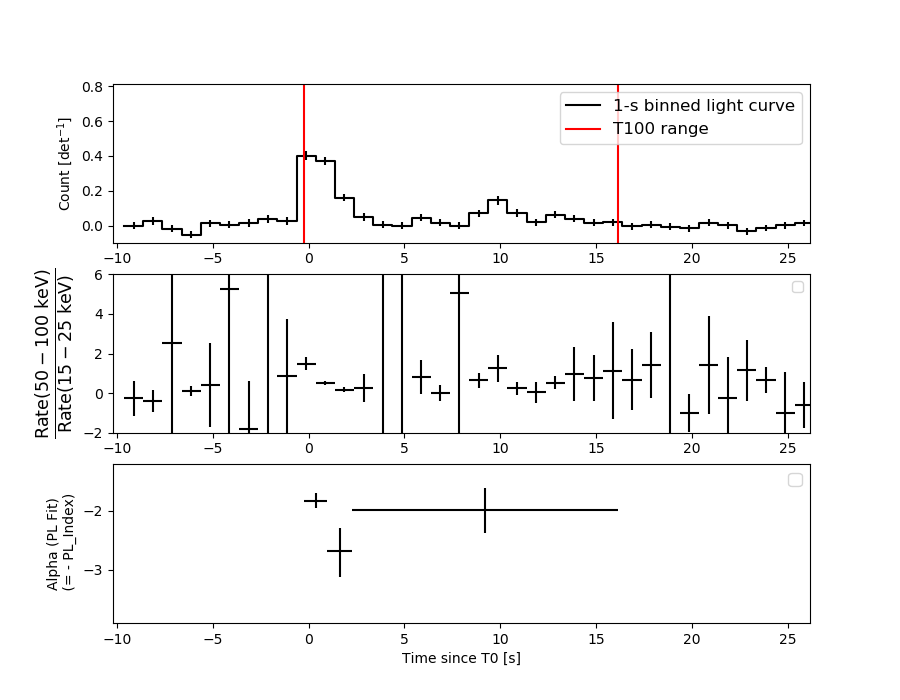
1 s binning
From T0-310 s to T0+310 s
From T100_start - 20 s to T100_end + 30 s

Full time interval

64 ms binning
Full time interval
From T100_start to T100_end
From T0-5 sec to T0+5 sec

16 ms binning
From T100_start-5 s to T100_start+5 s
Blue+Cyan dotted lines: Time interval of the scaled map
From 0.000000 to 0.256000
8 ms binning
From T100_start-3 s to T100_start+3 s
Blue+Cyan dotted lines: Time interval of the scaled map
From 0.000000 to 0.256000
2 ms binning
From T100_start-1 s to T100_start+1 s
Blue+Cyan dotted lines: Time interval of the scaled map
From 0.000000 to 0.256000
SN=5 or 10 sec. binning (whichever binning is satisfied first)
SN=5 or 10 sec. binning (T < 200 sec)
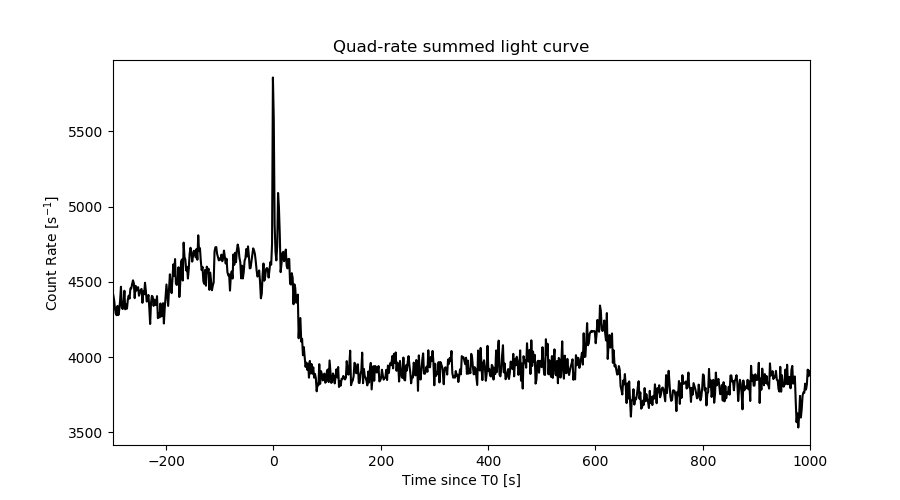
Quad-rate summed light curves (from T0-300s to T0+1000s)
Spectral Evolution
Spectra
Notes:
- 1) The fitting includes the systematic errors.
- 2) When the burst includes telescope slew time periods, the fitting uses an average response file made from multiple 5-s response files through out the slew time plus single time preiod for the non-slew times, and weighted by the total counts in the corresponding time period using addrmf. An average response file is needed becuase a spectral fit using the pre-slew DRM will introduce some errors in both a spectral shape and a normalization if the PHA file contains a lot of the slew/post-slew time interval.
- 3) For fits to more complicated models (e.g. a power-law over a cutoff power-law), the BAT team has decided to require a chi-square improvement of more than 6 for each extra dof.
Time averaged spectrum fit using the average DRM
Power-law model

Time interval is from   -0.228 sec. to   16.168 sec.

Spectral model in power-law:
------------------------------------------------------------
Parameters  : value       lower 90%   higher 90%
Photon index: 1.96545     ( -0.174056   0.180002 )
Norm@50keV  : 5.32893E-03    ( -0.000562694   0.000554038 )
------------------------------------------------------------
#Fit statistic  : Chi-Squared                   54.25     using 59 bins.
 Reduced chi-squared = 0.951754
# Null hypothesis probability of 5.79e-01 with 57 degrees of freedom

Photon flux (15-150 keV)    in 16.4 sec: 0.786958 ( -0.076502  0.076849 ) ph/cm2/s
Energy fluence (15-150 keV)             : 8.0483e-07 ( -8.13545e-08  8.22726e-08 ) ergs/cm2
Cutoff power-law model

Time interval is from   -0.228 sec. to   16.168 sec.
Spectral model in the cutoff power-law:
------------------------------------------------------------
Parameters  : value       lower 90%   higher 90%
Photon index: 1.30387     ( -0.88403   0.737171 )
Epeak [keV] : 48.8438      ( -40.6411 -48.8439 )
Norm@50keV  : 1.19117E-02    ( -0.00694649   0.0223406 )
------------------------------------------------------------
#Fit statistic  : Chi-Squared                   51.96     using 59 bins.
 Reduced chi-squared = 0.927857
# Null hypothesis probability of 6.28e-01 with 56 degrees of freedom

Photon flux (15-150 keV)    in 16.4 sec: 0.756333 ( -0.083871  0.083924 ) ph/cm2/s
Energy fluence (15-150 keV)             : 7.61893e-07 ( -9.17403e-08  9.44422e-08 ) ergs/cm2
Band function

Time interval is from   -0.228 sec. to   16.168 sec.


Spectral model in the Band function:
------------------------------------------------------------
Parameters  : value       lower 90%   higher 90%
alpha       :    (     )
beta        :     (     )
Epeak [keV] :       (   )
Norm@50keV   :     (     )
------------------------------------------------------------

Photon flux (15-150 keV)    in  sec:  (    ) ph/cm2/s
Energy fluence (15-150 keV)             : 0 ( 0  0 ) ergs/cm2
Single BB
Spectral model blackbody:
------------------------------------------------------------
Parameters  : value    Lower 90%  Upper 90%
kT [keV]    : 12.0182  (-1.23651  1.36823)
R^2/D10^2   : 0.177330  (-0.0601054   0.0916865)
(R is the radius in km and D10 is the distance to the source in units of 10 kpc)
------------------------------------------------------------
#Fit statistic  : Chi-Squared                   70.87     using 59 bins.
 Reduced chi-squared =
# Null hypothesis probability of 1.02e-01 with 57 degrees of freedom

Energy  Fluence     90% Error
[keV]   [erg/cm2]   [erg/cm2]
15- 25  8.885e-08   1.544e-08
25- 50  2.801e-07   3.575e-08
50-150  2.435e-07   4.830e-08
15-150  6.125e-07   6.855e-08
Thermal bremsstrahlung (OTTB)

Spectral model: thermal bremsstrahlung
------------------------------------------------------------
Parameters  : value         Lower 90%    Upper 90%
kT [keV]    : 76.9876       (-19.3284      31.4552)
Norm        : 3.68598       (-0.53441     0.64565)
------------------------------------------------------------
#Fit statistic  : Chi-Squared                   52.02     using 59 bins.
 Reduced chi-squared =
# Null hypothesis probability of 6.62e-01 with 57 degrees of freedom

Energy  Fluence     90% Error
[keV]   [erg/cm2]   [erg/cm2]
15- 25  1.564e-07   2.048e-08
25- 50  2.551e-07   2.681e-08
50-150  3.508e-07   1.227e-07
15-150  7.624e-07   9.815e-08
Double BB

Spectral model: bbodyrad<1> + bbodyrad<2>
------------------------------------------------------------
Parameters  : value         Lower 90%    Upper 90%
kT1 [keV]   : 3.95808        (-1.32559      1.75829)
R1^2/D10^2  : 8.27335        (-6.62573      67.8109)
kT2 [keV]   : 15.1839        (-2.20143      3.28483)
R2^2/D10^2  : 6.33089E-02    (-0.0359922   0.0716577)
------------------------------------------------------------
#Fit statistic  : Chi-Squared                   49.99     using 59 bins.
 Reduced chi-squared =
# Null hypothesis probability of 6.66e-01 with 55 degrees of freedom

Energy  Fluence     90% Error
[keV]   [erg/cm2]   [erg/cm2]
15- 25  1.672e-07   7.493e-08
25- 50  2.420e-07   8.169e-08
50-150  3.175e-07   8.807e-08
15-150  7.267e-07   1.964e-07
Peak spectrum fit
Power-law model

Time interval is from   -0.180 sec. to    0.820 sec.

Spectral model in power-law:
------------------------------------------------------------
Parameters  : value       lower 90%   higher 90%
Photon index: 1.89505     ( -0.137692   0.141641 )
Norm@50keV  : 3.28924E-02    ( -0.00291629   0.00288603 )
------------------------------------------------------------
#Fit statistic  : Chi-Squared                   74.83     using 59 bins.
 Reduced chi-squared = 1.31281
# Null hypothesis probability of 5.67e-02 with 57 degrees of freedom

Photon flux (15-150 keV)    in 1 sec: 4.71081 ( -0.39586  0.39672 ) ph/cm2/s
Energy fluence (15-150 keV)             : 3.02441e-07 ( -2.64404e-08  2.66151e-08 ) ergs/cm2
Cutoff power-law model
Time interval is from   -0.180 sec. to    0.820 sec.
Spectral model in the cutoff power-law:
------------------------------------------------------------
Parameters  : value       lower 90%   higher 90%
Photon index: 1.19268     ( -0.687781   0.595581 )
Epeak [keV] : 54.2669      ( -11.3086 42.3401 )
Norm@50keV  : 7.75055E-02    ( -0.0394213   0.0994487 )
------------------------------------------------------------
#Fit statistic  : Chi-Squared                   70.71     using 59 bins.
 Reduced chi-squared = 1.26268
# Null hypothesis probability of 8.92e-02 with 56 degrees of freedom

Photon flux (15-150 keV)    in 1 sec: 4.58062 ( -0.41157  0.41189 ) ph/cm2/s
Energy fluence (15-150 keV)             : 2.89728e-07 ( -2.86081e-08  2.87724e-08 ) ergs/cm2
Band function

Time interval is from   -0.180 sec. to    0.820 sec.


Spectral model in the Band function:
------------------------------------------------------------
Parameters  : value       lower 90%   higher 90%
alpha       :    (     )
beta        :     (     )
Epeak [keV] :       (   )
Norm@50keV   :     (     )
------------------------------------------------------------

Photon flux (15-150 keV)    in  sec:  (    ) ph/cm2/s
Energy fluence (15-150 keV)             : 0 ( 0  0 ) ergs/cm2
Single BB

Spectral model blackbody:
------------------------------------------------------------
Parameters  : value    Lower 90%  Upper 90%
kT [keV]    : 12.2228  (-1.1156  1.20602)
R^2/D10^2   : 1.05059  (-0.31574   0.456489)
(R is the radius in km and D10 is the distance to the source in units of 10 kpc)
------------------------------------------------------------
#Fit statistic  : Chi-Squared                   98.70     using 59 bins.
 Reduced chi-squared =
# Null hypothesis probability of 5.10e-04 with 57 degrees of freedom

Energy  Fluence     90% Error
[keV]   [erg/cm2]   [erg/cm2]
15- 25  3.324e-08   4.950e-09
25- 50  1.069e-07   9.325e-09
50-150  9.718e-08   1.759e-08
15-150  2.373e-07   2.385e-08
Thermal bremsstrahlung (OTTB)

Spectral model: thermal bremsstrahlung
------------------------------------------------------------
Parameters  : value         Lower 90%    Upper 90%
kT [keV]    : 87.0412       (-19.4618      29.4708)
Norm        : 21.5905       (-2.54955     2.9301)
------------------------------------------------------------
#Fit statistic  : Chi-Squared                   70.76     using 59 bins.
 Reduced chi-squared =
# Null hypothesis probability of 1.04e-01 with 57 degrees of freedom

Energy  Fluence     90% Error
[keV]   [erg/cm2]   [erg/cm2]
15- 25  5.627e-08   7.085e-09
25- 50  9.447e-08   7.405e-09
50-150  1.409e-07   5.010e-08
15-150  2.916e-07   5.125e-08
Double BB

Spectral model: bbodyrad<1> + bbodyrad<2>
------------------------------------------------------------
Parameters  : value         Lower 90%    Upper 90%
kT1 [keV]   : 5.41602        (-1.4334      2.02914)
R1^2/D10^2  : 12.9591        (-8.58117      22.1583)
kT2 [keV]   : 17.5077        (-2.87725      5.86079)
R2^2/D10^2  : 0.210568    (-0.151434   0.246813)
------------------------------------------------------------
#Fit statistic  : Chi-Squared                   71.34     using 59 bins.
 Reduced chi-squared =
# Null hypothesis probability of 6.84e-02 with 55 degrees of freedom

Energy  Fluence     90% Error
[keV]   [erg/cm2]   [erg/cm2]
15- 25  5.597e-08   2.758e-08
25- 50  9.300e-08   3.058e-08
50-150  1.323e-07   5.715e-08
15-150  2.813e-07   9.858e-08
Pre-slew spectrum (Pre-slew PHA with pre-slew DRM)
Power-law model
Spectral model in power-law:
------------------------------------------------------------
Parameters  : value       lower 90%   higher 90%
Photon index: 1.97370     ( -0.183744   0.190356 )
Norm@50keV  : 6.64281E-03    ( -0.000744088   0.000731603 )
------------------------------------------------------------
#Fit statistic  : Chi-Squared                   64.83     using 59 bins.
 Reduced chi-squared =
# Null hypothesis probability of 2.22e-01 with 57 degrees of freedom

Photon flux (15-150 keV)    in 9.705 sec: 0.984564 ( -0.101175  0.10163 ) ph/cm2/s
Energy fluence (15-150 keV)             : 5.93787e-07 ( -6.3542e-08  6.41899e-08 ) ergs/cm2
Cutoff power-law model
Spectral model in the cutoff power-law:
------------------------------------------------------------
Parameters  : value       lower 90%   higher 90%
Photon index: 1.33185     ( -1.04521   0.639662 )
Epeak [keV] : 47.4872      ( -37.0011 -47.4892 )
Norm@50keV  : 1.46585E-02    ( -0.00918683   0.0376488 )
------------------------------------------------------------
#Fit statistic  : Chi-Squared                   63.27     using 59 bins.
 Reduced chi-squared =
# Null hypothesis probability of 2.35e-01 with 56 degrees of freedom

Photon flux (15-150 keV)    in 9.705 sec: 0.948791 ( -0.112807  0.112279 ) ph/cm2/s
Energy fluence (15-150 keV)             : 5.61964e-07 ( -7.43413e-08  7.68908e-08 ) ergs/cm2
Band function
Spectral model in the Band function:
------------------------------------------------------------
Parameters  : value       lower 90%   higher 90%
alpha       :    (     )
beta        :     (     )
Epeak [keV] :       (   )
Norm@50keV   :     (     )
------------------------------------------------------------

Photon flux (15-150 keV)    in  sec:  (    ) ph/cm2/s
Energy fluence (15-150 keV)             : 0 ( 0  0 ) ergs/cm2
S(25-50 keV) vs. S(50-100 keV) plot
S(25-50 keV)  = 2.39e-07
S(50-100 keV) = 2.46e-07
T90 vs. Hardness ratio plot
T90                                   = 13.5479999780655 sec.
Hardness ratio (energy fluence ratio) = 1.02929
Color vs. Color plot

Count Ratio  (25-50 keV) / (15-25 keV) = 1.03204
Count Ratio (50-100 keV) / (15-25 keV) = 0.593097
Mask shadow pattern
IMX = 1.132856191526152E-01, IMY = 5.546484929646723E-01
TIME vs. PHA plot around the trigger time
Blue+Cyan dotted lines: Time interval of the scaled map
From 0.000000 to 0.256000
TIME vs. DetID plot around the trigger time

Blue+Cyan dotted lines: Time interval of the scaled map
From 0.000000 to 0.256000
100 us light curve (15-350 keV)

Blue+Cyan dotted lines: Time interval of the scaled map
From 0.000000 to 0.256000
Spacecraft aspect plot
Bright source in the pre-burst/pre-slew/post-slew images
Pre-burst image of 15-350 keV band
Time interval of the image:
-239.624000 -0.228000

# RAcent  DECcent POSerr Theta    Phi  PeakCts   SNR AngSep     Name
#  [deg]    [deg]    ['] [deg]  [deg]                   [']
244.9744 -15.6457    0.2  10.2  107.6  28.9560  52.1    0.4	Sco X-1
254.4646  35.3893    8.6  45.1 -125.0   2.7319   1.3    2.8	Her X-1
255.9480 -37.9930    3.9  28.3   49.8   2.1916   3.0    9.1	4U 1700-377
256.3481 -36.4601    4.3  26.9   48.8   1.9664   2.7    4.8	GX 349+2
262.8136 -24.8041    9.8  17.5   24.6  -0.6618  -1.2   11.2	GX 1+4
264.7781 -44.3142    9.1  35.9   40.1   1.2647   1.3    8.3	4U 1735-44
268.2648  -1.3465   16.9  16.9  -64.9   0.4252   0.7    8.9	SW J1753.5-0127
270.1980 -25.0416    6.6  22.1   10.0   0.9860   1.8    5.2	GX 5-1
270.4246 -25.7633   11.9  22.7   11.1   0.5385   1.0    6.7	GRS 1758-258
273.9841 -14.0201   59.4  20.5  -22.0   0.1036   0.2    1.6	GX 17+2
276.0045 -30.3769    4.1  29.4   11.7   1.6741   2.8    4.2	H1820-303
285.0060 -24.8890    3.5  33.6   -5.2  -2.2056  -3.3    2.5	HT1900.1-2455
288.9160  10.9045    6.0  40.8  -65.6  -3.1497  -1.9    7.4	GRS 1915+105
263.0314 -33.6932   14.5  25.5   35.2  -0.5485  -0.8    8.7	GX 354-0
294.4702 -32.2495    3.0  44.0    0.9   3.7571   3.9 ------	UNKNOWN
234.4029  29.5242    2.9  43.4 -150.6   3.6010   3.9 ------	UNKNOWN
252.4846  26.9976    3.3  36.7 -127.6   3.1427   3.5 ------	UNKNOWN
Pre-slew background subtracted image of 15-350 keV band
Time interval of the image:
-0.228000 9.476590

# RAcent  DECcent POSerr Theta    Phi  PeakCts   SNR AngSep     Name
#  [deg]    [deg]    ['] [deg]  [deg]                   [']
244.9732 -15.7004    1.3  10.2  107.3   0.4118   8.6    3.6	Sco X-1
254.4900  35.2363    3.8  45.0 -125.0  -0.5328  -3.0    6.6	Her X-1
255.7453 -37.8583   14.6  28.2   50.1   0.0502   0.8   11.5	4U 1700-377
256.4898 -36.5957    5.3  27.0   48.6   0.1308   2.2   10.7	GX 349+2
262.8442 -24.7062   10.2  17.4   24.4  -0.0552  -1.1    9.3	GX 1+4
264.7524 -44.6004   31.3  36.2   40.3  -0.0316  -0.4    9.0	4U 1735-44
268.3957  -1.2893    3.8  17.1  -64.9  -0.1539  -3.1    9.9	SW J1753.5-0127
270.3408 -24.9479    8.7  22.1    9.6  -0.0617  -1.3    8.5	GX 5-1
270.4026 -25.8816   10.3  22.7   11.3  -0.0533  -1.1    9.9	GRS 1758-258
274.0938 -14.0189   17.6  20.6  -22.1  -0.0304  -0.7    5.2	GX 17+2
275.7080 -30.4147  107.0  29.3   12.1  -0.0058  -0.1   11.6	H1820-303
284.9492 -24.7382    0.0  33.5   -5.4  -0.0628  -1.1   11.9	HT1900.1-2455
288.7148  10.8864   14.6  40.6  -65.7  -0.1040  -0.8    6.1	GRS 1915+105
262.8567 -33.9032    5.1  25.7   35.7   0.1269   2.3    7.8	GX 354-0
232.2564  16.3546    2.9  33.5 -165.1   0.2066   3.9 ------	UNKNOWN
275.2179  10.3722    0.8  29.5  -78.5   1.0660  14.7 ------	UNKNOWN
Post-slew image of 15-350 keV band
Time interval of the image:
79.476590 547.476610

# RAcent  DECcent POSerr Theta    Phi  PeakCts   SNR AngSep     Name
#  [deg]    [deg]    ['] [deg]  [deg]                   [']
244.9765 -15.6565    0.9  39.6   90.2  51.2642  12.4    1.0	Sco X-1
254.4635  35.3721  116.0  31.3 -172.9   0.0831   0.1    1.8	Her X-1
263.2441 -24.7590    0.0  37.0   59.0  -1.9265  -0.8   12.8	GX 1+4
268.3523  -1.6592    0.0  13.8   70.7   1.3048   1.6   12.4	SW J1753.5-0127
270.4146 -25.1621    3.6  35.8   48.2   5.8689   3.2    8.7	GX 5-1
270.4359 -25.8158    3.7  36.5   48.0   5.7978   3.1    8.4	GRS 1758-258
274.0218 -14.0012    4.0  24.4   43.5   2.7924   2.9    2.3	GX 17+2
275.6713 -30.3481    0.0  40.7   40.2  -3.0405  -2.0   13.2	H1820-303
285.0963 -24.9482   27.4  36.6   25.6   0.5665   0.4    3.7	HT1900.1-2455
288.8211  10.7739   17.2  13.4  -52.2   0.5144   0.7   10.4	GRS 1915+105
299.6018  35.2058    0.6  33.3 -101.3  21.2486  17.9    0.6	Cyg X-1
233.3136  19.0801    3.0  41.3  148.0   7.8900   3.9 ------	UNKNOWN
227.8425  29.7952    3.1  48.1  161.8  10.6246   3.7 ------	UNKNOWN
222.3634  43.7568    2.9  56.4  177.1  12.4022   3.9 ------	UNKNOWN
269.9630  16.2616    3.3   7.8 -179.4   2.2408   3.5 ------	UNKNOWN
293.0742  -9.4470    2.4  26.6   -1.7   3.8528   4.8 ------	UNKNOWN
249.1982  48.8502    3.1  44.2 -163.6   4.5934   3.8 ------	UNKNOWN
265.2773  60.5118    2.8  50.7 -145.5   7.9310   4.1 ------	UNKNOWN
Plot creation:
Mon Oct 24 04:58:07 EDT 2022