Estimated redshift from machine learning (Ukwatta et al. 2016) - may take a few minute to calcaulte
Image
Pre-slew 15.0-350.0 keV image (Event data)
#   RAcent    DECcent   POSerr    Theta     Phi              Peak Cts       SNR   Name
   66.5049   -37.2650   0.0185    31.1492     6.5208         1.2927871     10.459 TRIG_01110090

Foreground time interval of the image:
  0.520  50.021 (delta_t =  49.501 [sec])
Background time interval of the image:
-239.480   0.520 (delta_t = 240.000 [sec])
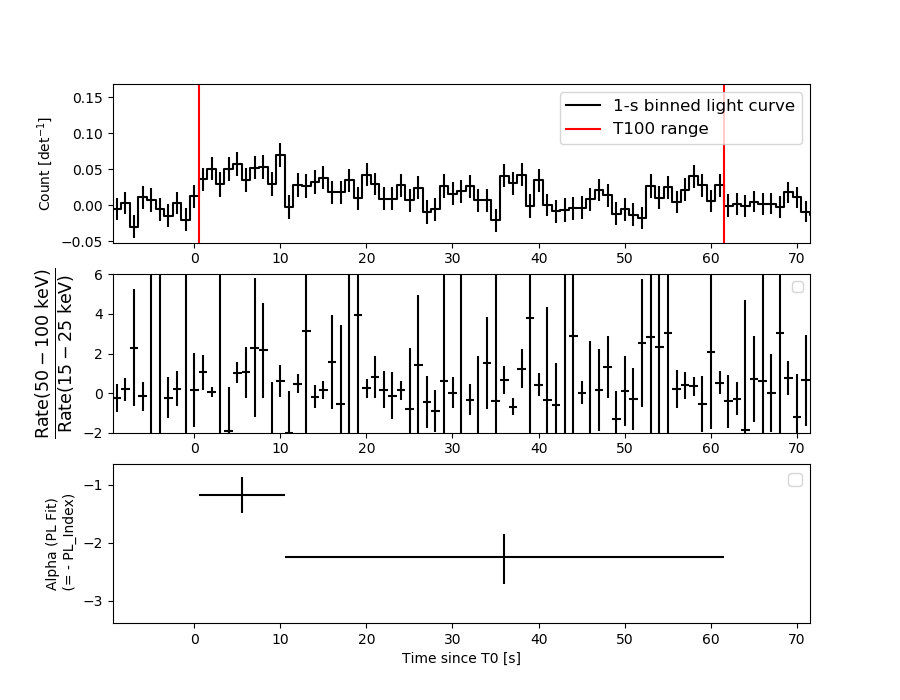
Lightcurves
Notes:
- 1) The mask-weighted light curves are using the flight position.
- 2) Multiple plots of different time binning/intervals are shown to cover all scenarios of short/long GRBs, rate/image triggers, and real/false positives.
- 3) For all the mask-weighted lightcurves, the y-axis units are counts/sec/det where a det is 0.4 x 0.4 = 0.16 sq cm.
- 4) The verticle lines correspond to following: green dotted lines are T50 interval, black dotted lines are T90 interval, blue solid line(s) is a spacecraft slew start time, and orange solid line(s) is a spacecraft slew end time.
- 5) Time of each bin is in the middle of the bin.
1 s binning
From T0-310 s to T0+310 s
From T100_start - 20 s to T100_end + 30 s

Full time interval
64 ms binning
Full time interval
From T100_start to T100_end

From T0-5 sec to T0+5 sec

16 ms binning
From T100_start-5 s to T100_start+5 s
Blue+Cyan dotted lines: Time interval of the scaled map
From 0.000000 to 8.192000
8 ms binning
From T100_start-3 s to T100_start+3 s
Blue+Cyan dotted lines: Time interval of the scaled map
From 0.000000 to 8.192000
2 ms binning
From T100_start-1 s to T100_start+1 s
Blue+Cyan dotted lines: Time interval of the scaled map
From 0.000000 to 8.192000
SN=5 or 10 sec. binning (whichever binning is satisfied first)

SN=5 or 10 sec. binning (T < 200 sec)

Quad-rate summed light curves (from T0-300s to T0+1000s)

Spectral Evolution
Spectra
Notes:
- 1) The fitting includes the systematic errors.
- 2) When the burst includes telescope slew time periods, the fitting uses an average response file made from multiple 5-s response files through out the slew time plus single time preiod for the non-slew times, and weighted by the total counts in the corresponding time period using addrmf. An average response file is needed becuase a spectral fit using the pre-slew DRM will introduce some errors in both a spectral shape and a normalization if the PHA file contains a lot of the slew/post-slew time interval.
- 3) For fits to more complicated models (e.g. a power-law over a cutoff power-law), the BAT team has decided to require a chi-square improvement of more than 6 for each extra dof.
Time averaged spectrum fit using the average DRM
Power-law model

Time interval is from    0.520 sec. to   61.520 sec.

Spectral model in power-law:
------------------------------------------------------------
Parameters  : value       lower 90%   higher 90%
Photon index: 1.87251     ( -0.277447   0.296789 )
Norm@50keV  : 1.18741E-03    ( -0.000238753   0.000232324 )
------------------------------------------------------------
#Fit statistic  : Chi-Squared                   58.10     using 59 bins.
 Reduced chi-squared = 1.0193
# Null hypothesis probability of 4.35e-01 with 57 degrees of freedom

Photon flux (15-150 keV)    in 61 sec: 0.168461 ( -0.027029  0.02703 ) ph/cm2/s
Energy fluence (15-150 keV)             : 6.6598e-07 ( -1.29838e-07  1.3437e-07 ) ergs/cm2
Cutoff power-law model
Time interval is from    0.520 sec. to   61.520 sec.
Spectral model in the cutoff power-law:
------------------------------------------------------------
Parameters  : value       lower 90%   higher 90%
Photon index: 0.977163     ( -1.92329   1.16682 )
Epeak [keV] : 44.4829      ( -34.0267 -44.4776 )
Norm@50keV  : 4.15486E-03    ( -0.00415737   0.0687958 )
------------------------------------------------------------
#Fit statistic  : Chi-Squared                   56.58     using 59 bins.
 Reduced chi-squared = 1.01036
# Null hypothesis probability of 4.53e-01 with 56 degrees of freedom

Photon flux (15-150 keV)    in 61 sec: 0.163868 ( -0.027603  0.027722 ) ph/cm2/s
Energy fluence (15-150 keV)             : 5.95511e-07 ( -1.47716e-07  1.64045e-07 ) ergs/cm2
Band function

Time interval is from    0.520 sec. to   61.520 sec.


Spectral model in the Band function:
------------------------------------------------------------
Parameters  : value       lower 90%   higher 90%
alpha       :    (     )
beta        :     (     )
Epeak [keV] :       (   )
Norm@50keV   :     (     )
------------------------------------------------------------

Photon flux (15-150 keV)    in  sec:  (    ) ph/cm2/s
Energy fluence (15-150 keV)             : 0 ( 0  0 ) ergs/cm2
Single BB

Spectral model blackbody:
------------------------------------------------------------
Parameters  : value    Lower 90%  Upper 90%
kT [keV]    : 9.16721  (-1.56746  1.99841)
R^2/D10^2   : 0.112421  (-0.0595788   0.11824)
(R is the radius in km and D10 is the distance to the source in units of 10 kpc)
------------------------------------------------------------
#Fit statistic  : Chi-Squared                   60.92     using 59 bins.
 Reduced chi-squared =
# Null hypothesis probability of 3.37e-01 with 57 degrees of freedom

Energy  Fluence     90% Error
[keV]   [erg/cm2]   [erg/cm2]
15- 25  1.132e-07   3.671e-08
25- 50  2.477e-07   6.185e-08
50-150  9.992e-08   4.288e-08
15-150  4.608e-07   1.169e-07
Thermal bremsstrahlung (OTTB)

Spectral model: thermal bremsstrahlung
------------------------------------------------------------
Parameters  : value         Lower 90%    Upper 90%
kT [keV]    : 74.6322       (-29.9899      73.9808)
Norm        : 0.817723       (-0.177552     0.237699)
------------------------------------------------------------
#Fit statistic  : Chi-Squared                   56.68     using 59 bins.
 Reduced chi-squared =
# Null hypothesis probability of 4.87e-01 with 57 degrees of freedom

Energy  Fluence     90% Error
[keV]   [erg/cm2]   [erg/cm2]
15- 25  1.288e-07   3.102e-08
25- 50  2.083e-07   4.947e-08
50-150  2.803e-07   1.750e-07
15-150  6.174e-07   2.155e-07
Double BB
Spectral model: bbodyrad<1> + bbodyrad<2>
------------------------------------------------------------
Parameters  : value         Lower 90%    Upper 90%
kT1 [keV]   : 6.97072        (-1.84637      2.08542)
R1^2/D10^2  : 0.259533        (-0.152301      0.458963)
kT2 [keV]   : 27.4906        (-13.3558      -27.4955)
R2^2/D10^2  : 1.10596E-03    (-0.00109536   0.00721313)
------------------------------------------------------------
#Fit statistic  : Chi-Squared                   53.36     using 59 bins.
 Reduced chi-squared =
# Null hypothesis probability of 5.38e-01 with 55 degrees of freedom

Energy  Fluence     90% Error
[keV]   [erg/cm2]   [erg/cm2]
15- 25  1.314e-07   7.473e-08
25- 50  2.170e-07   1.166e-07
50-150  3.015e-07   1.737e-07
15-150  6.500e-07   3.189e-07
Peak spectrum fit
Power-law model

Time interval is from    9.520 sec. to   10.520 sec.

Spectral model in power-law:
------------------------------------------------------------
Parameters  : value       lower 90%   higher 90%
Photon index: -1.99294     ( -0.647128   0.92305 )
Norm@50keV  : 2.88527E-04    ( -0.00028802   0.000839446 )
------------------------------------------------------------
#Fit statistic  : Chi-Squared                   56.97     using 59 bins.
 Reduced chi-squared = 0.999474
# Null hypothesis probability of 4.76e-01 with 57 degrees of freedom

Photon flux (15-150 keV)    in 1 sec: 0.479136 ( -0.479136  -0.203151 ) ph/cm2/s
Energy fluence (15-150 keV)             : 3.74093e-08 ( -2.03693e-08  2.23658e-08 ) ergs/cm2
Cutoff power-law model

Time interval is from    9.520 sec. to   10.520 sec.
Spectral model in the cutoff power-law:
------------------------------------------------------------
Parameters  : value       lower 90%   higher 90%
Photon index: -2.83694     ( -0.605426   0.927608 )
Epeak [keV] : 1.00000E+04      ( -10000 -10000 )
Norm@50keV  : 1.36728E-04    ( -0.000136735   0.000413608 )
------------------------------------------------------------
#Fit statistic  : Chi-Squared                   55.72     using 59 bins.
 Reduced chi-squared = 0.995
# Null hypothesis probability of 4.85e-01 with 56 degrees of freedom

Photon flux (15-150 keV)    in 1 sec: 0.480592 (    ) ph/cm2/s
Energy fluence (15-150 keV)             : 1.84493e-08 ( -1.84466e-08  1.46653e-08 ) ergs/cm2
Band function

Time interval is from    9.520 sec. to   10.520 sec.


Spectral model in the Band function:
------------------------------------------------------------
Parameters  : value       lower 90%   higher 90%
alpha       :    (     )
beta        :     (     )
Epeak [keV] :       (   )
Norm@50keV   :     (     )
------------------------------------------------------------

Photon flux (15-150 keV)    in  sec:  (    ) ph/cm2/s
Energy fluence (15-150 keV)             : 0 ( 0  0 ) ergs/cm2
Single BB

Spectral model blackbody:
------------------------------------------------------------
Parameters  : value    Lower 90%  Upper 90%
kT [keV]    : 6.85988  (-2.11898  3.29554)
R^2/D10^2   : 0.965432  (-0.958057   3.28441)
(R is the radius in km and D10 is the distance to the source in units of 10 kpc)
------------------------------------------------------------
#Fit statistic  : Chi-Squared                   60.68     using 59 bins.
 Reduced chi-squared =
# Null hypothesis probability of 3.45e-01 with 57 degrees of freedom

Energy  Fluence     90% Error
[keV]   [erg/cm2]   [erg/cm2]
15- 25  7.144e-09   4.595e-09
25- 50  9.404e-09   6.605e-09
50-150  1.448e-09   1.406e-09
15-150  1.800e-08   1.204e-08
Thermal bremsstrahlung (OTTB)

Spectral model: thermal bremsstrahlung
------------------------------------------------------------
Parameters  : value         Lower 90%    Upper 90%
kT [keV]    : 199.336       (-199.353      -199.353)
Norm        : 1.91011       (-0.865355     0.866376)
------------------------------------------------------------
#Fit statistic  : Chi-Squared                   60.75     using 59 bins.
 Reduced chi-squared =
# Null hypothesis probability of 3.42e-01 with 57 degrees of freedom

Energy  Fluence     90% Error
[keV]   [erg/cm2]   [erg/cm2]
15- 25  4.756e-09   3.278e-09
25- 50  9.150e-09   6.165e-09
50-150  2.007e-08   1.390e-08
15-150  3.397e-08   2.230e-08
Double BB
Spectral model: bbodyrad<1> + bbodyrad<2>
------------------------------------------------------------
Parameters  : value         Lower 90%    Upper 90%
kT1 [keV]   : 200.000        (-200      -200)
R1^2/D10^2  : 1.38258E-04        (-6.96487e-05      0.00066495)
kT2 [keV]   : 6.26512        (-2.04751      2.52972)
R2^2/D10^2  : 1.23210    (-0.978465   5.30866)
------------------------------------------------------------
#Fit statistic  : Chi-Squared                   50.21     using 59 bins.
 Reduced chi-squared =
# Null hypothesis probability of 6.58e-01 with 55 degrees of freedom

Energy  Fluence     90% Error
[keV]   [erg/cm2]   [erg/cm2]
15- 25  7.144e-09   5.525e-01
25- 50  9.429e-09   4.894e+00
50-150  1.458e-09   1.067e+02
15-150  1.803e-08   1.142e+02
Pre-slew spectrum (Pre-slew PHA with pre-slew DRM)
Power-law model

Spectral model in power-law:
------------------------------------------------------------
Parameters  : value       lower 90%   higher 90%
Photon index: 1.75324     ( -0.284683   0.297862 )
Norm@50keV  : 1.30427E-03    ( -0.000259586   0.000253533 )
------------------------------------------------------------
#Fit statistic  : Chi-Squared                   62.59     using 59 bins.
 Reduced chi-squared =
# Null hypothesis probability of 2.85e-01 with 57 degrees of freedom

Photon flux (15-150 keV)    in 49.5 sec: 0.176571 ( -0.029929  0.0299326 ) ph/cm2/s
Energy fluence (15-150 keV)             : 5.95703e-07 ( -1.19887e-07  1.23852e-07 ) ergs/cm2
Cutoff power-law model

Spectral model in the cutoff power-law:
------------------------------------------------------------
Parameters  : value       lower 90%   higher 90%
Photon index: 0.696791     ( -2.74824   1.23807 )
Epeak [keV] : 47.8922      ( -9.18848 -47.8289 )
Norm@50keV  : 5.74171E-03    ( -0.00578344   0.384077 )
------------------------------------------------------------
#Fit statistic  : Chi-Squared                   60.91     using 59 bins.
 Reduced chi-squared =
# Null hypothesis probability of 3.04e-01 with 56 degrees of freedom

Photon flux (15-150 keV)    in 49.5 sec: 0.170662 ( -0.030963  0.030983 ) ph/cm2/s
Energy fluence (15-150 keV)             : 5.16914e-07 ( -1.47898e-07  1.6037e-07 ) ergs/cm2
Band function
Spectral model in the Band function:
------------------------------------------------------------
Parameters  : value       lower 90%   higher 90%
alpha       :    (     )
beta        :     (     )
Epeak [keV] :       (   )
Norm@50keV   :     (     )
------------------------------------------------------------

Photon flux (15-150 keV)    in  sec:  (    ) ph/cm2/s
Energy fluence (15-150 keV)             : 0 ( 0  0 ) ergs/cm2
S(25-50 keV) vs. S(50-100 keV) plot

S(25-50 keV)  = 1.93e-07
S(50-100 keV) = 2.10e-07
T90 vs. Hardness ratio plot

T90                                   = 57 sec.
Hardness ratio (energy fluence ratio) = 1.08808
Color vs. Color plot
Count Ratio  (25-50 keV) / (15-25 keV) = 1.18537
Count Ratio (50-100 keV) / (15-25 keV) = 0.668961
Mask shadow pattern
IMX = 6.004993547405564E-01, IMY = -6.863945004957943E-02
TIME vs. PHA plot around the trigger time

Blue+Cyan dotted lines: Time interval of the scaled map
From 0.000000 to 8.192000
TIME vs. DetID plot around the trigger time
Blue+Cyan dotted lines: Time interval of the scaled map
From 0.000000 to 8.192000
100 us light curve (15-350 keV)
Blue+Cyan dotted lines: Time interval of the scaled map
From 0.000000 to 8.192000
Spacecraft aspect plot
Bright source in the pre-burst/pre-slew/post-slew images
Pre-burst image of 15-350 keV band
Time interval of the image:
-239.480000 0.520000

# RAcent  DECcent POSerr Theta    Phi  PeakCts   SNR AngSep     Name
#  [deg]    [deg]    ['] [deg]  [deg]                   [']
 92.4095 -53.9228    2.7  55.5    8.2   6.0682   4.3 ------	UNKNOWN
 69.5920 -19.6019    2.8  24.0  -29.6   1.7073   4.1 ------	UNKNOWN
 91.0460  -3.3139    2.7  45.6  -57.9   8.5807   4.3 ------	UNKNOWN
 56.0595  34.9006    2.7  48.1 -129.2   8.1991   4.3 ------	UNKNOWN
Pre-slew background subtracted image of 15-350 keV band
Time interval of the image:
0.520000 50.020600

# RAcent  DECcent POSerr Theta    Phi  PeakCts   SNR AngSep     Name
#  [deg]    [deg]    ['] [deg]  [deg]                   [']
 66.5050 -37.2651    1.1  31.1    6.5   1.2928  10.5 ------	UNKNOWN
 75.2448 -30.4594    2.4  32.8  -12.1   0.5747   4.8 ------	UNKNOWN
Post-slew image of 15-350 keV band
Time interval of the image:
131.620590 925.220590

# RAcent  DECcent POSerr Theta    Phi  PeakCts   SNR AngSep     Name
#  [deg]    [deg]    ['] [deg]  [deg]                   [']
135.7375 -40.5384    5.3  52.5   12.6   4.6927   2.2    9.6	Vela X-1
134.6616 -27.9496    4.1  56.9   -1.9   8.2489   2.8 ------	UNKNOWN
 97.4877  -1.5636    2.7  45.6  -57.9  22.4898   4.3 ------	UNKNOWN
 76.8431   2.6680    2.1  41.1  -88.1  25.4140   5.4 ------	UNKNOWN
Plot creation:
Mon Oct 24 12:45:13 EDT 2022