Estimated redshift from machine learning (Ukwatta et al. 2016) - may take a few minute to calcaulte
Image
Pre-slew 15.0-350.0 keV image (Event data)

#   RAcent    DECcent   POSerr    Theta     Phi              Peak Cts       SNR   Name
   38.9954    55.2191   0.0178    46.9568   -41.1652         3.2013722     10.855 TRIG_01110821

Foreground time interval of the image:
-11.440  23.237 (delta_t =  34.677 [sec])
Background time interval of the image:
-62.763 -11.440 (delta_t =  51.323 [sec])
Lightcurves
Notes:
- 1) The mask-weighted light curves are using the flight position.
- 2) Multiple plots of different time binning/intervals are shown to cover all scenarios of short/long GRBs, rate/image triggers, and real/false positives.
- 3) For all the mask-weighted lightcurves, the y-axis units are counts/sec/det where a det is 0.4 x 0.4 = 0.16 sq cm.
- 4) The verticle lines correspond to following: green dotted lines are T50 interval, black dotted lines are T90 interval, blue solid line(s) is a spacecraft slew start time, and orange solid line(s) is a spacecraft slew end time.
- 5) Time of each bin is in the middle of the bin.
1 s binning
From T0-310 s to T0+310 s

From T100_start - 20 s to T100_end + 30 s

Full time interval

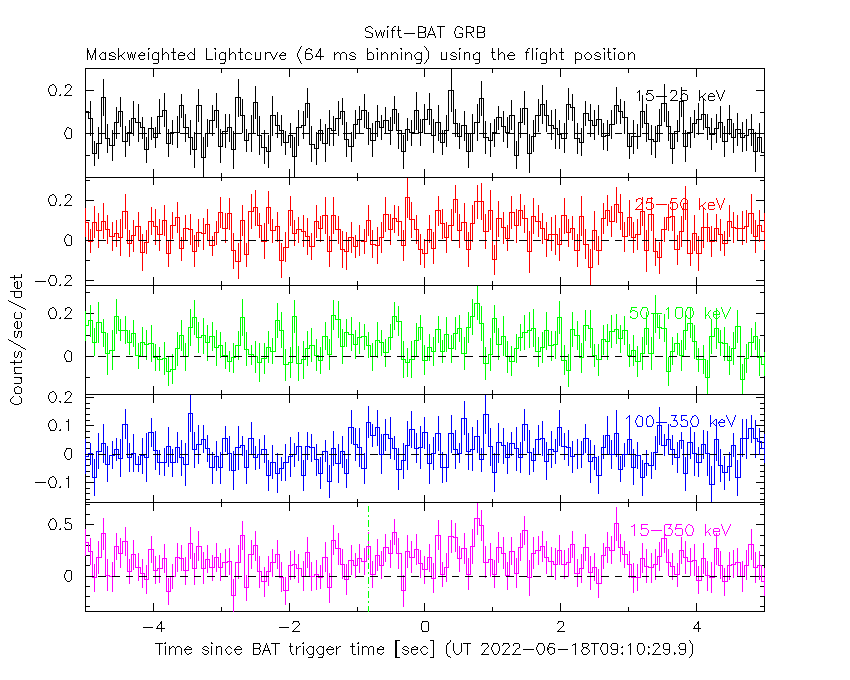
64 ms binning
Full time interval

From T100_start to T100_end

From T0-5 sec to T0+5 sec
16 ms binning
From T100_start-5 s to T100_start+5 s

Blue+Cyan dotted lines: Time interval of the scaled map
From 0.000000 to 2.048000
8 ms binning
From T100_start-3 s to T100_start+3 s
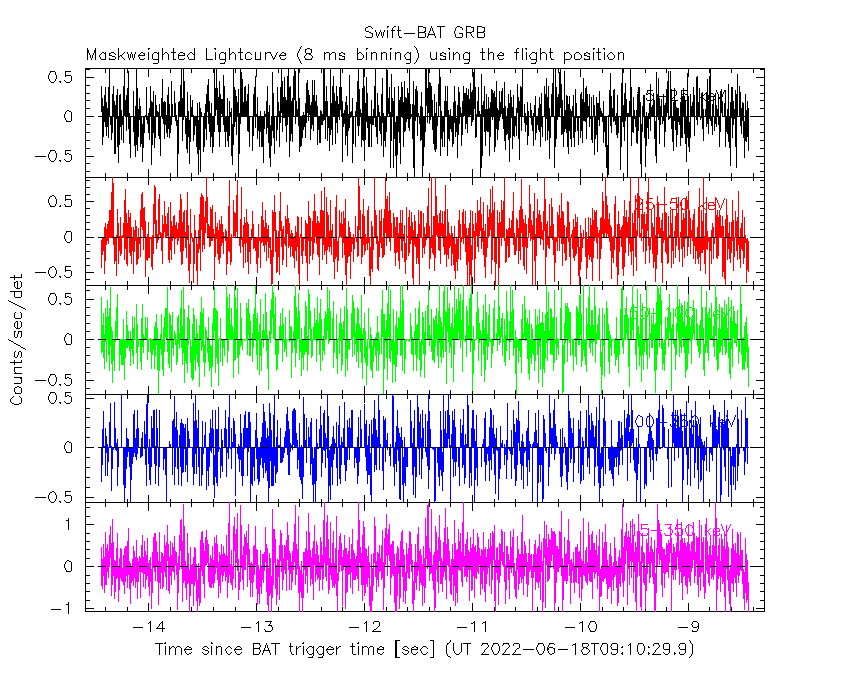
Blue+Cyan dotted lines: Time interval of the scaled map
From 0.000000 to 2.048000
2 ms binning
From T100_start-1 s to T100_start+1 s
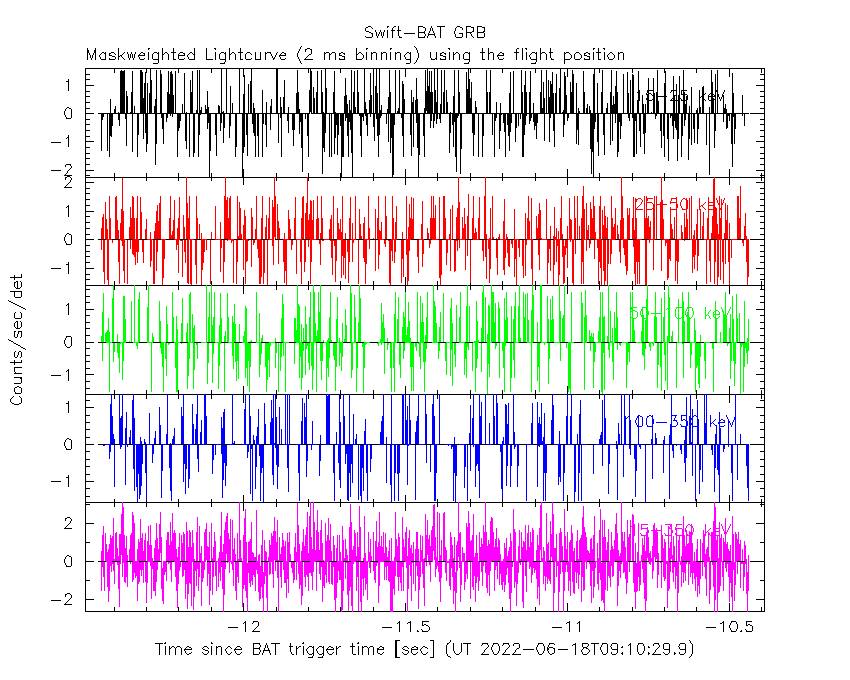
Blue+Cyan dotted lines: Time interval of the scaled map
From 0.000000 to 2.048000
SN=5 or 10 sec. binning (whichever binning is satisfied first)

SN=5 or 10 sec. binning (T < 200 sec)

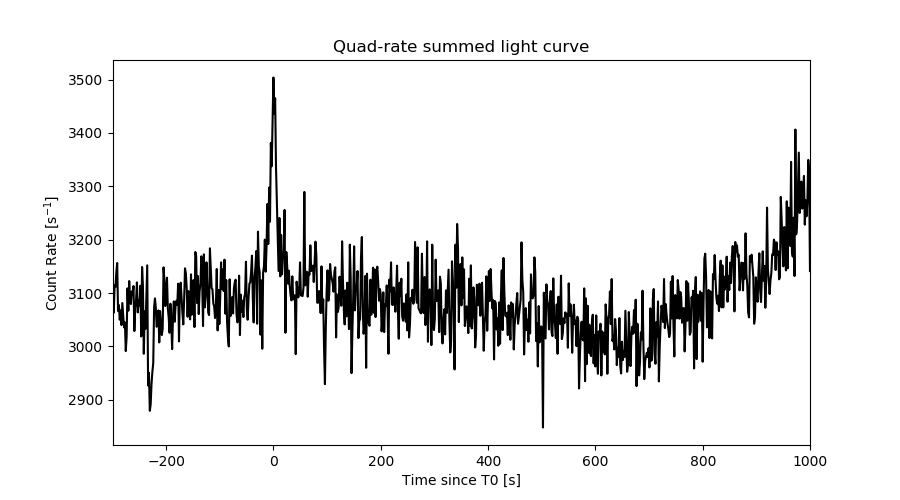
Quad-rate summed light curves (from T0-300s to T0+1000s)
Spectral Evolution

Spectra
Notes:
- 1) The fitting includes the systematic errors.
- 2) When the burst includes telescope slew time periods, the fitting uses an average response file made from multiple 5-s response files through out the slew time plus single time preiod for the non-slew times, and weighted by the total counts in the corresponding time period using addrmf. An average response file is needed becuase a spectral fit using the pre-slew DRM will introduce some errors in both a spectral shape and a normalization if the PHA file contains a lot of the slew/post-slew time interval.
- 3) For fits to more complicated models (e.g. a power-law over a cutoff power-law), the BAT team has decided to require a chi-square improvement of more than 6 for each extra dof.
Time averaged spectrum fit using the average DRM
Power-law model

Time interval is from  -11.440 sec. to  136.976 sec.

Spectral model in power-law:
------------------------------------------------------------
Parameters  : value       lower 90%   higher 90%
Photon index: 1.58917     ( -0.153745   0.155793 )
Norm@50keV  : 2.19642E-03    ( -0.000216384   0.000215638 )
------------------------------------------------------------
#Fit statistic  : Chi-Squared                   59.90     using 59 bins.
 Reduced chi-squared = 1.05088
# Null hypothesis probability of 3.71e-01 with 57 degrees of freedom

Photon flux (15-150 keV)    in 148.4 sec: 0.281318 ( -0.027924  0.027992 ) ph/cm2/s
Energy fluence (15-150 keV)             : 3.05284e-06 ( -3.17296e-07  3.19131e-07 ) ergs/cm2
Cutoff power-law model

Time interval is from  -11.440 sec. to  136.976 sec.
Spectral model in the cutoff power-law:
------------------------------------------------------------
Parameters  : value       lower 90%   higher 90%
Photon index: 0.258573     ( -0.849729   0.716323 )
Epeak [keV] : 65.8238      ( -10.2078 21.7398 )
Norm@50keV  : 1.01878E-02    ( -0.00563827   0.0162795 )
------------------------------------------------------------
#Fit statistic  : Chi-Squared                   48.55     using 59 bins.
 Reduced chi-squared = 0.866964
# Null hypothesis probability of 7.50e-01 with 56 degrees of freedom

Photon flux (15-150 keV)    in 148.4 sec: 0.267571 ( -0.028754  0.028859 ) ph/cm2/s
Energy fluence (15-150 keV)             : 2.84823e-06 ( -3.30004e-07  3.36147e-07 ) ergs/cm2
Band function

Time interval is from  -11.440 sec. to  136.976 sec.


Spectral model in the Band function:
------------------------------------------------------------
Parameters  : value       lower 90%   higher 90%
alpha       :    (     )
beta        :     (     )
Epeak [keV] :       (   )
Norm@50keV   :     (     )
------------------------------------------------------------

Photon flux (15-150 keV)    in  sec:  (    ) ph/cm2/s
Energy fluence (15-150 keV)             : 0 ( 0  0 ) ergs/cm2
Single BB

Spectral model blackbody:
------------------------------------------------------------
Parameters  : value    Lower 90%  Upper 90%
kT [keV]    : 14.6994  (-1.46478  1.6407)
R^2/D10^2   : 3.54016E-02  (-0.011345   0.016389)
(R is the radius in km and D10 is the distance to the source in units of 10 kpc)
------------------------------------------------------------
#Fit statistic  : Chi-Squared                   58.36     using 59 bins.
 Reduced chi-squared =
# Null hypothesis probability of 4.25e-01 with 57 degrees of freedom

Energy  Fluence     90% Error
[keV]   [erg/cm2]   [erg/cm2]
15- 25  2.384e-07   4.274e-08
25- 50  9.295e-07   1.109e-07
50-150  1.354e-06   2.504e-07
15-150  2.522e-06   2.894e-07
Thermal bremsstrahlung (OTTB)

Spectral model: thermal bremsstrahlung
------------------------------------------------------------
Parameters  : value         Lower 90%    Upper 90%
kT [keV]    : 162.623       (-53.924      -163.544)
Norm        : 1.17303       (-0.123245     0.139651)
------------------------------------------------------------
#Fit statistic  : Chi-Squared                   54.29     using 59 bins.
 Reduced chi-squared =
# Null hypothesis probability of 5.77e-01 with 57 degrees of freedom

Energy  Fluence     90% Error
[keV]   [erg/cm2]   [erg/cm2]
15- 25  4.438e-07   7.665e-08
25- 50  8.320e-07   3.015e-07
50-150  1.696e-06   9.439e-07
15-150  2.972e-06   1.141e-06
Double BB

Spectral model: bbodyrad<1> + bbodyrad<2>
------------------------------------------------------------
Parameters  : value         Lower 90%    Upper 90%
kT1 [keV]   : 7.39061        (-2.74783      3.3528)
R1^2/D10^2  : 0.190015        (-0.122109      0.513587)
kT2 [keV]   : 20.2809        (-4.09587      9.35755)
R2^2/D10^2  : 8.47663E-03    (-0.0068699   0.0138846)
------------------------------------------------------------
#Fit statistic  : Chi-Squared                   47.61     using 59 bins.
 Reduced chi-squared =
# Null hypothesis probability of 7.50e-01 with 55 degrees of freedom

Energy  Fluence     90% Error
[keV]   [erg/cm2]   [erg/cm2]
15- 25  3.601e-07   1.940e-07
25- 50  8.946e-07   4.111e-07
50-150  1.603e-06   8.956e-07
15-150  2.857e-06   1.491e-06
Peak spectrum fit
Power-law model

Time interval is from    0.164 sec. to    1.164 sec.

Spectral model in power-law:
------------------------------------------------------------
Parameters  : value       lower 90%   higher 90%
Photon index: 2.93654     ( -0.390674   0.452846 )
Norm@50keV  : 4.29545E-03    ( -0.00171262   0.00168007 )
------------------------------------------------------------
#Fit statistic  : Chi-Squared                   88.69     using 59 bins.
 Reduced chi-squared = 1.55596
# Null hypothesis probability of 4.56e-03 with 57 degrees of freedom

Photon flux (15-150 keV)    in 1 sec: 1.12840 ( -0.464459  0.46694 ) ph/cm2/s
Energy fluence (15-150 keV)             : 5.01718e-08 ( -1.92026e-08  1.91963e-08 ) ergs/cm2
Cutoff power-law model

Time interval is from    0.164 sec. to    1.164 sec.
Spectral model in the cutoff power-law:
------------------------------------------------------------
Parameters  : value       lower 90%   higher 90%
Photon index: -5.78960     ( 5.81476   3.42894 )
Epeak [keV] : 54.0048      ( -8.06338 8.99196 )
Norm@50keV  : 39.3406    ( -40.7605   1244.45 )
------------------------------------------------------------
#Fit statistic  : Chi-Squared                   64.62     using 59 bins.
 Reduced chi-squared = 1.15393
# Null hypothesis probability of 2.01e-01 with 56 degrees of freedom

Photon flux (15-150 keV)    in 1 sec: 1.41439 ( -0.453142  0.49429 ) ph/cm2/s
Energy fluence (15-150 keV)             : 1.07651e-07 ( -2.71391e-08  2.70963e-08 ) ergs/cm2
Band function

Time interval is from    0.164 sec. to    1.164 sec.


Spectral model in the Band function:
------------------------------------------------------------
Parameters  : value       lower 90%   higher 90%
alpha       :    (     )
beta        :     (     )
Epeak [keV] :       (   )
Norm@50keV   :     (     )
------------------------------------------------------------

Photon flux (15-150 keV)    in  sec:  (    ) ph/cm2/s
Energy fluence (15-150 keV)             : 0 ( 0  0 ) ergs/cm2
Single BB

Spectral model blackbody:
------------------------------------------------------------
Parameters  : value    Lower 90%  Upper 90%
kT [keV]    : 11.6445  (-1.22139  1.11842)
R^2/D10^2   : 0.547324  (-0.232788   0.347647)
(R is the radius in km and D10 is the distance to the source in units of 10 kpc)
------------------------------------------------------------
#Fit statistic  : Chi-Squared                   68.62     using 59 bins.
 Reduced chi-squared =
# Null hypothesis probability of 1.39e-01 with 57 degrees of freedom

Energy  Fluence     90% Error
[keV]   [erg/cm2]   [erg/cm2]
15- 25  1.565e-08   5.941e-09
25- 50  4.751e-08   1.506e-08
50-150  3.795e-08   1.377e-08
15-150  1.011e-07   3.256e-08
Thermal bremsstrahlung (OTTB)

Spectral model: thermal bremsstrahlung
------------------------------------------------------------
Parameters  : value         Lower 90%    Upper 90%
kT [keV]    : 33.8016       (-7.78469      9.53911)
Norm        : 11.1602       (-4.54273     5.31304)
------------------------------------------------------------
#Fit statistic  : Chi-Squared                   80.83     using 59 bins.
 Reduced chi-squared =
# Null hypothesis probability of 2.06e-02 with 57 degrees of freedom

Energy  Fluence     90% Error
[keV]   [erg/cm2]   [erg/cm2]
15- 25  2.403e-08   9.105e-09
25- 50  2.923e-08   9.820e-09
50-150  1.861e-08   8.259e-09
15-150  7.187e-08   2.615e-08
Double BB

Spectral model: bbodyrad<1> + bbodyrad<2>
------------------------------------------------------------
Parameters  : value         Lower 90%    Upper 90%
kT1 [keV]   : 0.138670        (13.1599      -0.13867)
R1^2/D10^2  : 85.3171        (-85.3172      -85.3172)
kT2 [keV]   : 11.6457        (-1.22177      1.11804)
R2^2/D10^2  : 0.547081    (-0.232662   0.347774)
------------------------------------------------------------
#Fit statistic  : Chi-Squared                   68.62     using 59 bins.
 Reduced chi-squared =
# Null hypothesis probability of 1.03e-01 with 55 degrees of freedom

Energy  Fluence     90% Error
[keV]   [erg/cm2]   [erg/cm2]
15- 25  0.000e+00   0.000e+00
25- 50  0.000e+00   0.000e+00
50-150  0.000e+00   0.000e+00
15-150  0.000e+00   0.000e+00
Pre-slew spectrum (Pre-slew PHA with pre-slew DRM)
Power-law model

Spectral model in power-law:
------------------------------------------------------------
Parameters  : value       lower 90%   higher 90%
Photon index: 1.44659     ( -0.141592   0.141378 )
Norm@50keV  : 7.24280E-03    ( -0.0006659   0.000665578 )
------------------------------------------------------------
#Fit statistic  : Chi-Squared                   65.75     using 59 bins.
 Reduced chi-squared =
# Null hypothesis probability of 2.00e-01 with 57 degrees of freedom

Photon flux (15-150 keV)    in 34.68 sec: 0.891835 ( -0.0855755  0.0858345 ) ph/cm2/s
Energy fluence (15-150 keV)             : 2.4051e-06 ( -2.33278e-07  2.34167e-07 ) ergs/cm2
Cutoff power-law model

Spectral model in the cutoff power-law:
------------------------------------------------------------
Parameters  : value       lower 90%   higher 90%
Photon index: -9.41491E-02     ( -0.795874   0.676833 )
Epeak [keV] : 71.9162      ( -9.74187 17.6145 )
Norm@50keV  : 3.97372E-02    ( -0.0204381   0.0520319 )
------------------------------------------------------------
#Fit statistic  : Chi-Squared                   47.72     using 59 bins.
 Reduced chi-squared =
# Null hypothesis probability of 7.77e-01 with 56 degrees of freedom

Photon flux (15-150 keV)    in 34.68 sec: 0.846503 ( -0.087342  0.087767 ) ph/cm2/s
Energy fluence (15-150 keV)             : 2.26445e-06 ( -2.39961e-07  2.42861e-07 ) ergs/cm2
Band function

Spectral model in the Band function:
------------------------------------------------------------
Parameters  : value       lower 90%   higher 90%
alpha       :    (     )
beta        :     (     )
Epeak [keV] :       (   )
Norm@50keV   :     (     )
------------------------------------------------------------

Photon flux (15-150 keV)    in  sec:  (    ) ph/cm2/s
Energy fluence (15-150 keV)             : 0 ( 0  0 ) ergs/cm2
S(25-50 keV) vs. S(50-100 keV) plot

S(25-50 keV)  = 7.88e-07
S(50-100 keV) = 1.05e-06
T90 vs. Hardness ratio plot

T90                                   = 106.368000030518 sec.
Hardness ratio (energy fluence ratio) = 1.33249
Color vs. Color plot
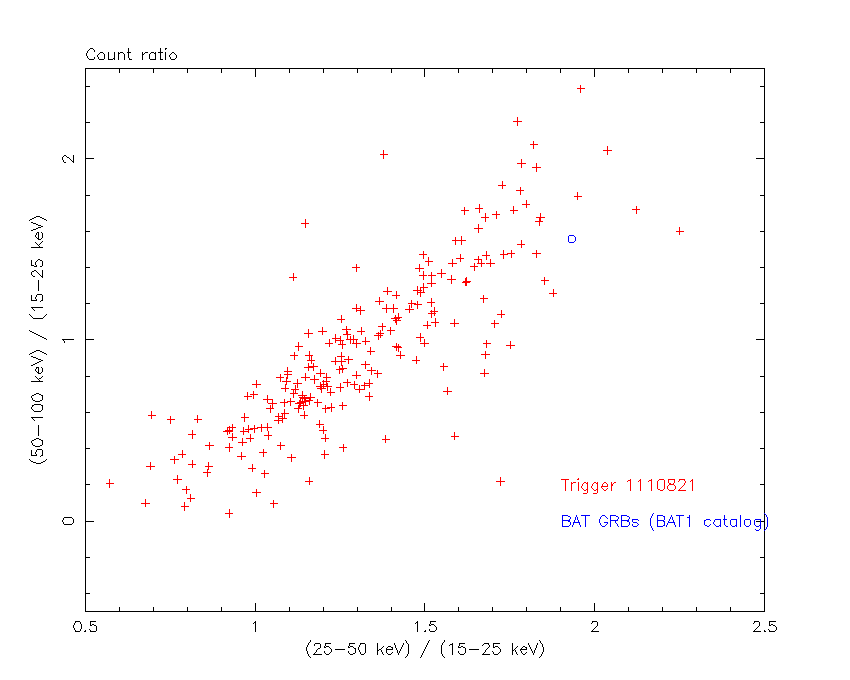
Count Ratio  (25-50 keV) / (15-25 keV) = 1.93224
Count Ratio (50-100 keV) / (15-25 keV) = 1.55745
Mask shadow pattern

IMX = 8.060750188929401E-01, IMY = 7.048003004474200E-01
TIME vs. PHA plot around the trigger time

Blue+Cyan dotted lines: Time interval of the scaled map
From 0.000000 to 2.048000
TIME vs. DetID plot around the trigger time

Blue+Cyan dotted lines: Time interval of the scaled map
From 0.000000 to 2.048000
100 us light curve (15-350 keV)

Blue+Cyan dotted lines: Time interval of the scaled map
From 0.000000 to 2.048000
Spacecraft aspect plot

Bright source in the pre-burst/pre-slew/post-slew images
Pre-burst image of 15-350 keV band
Time interval of the image:
-62.763400 -11.440000

# RAcent  DECcent POSerr Theta    Phi  PeakCts   SNR AngSep     Name
#  [deg]    [deg]    ['] [deg]  [deg]                   [']
190.1226  31.4297    2.4  43.0  143.8   1.5817   4.9 ------	UNKNOWN
167.4409  15.4530    2.8  56.4  173.5   2.3103   4.1 ------	UNKNOWN
120.6038  29.0763    2.4  48.2 -129.3   2.3425   4.9 ------	UNKNOWN
Pre-slew background subtracted image of 15-350 keV band
Time interval of the image:
-11.440000 23.236590

# RAcent  DECcent POSerr Theta    Phi  PeakCts   SNR AngSep     Name
#  [deg]    [deg]    ['] [deg]  [deg]                   [']
242.0685  51.0539    1.9  39.4   77.0   2.2687   6.0 ------	UNKNOWN
 38.9954  55.2191    1.1  47.0  -41.2   3.2011  10.9 ------	UNKNOWN
Post-slew image of 15-350 keV band
Time interval of the image:
130.636590 648.936600

# RAcent  DECcent POSerr Theta    Phi  PeakCts   SNR AngSep     Name
#  [deg]    [deg]    ['] [deg]  [deg]                   [']
356.5595  17.2693    3.3  49.7   35.5   6.1608   3.5 ------	UNKNOWN
 32.0556   8.1828    2.5  47.3  -12.8   5.0651   4.6 ------	UNKNOWN
127.9007  49.7459    2.8  50.7 -145.5   8.4614   4.2 ------	UNKNOWN
 81.6598  27.8292    1.9  41.0  -88.1  18.4145   6.1 ------	UNKNOWN
Plot creation:
Mon Oct 24 12:44:34 EDT 2022