Estimated redshift from machine learning (Ukwatta et al. 2016) - may take a few minutes to calcaulte
Image
Pre-slew 15-350 keV image (Event data; bkg subtracted)

#   RAcent  DECcent POSerr  Theta    Phi     Peak Cts     SNR  Name
  299.5137 +35.0712 0.0141   22.7  -66.9       2.7354    13.7  TRIG_01111002
------------------------------------------

Foreground time interval of the image:
  0.000  64.000 (delta_t =  64.000 [sec])
Background time interval of the image:
Lightcurves
Notes:
- 1) All plots contain as much data as has been downloaded to date.
- 2) The mask-weighted light curves are using the flight position.
- 3) Multiple plots of different time binning/intervals are shown to cover all scenarios of short/long GRBs, rate/image triggers, and real/false positives.
- 4) For all the mask-weighted lightcurves, the y-axis units are counts/sec/det where a det is 0.4 x 0.4 = 0.16 sq cm.
- 5) The verticle lines correspond to following: green dotted lines are T50 interval, black dotted lines are T90 interval, blue solid line(s) is a spacecraft slew start time, and orange solid line(s) is a spacecraft slew end time.
- 6) Time of each bin is in the middle of the bin.
1 s binning
From T0-310 s to T0+310 s

From T100_start - 20 s to T100_end + 30 s

Full time interval

64 ms binning
Full time interval

From T100_start to T100_end

From T0-5 sec to T0+5 sec

16 ms binning
From T100_start-5 s to T100_start+5 s

8 ms binning
From T100_start-3 s to T100_start+3 s

2 ms binning
From T100_start-1 s to T100_start+1 s

SN=5 or 10 sec. binning (whichever binning is satisfied first)

SN=5 or 10 sec. binning (T < 200 sec)

Spectra
Notes:
- 1) The fitting includes the systematic errors.
- 2) For long bursts, a spectral fit of the pre-slew DRM will introduce some errors in both a spectral shape and a normalization if the PHA file contains a lot of the slew/post-slew time interval.
- 3) For fits to more complicated models (e.g. a power-law over a cutoff power-law), the BAT team has decided to require a chi-square improvement of more than 6 for each extra dof.
- 4) For short bursts (T90<1sec), the specrtum is also fit with Blackbody, OTTB, and Double Blackbody.
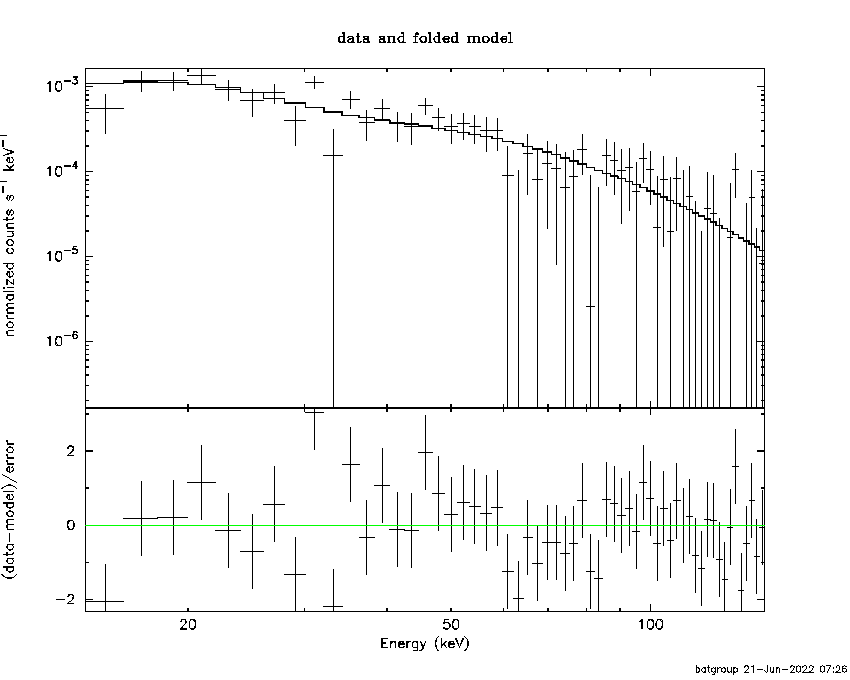
Time averaged spectrum fit using the pre-slew DRM
Power-law model

Time interval is from    0.000 sec. to   64.000 sec.

Spectral model in power-law:
------------------------------------------------------------
Parameters  : value       lower 90%   higher 90%
Photon index: 1.72477     ( -0.182739   0.188605 )
Norm@50keV  : 1.98927E-03    ( -0.000242337   0.000238356 )
------------------------------------------------------------
#Fit statistic : Chi-Squared =          59.93 using 59 PHA bins.
# Reduced chi-squared =          1.051 for     57 degrees of freedom
# Null hypothesis probability =   3.699012e-01

Photon flux (15-150 keV)    in 64 sec: 0.266524 ( -0.027754  0.027757 ) ph/cm2/s
Energy fluence (15-150 keV)             : 1.17661e-06 ( -1.48286e-07  1.5171e-07 ) ergs/cm2
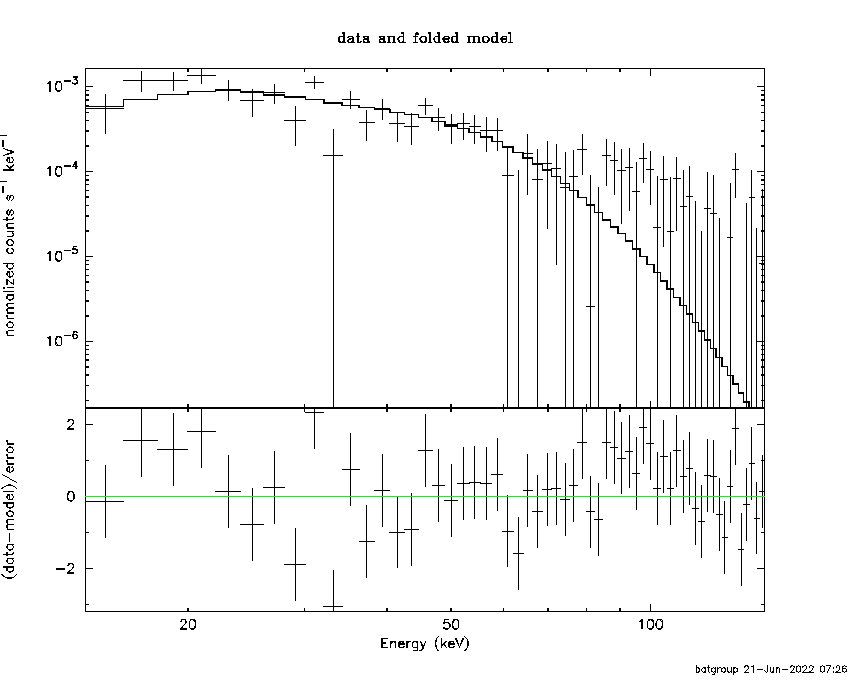
Cutoff power-law model

Time interval is from    0.000 sec. to   64.000 sec.
Spectral model in the cutoff power-law:
------------------------------------------------------------
Parameters  : value       lower 90%   higher 90%
Photon index: 0.862883     ( -1.05763   0.808583 )
Epeak [keV] : 55.3525      ( -12.706 149.142 )
Norm@50keV  : 6.22939E-03    ( -0.00622992   0.0194027 )
------------------------------------------------------------
#Fit statistic : Chi-Squared =          56.59 using 59 PHA bins.
# Reduced chi-squared =          1.010 for     56 degrees of freedom
# Null hypothesis probability =   4.529158e-01

Photon flux (15-150 keV)    in 64 sec: 0.257348 ( -0.029  0.029005 ) ph/cm2/s
Energy fluence (15-150 keV)             : 1.062e-06 ( -1.7081e-07  1.83155e-07 ) ergs/cm2
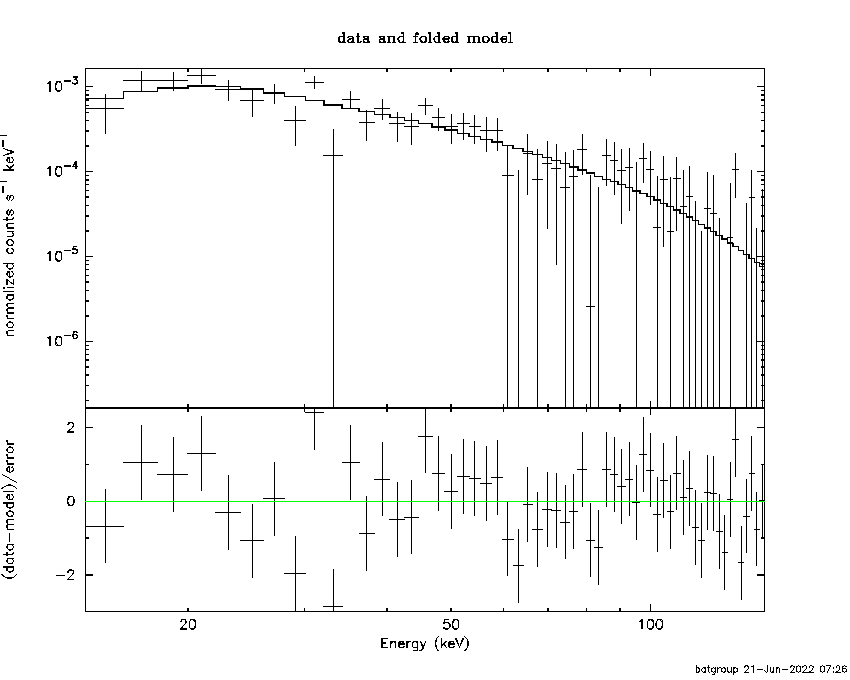
Band function

Time interval is from    0.000 sec. to   64.000 sec.

Spectral model in the Band function:
------------------------------------------------------------
Parameters  : value       lower 90%   higher 90%
alpha       : -0.401654   ( -0.950837   0.388218 )
beta        : -2.27969    ( 2.28369   0.552397 )
Epeak [keV] : 46.1776      ( -25.3205 48.6066 )
Norm@50keV   : 1.24525E-02    ( -0.0129514   97.4072 )
------------------------------------------------------------
#Fit statistic : Chi-Squared =          55.51 using 59 PHA bins.
# Reduced chi-squared =          1.009 for     55 degrees of freedom
# Null hypothesis probability =   4.555013e-01

Photon flux (15-150 keV)    in 64 sec: 0.258083 ( 6.74192  -0.028704 ) ph/cm2/s
Energy fluence (15-150 keV)             : 1.08268e-06 ( 0  0 ) ergs/cm2
Single BB

Spectral model blackbody:
------------------------------------------------------------
Parameters  : value    Lower 90%  Upper 90%
kT [keV]    : 11.0992  (-1.24805  1.44358)
R^2/D10^2   : 8.72115E-02  (-0.0318157   0.0485031)
(R is the radius in km and D10 is the distance to the source in units of 10 kpc)
------------------------------------------------------------
#Fit statistic : Chi-Squared =          66.78 using 59 PHA bins.
# Reduced chi-squared =          1.172 for     57 degrees of freedom
# Null hypothesis probability =   1.762145e-01

Energy  Fluence     90% Error
[keV]   [erg/cm2]   [erg/cm2]
15- 25  1.439e-07   2.797e-08
25- 50  4.116e-07   5.536e-08
50-150  2.884e-07   7.475e-08
15-150  8.440e-07   1.101e-07
Thermal bremsstrahlung (OTTB)

XSPEC12>exit
 XSPEC: quit


Spectral model: thermal bremsstrahlung
------------------------------------------------------------
Parameters  : value         Lower 90%    Upper 90%
kT [keV]    : 109.181       (-37.4495      72.0616)
Norm        : 1.15453       (-0.147428     0.192819)
------------------------------------------------------------
 Reduced chi-squared =

Energy  Fluence     90% Error
[keV]   [erg/cm2]   [erg/cm2]
15- 25  1.930e-07   2.915e-08
25- 50  3.394e-07   5.126e-08
50-150  5.772e-07   2.527e-07
15-150  1.110e-06   2.762e-07
Double BB

XSPEC12>exit
 XSPEC: quit


Spectral model: bbodyrad<1> + bbodyrad<2>
------------------------------------------------------------
Parameters  : value         Lower 90%    Upper 90%
kT1 [keV]   : 8.26404        (-3.67788      2.08726)
R1^2/D10^2  : 0.201292        (-0.100207      0.147412)
kT2 [keV]   : 29.7505        (-25.2928      -29.8952)
R2^2/D10^2  : 1.38915E-03    (-0.00129458   0.0283895)
------------------------------------------------------------
 Reduced chi-squared =

Energy  Fluence     90% Error
[keV]   [erg/cm2]   [erg/cm2]
15- 25  1.752e-07   5.645e-08
25- 50  3.773e-07   1.612e-07
50-150  5.650e-07   3.057e-07
15-150  1.118e-06   5.092e-07
Peak spectrum fit
Power-law model
Time interval is from    0.000 sec. to   64.000 sec.

Spectral model in power-law:
------------------------------------------------------------
Parameters  : value       lower 90%   higher 90%
Photon index: 1.72477     ( -0.182739   0.188605 )
Norm@50keV  : 1.98927E-03    ( -0.000242337   0.000238356 )
------------------------------------------------------------
#Fit statistic : Chi-Squared =          59.93 using 59 PHA bins.
# Reduced chi-squared =          1.051 for     57 degrees of freedom
# Null hypothesis probability =   3.699012e-01

Photon flux (15-150 keV)    in 64 sec: 0.266524 ( -0.027754  0.027757 ) ph/cm2/s
Energy fluence (15-150 keV)             : 1.17661e-06 ( -1.48286e-07  1.5171e-07 ) ergs/cm2
Cutoff power-law model

Time interval is from    0.000 sec. to   64.000 sec.
Spectral model in the cutoff power-law:
------------------------------------------------------------
Parameters  : value       lower 90%   higher 90%
Photon index: 0.862883     ( -1.05763   0.808583 )
Epeak [keV] : 55.3525      ( -12.706 149.142 )
Norm@50keV  : 6.22939E-03    ( -0.00622992   0.0194027 )
------------------------------------------------------------
#Fit statistic : Chi-Squared =          56.59 using 59 PHA bins.
# Reduced chi-squared =          1.010 for     56 degrees of freedom
# Null hypothesis probability =   4.529158e-01

Photon flux (15-150 keV)    in 64 sec: 0.257348 ( -0.029  0.029005 ) ph/cm2/s
Energy fluence (15-150 keV)             : 1.062e-06 ( -1.7081e-07  1.83155e-07 ) ergs/cm2
Band function

Time interval is from    0.000 sec. to   64.000 sec.

Spectral model in the Band function:
------------------------------------------------------------
Parameters  : value       lower 90%   higher 90%
alpha       : -0.401654   ( -0.950837   0.388218 )
beta        : -2.27969    ( 2.28369   0.552397 )
Epeak [keV] : 46.1776      ( -25.3205 48.6066 )
Norm@50keV   : 1.24525E-02    ( -0.0129514   97.4072 )
------------------------------------------------------------
#Fit statistic : Chi-Squared =          55.51 using 59 PHA bins.
# Reduced chi-squared =          1.009 for     55 degrees of freedom
# Null hypothesis probability =   4.555013e-01

Photon flux (15-150 keV)    in 64 sec: 0.258083 ( 6.74192  -0.028704 ) ph/cm2/s
Energy fluence (15-150 keV)             : 1.08268e-06 ( 0  0 ) ergs/cm2
Single BB
 XSPEC: quit


Spectral model blackbody:
------------------------------------------------------------
Parameters  : value    Lower 90%  Upper 90%
kT [keV]    : 11.0992  (-1.24805  1.44358)
R^2/D10^2   : 8.72115E-02  (-0.0318157   0.0485031)
(R is the radius in km and D10 is the distance to the source in units of 10 kpc)
------------------------------------------------------------
 Reduced chi-squared =

Energy  Fluence     90% Error
[keV]   [erg/cm2]   [erg/cm2]
15- 25  1.439e-07   2.925e-08
25- 50  4.116e-07   5.264e-08
50-150  2.884e-07   8.144e-08
15-150  8.440e-07   1.098e-07
Thermal bremsstrahlung (OTTB)

XSPEC12>exit
 XSPEC: quit


Spectral model: thermal bremsstrahlung
------------------------------------------------------------
Parameters  : value         Lower 90%    Upper 90%
kT [keV]    : 109.181       (-37.4495      72.0616)
Norm        : 1.15453       (-0.147428     0.192819)
------------------------------------------------------------
 Reduced chi-squared =

Energy  Fluence     90% Error
[keV]   [erg/cm2]   [erg/cm2]
15- 25  1.930e-07   2.739e-08
25- 50  3.394e-07   4.442e-08
50-150  5.772e-07   2.823e-07
15-150  1.110e-06   3.011e-07
Double BB
XSPEC12>exit
 XSPEC: quit


Spectral model: bbodyrad<1> + bbodyrad<2>
------------------------------------------------------------
Parameters  : value         Lower 90%    Upper 90%
kT1 [keV]   : 8.26404        (-3.67788      2.08726)
R1^2/D10^2  : 0.201292        (-0.100207      0.150334)
kT2 [keV]   : 29.7505        (-25.2928      -29.8952)
R2^2/D10^2  : 1.38915E-03    (-0.00129458   0.0283895)
------------------------------------------------------------
 Reduced chi-squared =

Energy  Fluence     90% Error
[keV]   [erg/cm2]   [erg/cm2]
15- 25  1.752e-07   6.769e-08
25- 50  3.773e-07   1.653e-07
50-150  5.650e-07   3.020e-07
15-150  1.118e-06   5.026e-07
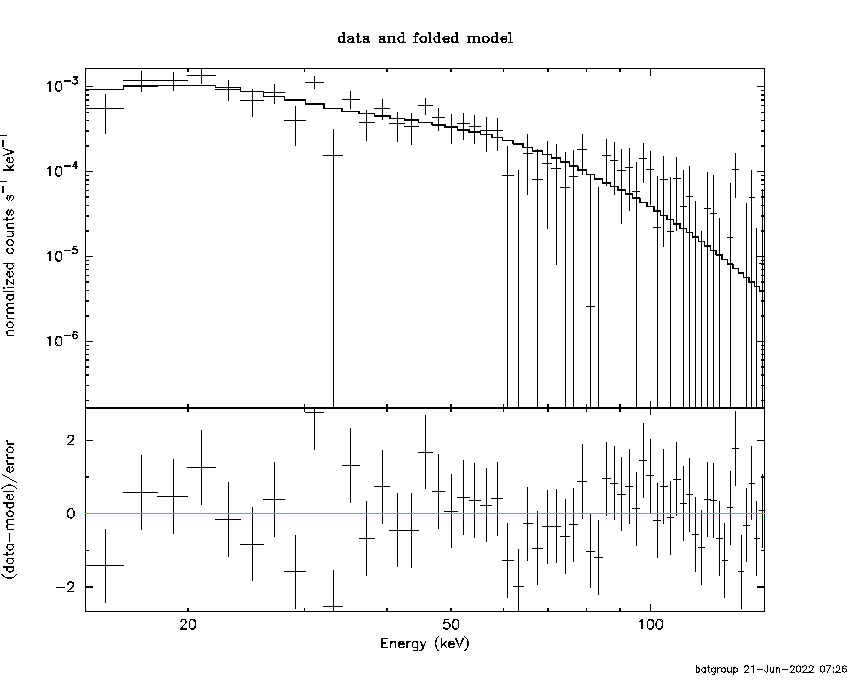
Pre-slew spectrum (Pre-slew PHA with pre-slew DRM)
Power-law model

Spectral model in power-law:
------------------------------------------------------------
Parameters  : value       lower 90%   higher 90%
Photon index: 1.72477     ( -0.182739   0.188605 )
Norm@50keV  : 1.98927E-03    ( -0.000242337   0.000238356 )
------------------------------------------------------------
#Fit statistic : Chi-Squared =          59.93 using 59 PHA bins.
# Reduced chi-squared =          1.051 for     57 degrees of freedom
# Null hypothesis probability =   3.699012e-01

Photon flux (15-150 keV)    in 64 sec: 0.266524 ( -0.027754  0.027757 ) ph/cm2/s
Energy fluence (15-150 keV)             : 1.17661e-06 ( -1.48286e-07  1.5171e-07 ) ergs/cm2
Cutoff power-law model
Spectral model in the cutoff power-law:
------------------------------------------------------------
Parameters  : value       lower 90%   higher 90%
Photon index: 0.862883     ( -1.05763   0.808583 )
Epeak [keV] : 55.3525      ( -12.706 149.142 )
Norm@50keV  : 6.22939E-03    ( -0.00622992   0.0194027 )
------------------------------------------------------------
#Fit statistic : Chi-Squared =          56.59 using 59 PHA bins.
# Reduced chi-squared =          1.010 for     56 degrees of freedom
# Null hypothesis probability =   4.529158e-01

Photon flux (15-150 keV)    in 64 sec: 0.257348 ( -0.029  0.029005 ) ph/cm2/s
Energy fluence (15-150 keV)             : 1.062e-06 ( -1.7081e-07  1.83155e-07 ) ergs/cm2
Band function

Spectral model in the Band function:
------------------------------------------------------------
Parameters  : value       lower 90%   higher 90%
alpha       : -0.401654   ( -0.950837   0.388218 )
beta        : -2.27969    ( 2.28369   0.552397 )
Epeak [keV] : 46.1776      ( -25.3205 48.6066 )
Norm@50keV   : 1.24525E-02    ( -0.0129514   97.4072 )
------------------------------------------------------------
#Fit statistic : Chi-Squared =          55.51 using 59 PHA bins.
# Reduced chi-squared =          1.009 for     55 degrees of freedom
# Null hypothesis probability =   4.555013e-01

Photon flux (15-150 keV)    in 64 sec: 0.258083 ( 6.74192  -0.028704 ) ph/cm2/s
Energy fluence (15-150 keV)             : 1.08268e-06 ( 0  0 ) ergs/cm2
S(25-50 keV) vs. S(50-100 keV) plot

S(25-50 keV)  = 3.22e-07
S(50-100 keV) = 3.89e-07
T90 vs. Hardness ratio plot

T90                                   = 64 sec.
Hardness ratio (energy fluence ratio) = 1.20807
Color vs. Color plot

Count Ratio  (25-50 keV) / (15-25 keV) = 1.22313
Count Ratio (50-100 keV) / (15-25 keV) = 0.658685
Mask shadow pattern

IMX = 1.637443928186602E-01, IMY = 3.844897676353384E-01
TIME vs. PHA plot around the trigger time

TIME vs. DetID plot around the trigger time

100 us light curve (15-350 keV)

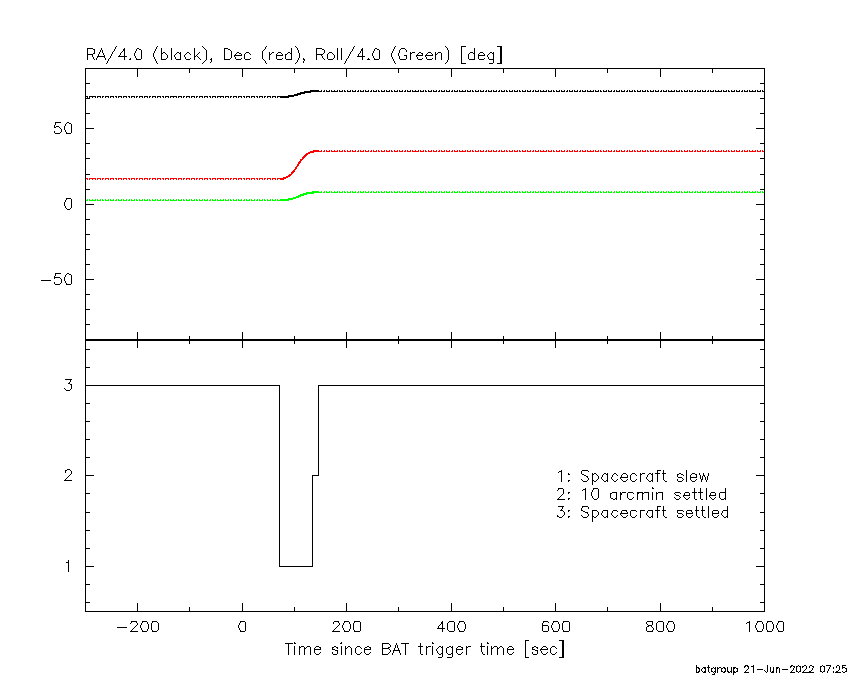
Spacecraft aspect plot
Bright source in the pre-burst/pre-slew/post-slew images
Pre-burst image of 15-350 keV band
Time interval of the image:
-239.000000 -219.280000
-119.000000 70.600600

# RAcent  DECcent POSerr Theta    Phi  PeakCts   SNR AngSep     Name
#  [deg]    [deg]    ['] [deg]  [deg]                   [']
254.4643  35.3455  257.1  32.4 -150.0  -0.0238  -0.0    0.4	Her X-1
268.5058  -1.4873   15.9  24.1  121.4  -0.4021  -0.7    8.5	SW J1753.5-0127
274.0069 -14.0360  407.8  32.5   98.4  -0.0234  -0.0    0.1	GX 17+2
288.7736  10.9642    5.5   7.3   42.9  -0.8289  -2.1    1.8	GRS 1915+105
299.5041  35.0787    0.6  22.7  -67.0   8.6431  18.4    8.5	Cyg X-1
308.1112  40.9758   61.1  31.6  -65.2  -0.1098  -0.2    1.4	Cyg X-3
326.1838  38.2513    6.2  42.3  -49.5   1.7332   1.9    4.3	Cyg X-2
265.2653  -4.5833    3.1  28.6  122.5   2.3975   3.7 ------	UNKNOWN
236.1396   3.5209    2.9  49.2  159.2   6.0097   3.9 ------	UNKNOWN
299.2090  56.3096    2.2  41.0  -88.1   8.0577   5.2 ------	UNKNOWN
Pre-slew background subtracted image of 15-350 keV band
Time interval of the image:
0.000000 64.000000

# RAcent  DECcent POSerr Theta    Phi  PeakCts   SNR AngSep     Name
#  [deg]    [deg]    ['] [deg]  [deg]                   [']
254.2803  35.3431    7.8  32.5 -150.1   0.3115   1.5    8.7	Her X-1
268.5078  -1.4684   11.5  24.1  121.5  -0.2219  -1.0    8.4	SW J1753.5-0127
274.0229 -14.0907   10.2  32.6   98.3  -0.3593  -1.1    3.4	GX 17+2
288.7388  10.8919    5.3   7.3   43.5  -0.3553  -2.2    4.8	GRS 1915+105
299.5129  35.0708    0.8  22.7  -66.9   2.7357  13.7    8.7	Cyg X-1
308.1670  40.7983    5.2  31.5  -64.9   0.5273   2.2    9.6	Cyg X-3
326.1759  38.2599    9.7  42.3  -49.5   0.4266   1.2    3.7	Cyg X-2
262.9161 -14.8883    3.6  38.2  114.3   1.5852   3.2 ------	UNKNOWN
320.4614 -11.1435    3.3  45.3   25.1   1.1363   3.5 ------	UNKNOWN
299.3811  56.3501    2.2  41.1  -88.0   3.4855   5.2 ------	UNKNOWN
Post-slew image of 15-350 keV band
Time interval of the image:
135.000590 428.360000
453.000000 963.038500

# RAcent  DECcent POSerr Theta    Phi  PeakCts   SNR AngSep     Name
#  [deg]    [deg]    ['] [deg]  [deg]                   [']
254.6225  35.1987    5.9  36.4  162.5   4.8500   2.0   11.8	Her X-1
288.7142  11.0797    7.4  25.9   83.8  -3.7384  -1.6    9.4	GRS 1915+105
299.5772  35.2147    0.5   0.1  -88.6  33.8896  22.6    1.0	Cyg X-1
308.0609  41.0861    4.5   9.0  -75.1   3.6285   2.5    8.3	Cyg X-3
325.9923  38.3852    4.4  21.4  -47.6   4.4631   2.6    9.3	Cyg X-2
355.0288   8.8542    2.1  56.9  -17.5  22.1647   5.4 ------	UNKNOWN
349.4782  62.1847    2.1  41.1  -88.0  34.2702   5.5 ------	UNKNOWN
Plot creation:
Tue Jun 21 07:27:18 EDT 2022