Estimated redshift from machine learning (Ukwatta et al. 2016) - may take a few minute to calcaulte
Image
Pre-slew 15.0-350.0 keV image (Event data)
#   RAcent    DECcent   POSerr    Theta     Phi              Peak Cts       SNR   Name
  242.4917    55.4245   0.0215    38.4841     1.7476         0.5240009      8.973 TRIG_01114034

Foreground time interval of the image:
 -1.396  13.440 (delta_t =  14.836 [sec])
Background time interval of the image:
-239.488  -1.396 (delta_t = 238.092 [sec])
Lightcurves
Notes:
- 1) The mask-weighted light curves are using the flight position.
- 2) Multiple plots of different time binning/intervals are shown to cover all scenarios of short/long GRBs, rate/image triggers, and real/false positives.
- 3) For all the mask-weighted lightcurves, the y-axis units are counts/sec/det where a det is 0.4 x 0.4 = 0.16 sq cm.
- 4) The verticle lines correspond to following: green dotted lines are T50 interval, black dotted lines are T90 interval, blue solid line(s) is a spacecraft slew start time, and orange solid line(s) is a spacecraft slew end time.
- 5) Time of each bin is in the middle of the bin.
1 s binning
From T0-310 s to T0+310 s

From T100_start - 20 s to T100_end + 30 s

Full time interval
64 ms binning
Full time interval

From T100_start to T100_end

From T0-5 sec to T0+5 sec

16 ms binning
From T100_start-5 s to T100_start+5 s
8 ms binning
From T100_start-3 s to T100_start+3 s

2 ms binning
From T100_start-1 s to T100_start+1 s
SN=5 or 10 sec. binning (whichever binning is satisfied first)
SN=5 or 10 sec. binning (T < 200 sec)
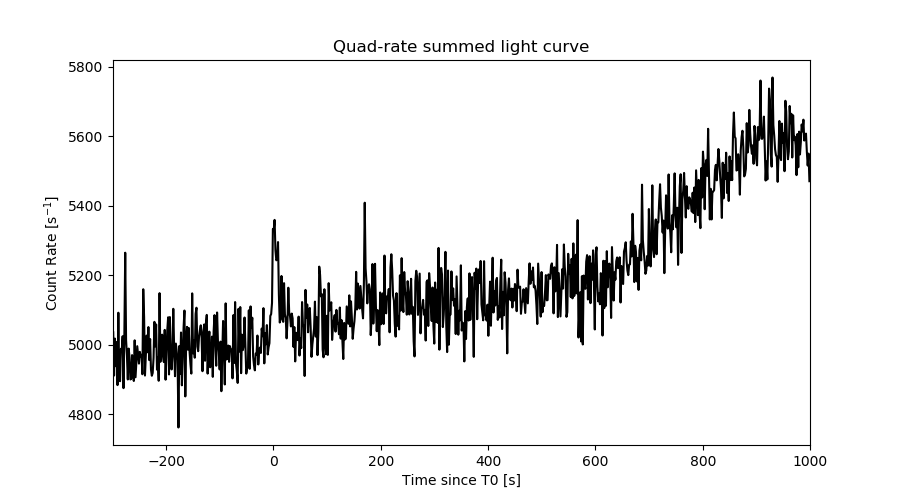
Quad-rate summed light curves (from T0-300s to T0+1000s)
Spectral Evolution

Spectra
Notes:
- 1) The fitting includes the systematic errors.
- 2) When the burst includes telescope slew time periods, the fitting uses an average response file made from multiple 5-s response files through out the slew time plus single time preiod for the non-slew times, and weighted by the total counts in the corresponding time period using addrmf. An average response file is needed becuase a spectral fit using the pre-slew DRM will introduce some errors in both a spectral shape and a normalization if the PHA file contains a lot of the slew/post-slew time interval.
- 3) For fits to more complicated models (e.g. a power-law over a cutoff power-law), the BAT team has decided to require a chi-square improvement of more than 6 for each extra dof.
Time averaged spectrum fit using the average DRM
Power-law model
Time interval is from   -1.396 sec. to   13.440 sec.

Spectral model in power-law:
------------------------------------------------------------
Parameters  : value       lower 90%   higher 90%
Photon index: 1.52013     ( -0.303699   0.3074 )
Norm@50keV  : 2.07128E-03    ( -0.000416308   0.000414253 )
------------------------------------------------------------
#Fit statistic  : Chi-Squared                   64.02     using 59 bins.
 Reduced chi-squared = 1.12316
# Null hypothesis probability of 2.44e-01 with 57 degrees of freedom

Photon flux (15-150 keV)    in 14.84 sec: 0.260015 ( -0.052246  0.052444 ) ph/cm2/s
Energy fluence (15-150 keV)             : 2.90686e-07 ( -6.18027e-08  6.26468e-08 ) ergs/cm2
Cutoff power-law model

Time interval is from   -1.396 sec. to   13.440 sec.
Spectral model in the cutoff power-law:
------------------------------------------------------------
Parameters  : value       lower 90%   higher 90%
Photon index: -0.690416     ( -2.51423   1.63425 )
Epeak [keV] : 58.4797      ( -11.8336 35.1042 )
Norm@50keV  : 2.85500E-02    ( -0.0287389   0.503946 )
------------------------------------------------------------
#Fit statistic  : Chi-Squared                   58.06     using 59 bins.
 Reduced chi-squared = 1.03679
# Null hypothesis probability of 3.99e-01 with 56 degrees of freedom

Photon flux (15-150 keV)    in 14.84 sec: 0.242581 ( -0.053301  0.053921 ) ph/cm2/s
Energy fluence (15-150 keV)             : 2.55478e-07 ( -6.0604e-08  6.62241e-08 ) ergs/cm2
Band function

Time interval is from   -1.396 sec. to   13.440 sec.


Spectral model in the Band function:
------------------------------------------------------------
Parameters  : value       lower 90%   higher 90%
alpha       :    (     )
beta        :     (     )
Epeak [keV] :       (   )
Norm@50keV   :     (     )
------------------------------------------------------------

Photon flux (15-150 keV)    in  sec:  (    ) ph/cm2/s
Energy fluence (15-150 keV)             : 0 ( 0  0 ) ergs/cm2
Single BB
Spectral model blackbody:
------------------------------------------------------------
Parameters  : value    Lower 90%  Upper 90%
kT [keV]    : 14.3052  (-2.47911  3.1147)
R^2/D10^2   : 3.78543E-02  (-0.0195169   0.0372292)
(R is the radius in km and D10 is the distance to the source in units of 10 kpc)
------------------------------------------------------------
#Fit statistic  : Chi-Squared                   58.50     using 59 bins.
 Reduced chi-squared =
# Null hypothesis probability of 4.20e-01 with 57 degrees of freedom

Energy  Fluence     90% Error
[keV]   [erg/cm2]   [erg/cm2]
15- 25  2.423e-08   9.133e-09
25- 50  9.204e-08   2.833e-08
50-150  1.254e-07   4.817e-08
15-150  2.416e-07   7.096e-08
Thermal bremsstrahlung (OTTB)

Spectral model: thermal bremsstrahlung
------------------------------------------------------------
Parameters  : value         Lower 90%    Upper 90%
kT [keV]    : 189.833       (-104.115      -187.837)
Norm        : 1.08258       (-0.213099     0.266359)
------------------------------------------------------------
#Fit statistic  : Chi-Squared                   62.22     using 59 bins.
 Reduced chi-squared =
# Null hypothesis probability of 2.96e-01 with 57 degrees of freedom

Energy  Fluence     90% Error
[keV]   [erg/cm2]   [erg/cm2]
15- 25  4.025e-08   2.302e-08
25- 50  7.699e-08   4.314e-08
50-150  1.661e-07   9.512e-08
15-150  2.833e-07   1.596e-07
Double BB
Spectral model: bbodyrad<1> + bbodyrad<2>
------------------------------------------------------------
Parameters  : value         Lower 90%    Upper 90%
kT1 [keV]   : 10.1562        (-10.1562      -10.1562)
R1^2/D10^2  : 6.19082E-02        (-0.0619082      -0.0619082)
kT2 [keV]   : 19.1175        (-19.1175      -19.1175)
R2^2/D10^2  : 8.12285E-03    (-0.00812286   0.0623291)
------------------------------------------------------------
#Fit statistic  : Chi-Squared                   58.01     using 59 bins.
 Reduced chi-squared =
# Null hypothesis probability of 3.65e-01 with 55 degrees of freedom

Energy  Fluence     90% Error
[keV]   [erg/cm2]   [erg/cm2]
15- 25  2.804e-08   3.444e-08
25- 50  9.103e-08   1.743e-07
50-150  1.391e-07   5.316e-07
15-150  2.582e-07   8.199e-07
Peak spectrum fit
Power-law model

Time interval is from    3.648 sec. to    4.648 sec.

Spectral model in power-law:
------------------------------------------------------------
Parameters  : value       lower 90%   higher 90%
Photon index: 2.32697     ( -0.509862   0.654947 )
Norm@50keV  : 4.16071E-03    ( -0.00183452   0.00177711 )
------------------------------------------------------------
#Fit statistic  : Chi-Squared                   51.88     using 59 bins.
 Reduced chi-squared = 0.910175
# Null hypothesis probability of 6.67e-01 with 57 degrees of freedom

Photon flux (15-150 keV)    in 1 sec: 0.738301 ( -0.209706  0.209764 ) ph/cm2/s
Energy fluence (15-150 keV)             : 3.99742e-08 ( -1.38496e-08  1.48964e-08 ) ergs/cm2
Cutoff power-law model
Time interval is from    3.648 sec. to    4.648 sec.
Spectral model in the cutoff power-law:
------------------------------------------------------------
Parameters  : value       lower 90%   higher 90%
Photon index: 0.586452     ( -6.10634   1.57018 )
Epeak [keV] : 29.9766      ( -24.4245 -30.2398 )
Norm@50keV  : 4.97447E-02    ( -0.0591161   578.419 )
------------------------------------------------------------
#Fit statistic  : Chi-Squared                   50.60     using 59 bins.
 Reduced chi-squared = 0.903571
# Null hypothesis probability of 6.79e-01 with 56 degrees of freedom

Photon flux (15-150 keV)    in 1 sec: 0.717741 ( -0.209156  0.210458 ) ph/cm2/s
Energy fluence (15-150 keV)             : 3.55672e-08 ( -1.21109e-08  1.56741e-08 ) ergs/cm2
Band function

Time interval is from    3.648 sec. to    4.648 sec.


Spectral model in the Band function:
------------------------------------------------------------
Parameters  : value       lower 90%   higher 90%
alpha       :    (     )
beta        :     (     )
Epeak [keV] :       (   )
Norm@50keV   :     (     )
------------------------------------------------------------

Photon flux (15-150 keV)    in  sec:  (    ) ph/cm2/s
Energy fluence (15-150 keV)             : 0 ( 0  0 ) ergs/cm2
Single BB

Spectral model blackbody:
------------------------------------------------------------
Parameters  : value    Lower 90%  Upper 90%
kT [keV]    : 8.18795  (-2.10387  2.78611)
R^2/D10^2   : 0.779890  (-0.77989   1.76552)
(R is the radius in km and D10 is the distance to the source in units of 10 kpc)
------------------------------------------------------------
#Fit statistic  : Chi-Squared                   51.20     using 59 bins.
 Reduced chi-squared =
# Null hypothesis probability of 6.91e-01 with 57 degrees of freedom

Energy  Fluence     90% Error
[keV]   [erg/cm2]   [erg/cm2]
15- 25  9.614e-09   5.800e-09
25- 50  1.751e-08   1.057e-08
50-150  4.960e-09   3.701e-09
15-150  3.209e-08   1.976e-08
Thermal bremsstrahlung (OTTB)

Spectral model: thermal bremsstrahlung
------------------------------------------------------------
Parameters  : value         Lower 90%    Upper 90%
kT [keV]    : 39.2091       (-18.8929      48.857)
Norm        : 4.95100       (-2.00494     3.82182)
------------------------------------------------------------
#Fit statistic  : Chi-Squared                   50.79     using 59 bins.
 Reduced chi-squared =
# Null hypothesis probability of 7.06e-01 with 57 degrees of freedom

Energy  Fluence     90% Error
[keV]   [erg/cm2]   [erg/cm2]
15- 25  1.129e-08   5.628e-09
25- 50  1.473e-08   8.181e-09
50-150  1.114e-08   8.739e-09
15-150  3.716e-08   2.048e-08
Double BB
Spectral model: bbodyrad<1> + bbodyrad<2>
------------------------------------------------------------
Parameters  : value         Lower 90%    Upper 90%
kT1 [keV]   : 0.961779        (-1.6299      10.9553)
R1^2/D10^2  : 8.06681E+05        (-839901      1.13933e+11)
kT2 [keV]   : 8.80413        (-2.36169      3.26445)
R2^2/D10^2  : 0.557298    (-0.558132   1.1148)
------------------------------------------------------------
#Fit statistic  : Chi-Squared                   49.66     using 59 bins.
 Reduced chi-squared =
# Null hypothesis probability of 6.78e-01 with 55 degrees of freedom

Energy  Fluence     90% Error
[keV]   [erg/cm2]   [erg/cm2]
15- 25  1.005e-08   5.065e-09
25- 50  1.675e-08   1.025e-08
50-150  6.556e-09   4.900e-09
15-150  3.336e-08   2.058e-08
Pre-slew spectrum (Pre-slew PHA with pre-slew DRM)
Power-law model

Spectral model in power-law:
------------------------------------------------------------
Parameters  : value       lower 90%   higher 90%
Photon index: 1.52013     ( -0.303699   0.3074 )
Norm@50keV  : 2.07128E-03    ( -0.000416308   0.000414253 )
------------------------------------------------------------
#Fit statistic  : Chi-Squared                   64.02     using 59 bins.
 Reduced chi-squared =
# Null hypothesis probability of 2.44e-01 with 57 degrees of freedom

Photon flux (15-150 keV)    in 14.84 sec: 0.260009 ( -0.0522443  0.0524408 ) ph/cm2/s
Energy fluence (15-150 keV)             : 2.90646e-07 ( -6.1769e-08  6.27259e-08 ) ergs/cm2
Cutoff power-law model

Spectral model in the cutoff power-law:
------------------------------------------------------------
Parameters  : value       lower 90%   higher 90%
Photon index: -0.694462     ( -2.51346   1.63496 )
Epeak [keV] : 58.4528      ( -11.8325 35.1303 )
Norm@50keV  : 2.87024E-02    ( -0.0287397   0.501344 )
------------------------------------------------------------
#Fit statistic  : Chi-Squared                   58.06     using 59 bins.
 Reduced chi-squared =
# Null hypothesis probability of 3.99e-01 with 56 degrees of freedom

Photon flux (15-150 keV)    in 14.84 sec: 0.242569 ( -0.0533  0.053905 ) ph/cm2/s
Energy fluence (15-150 keV)             : 2.55557e-07 ( -6.06259e-08  6.62547e-08 ) ergs/cm2
Band function
Spectral model in the Band function:
------------------------------------------------------------
Parameters  : value       lower 90%   higher 90%
alpha       :    (     )
beta        :     (     )
Epeak [keV] :       (   )
Norm@50keV   :     (     )
------------------------------------------------------------

Photon flux (15-150 keV)    in  sec:  (    ) ph/cm2/s
Energy fluence (15-150 keV)             : 0 ( 0  0 ) ergs/cm2
S(25-50 keV) vs. S(50-100 keV) plot
S(25-50 keV)  = 7.26e-08
S(50-100 keV) = 1.01e-07
T90 vs. Hardness ratio plot

T90                                   = 13.5239999294281 sec.
Hardness ratio (energy fluence ratio) = 1.39118
Color vs. Color plot

Count Ratio  (25-50 keV) / (15-25 keV) = 1.60484
Count Ratio (50-100 keV) / (15-25 keV) = 1.39476
Mask shadow pattern

IMX = 7.946120681721145E-01, IMY = -2.424431433485136E-02
TIME vs. PHA plot around the trigger time

TIME vs. DetID plot around the trigger time

100 us light curve (15-350 keV)

Spacecraft aspect plot
Bright source in the pre-burst/pre-slew/post-slew images
Pre-burst image of 15-350 keV band
Time interval of the image:
-239.488000 -1.396000

# RAcent  DECcent POSerr Theta    Phi  PeakCts   SNR AngSep     Name
#  [deg]    [deg]    ['] [deg]  [deg]                   [']
254.4201  35.4863    7.6  41.0   35.5   0.7528   1.5    8.8	Her X-1
184.9840 -26.0978    2.2  56.9  173.9   6.1617   5.2 ------	UNKNOWN
183.8276  -4.7645    2.7  38.7 -170.8   1.7377   4.2 ------	UNKNOWN
196.5479  25.4191    3.2   9.6 -124.7   1.0423   3.6 ------	UNKNOWN
158.7357   7.6523    2.0  49.7 -133.3   8.2138   5.8 ------	UNKNOWN
159.6582  25.9710    2.3  42.4 -109.8   5.6982   5.0 ------	UNKNOWN
Pre-slew background subtracted image of 15-350 keV band
Time interval of the image:
-1.396000 13.440000

# RAcent  DECcent POSerr Theta    Phi  PeakCts   SNR AngSep     Name
#  [deg]    [deg]    ['] [deg]  [deg]                   [']
254.4825  35.2091    4.8  41.1   35.9  -0.2196  -2.4    8.1	Her X-1
268.5041  39.4776    2.8  52.0   29.2   0.9189   4.1 ------	UNKNOWN
242.4918  55.4245    1.3  38.5    1.7   0.5243   9.0 ------	UNKNOWN
196.1569  23.6315    2.1  10.4 -134.1   0.1996   5.4 ------	UNKNOWN
177.1081 -18.7075    2.7  53.9 -174.0   0.5346   4.3 ------	UNKNOWN
265.8274  70.6619    2.1  54.8   -9.8   0.7425   5.5 ------	UNKNOWN
158.6717   7.8605    2.6  49.6 -133.0   0.8677   4.5 ------	UNKNOWN
Post-slew image of 15-350 keV band
Time interval of the image:
154.012600 962.565600

# RAcent  DECcent POSerr Theta    Phi  PeakCts   SNR AngSep     Name
#  [deg]    [deg]    ['] [deg]  [deg]                   [']
254.4411  35.3305    6.3  21.7   97.3   2.3763   1.8    1.1	Her X-1
299.5707  35.1736    0.8  43.4   37.8  27.1730  15.3    1.9	Cyg X-1
308.2018  41.0008    4.5  44.3   24.9   4.4194   2.6    5.1	Cyg X-3
268.4406  62.3725    3.0  15.0   -3.6   3.4436   3.9 ------	UNKNOWN
169.5852  39.4267    2.3  49.3 -132.2  24.1486   5.1 ------	UNKNOWN
Plot creation:
Mon Oct 24 12:43:09 EDT 2022