Special notes of this burst
Image
Pre-slew 15.0-350.0 keV image (Event data)

#   RAcent    DECcent   POSerr    Theta     Phi              Peak Cts       SNR   Name
   49.6971   -46.3883   0.0062    22.2086   -78.8115         2.0703434     30.925 TRIG_00111529

Foreground time interval of the image:
 -0.620  29.716 (delta_t =  30.336 [sec])
Background time interval of the image:
-299.608  -0.620 (delta_t = 298.988 [sec])
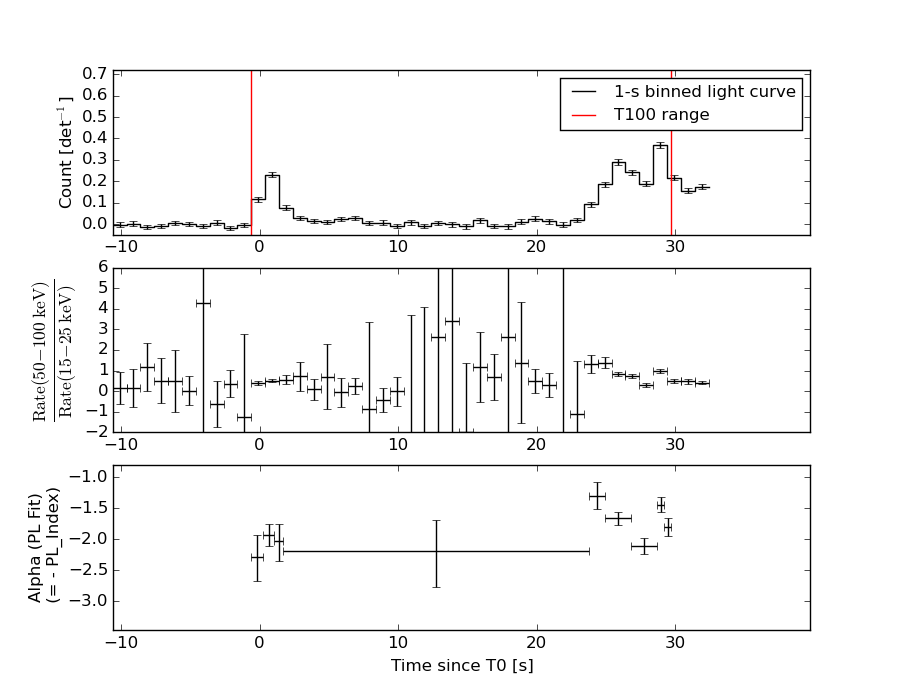
Lightcurves
Notes:
- 1) The mask-weighted light curves are using the flight position.
- 2) Multiple plots of different time binning/intervals are shown to cover all scenarios of short/long GRBs, rate/image triggers, and real/false positives.
- 3) For all the mask-weighted lightcurves, the y-axis units are counts/sec/det where a det is 0.4 x 0.4 = 0.16 sq cm.
- 4) The verticle lines correspond to following: green dotted lines are T50 interval, black dotted lines are T90 interval, blue solid line(s) is a spacecraft slew start time, and orange solid line(s) is a spacecraft slew end time.
- 5) Time of each bin is in the middle of the bin.
1 s binning
From T0-310 s to T0+310 s
From T100_start - 20 s to T100_end + 30 s
Full time interval
64 ms binning
Full time interval

From T100_start to T100_end
From T0-5 sec to T0+5 sec

16 ms binning
From T100_start-5 s to T100_start+5 s

8 ms binning
From T100_start-3 s to T100_start+3 s

2 ms binning
From T100_start-1 s to T100_start+1 s
SN=5 or 10 sec. binning (whichever binning is satisfied first)

SN=5 or 10 sec. binning (T < 200 sec)
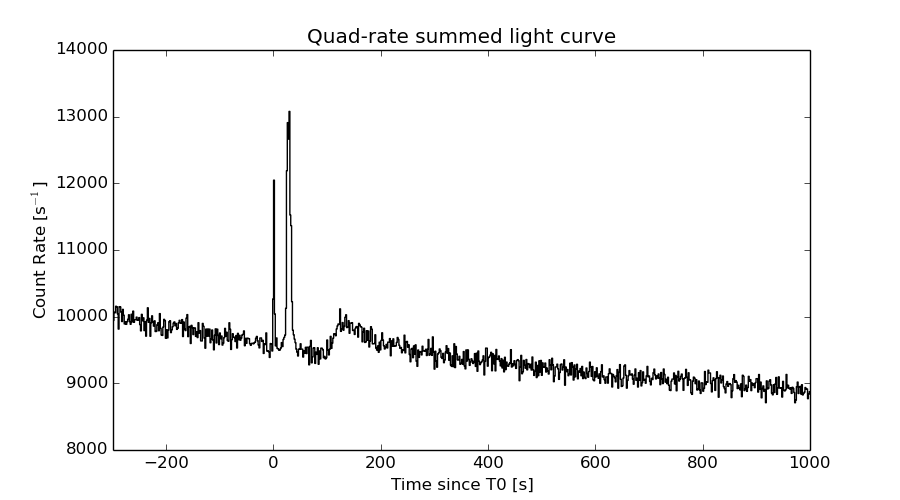
Quad-rate summed light curves (from T0-300s to T0+1000s)
Spectral Evolution
Spectra
Notes:
- 1) The fitting includes the systematic errors.
- 2) When the burst includes telescope slew time periods, the fitting uses an average response file made from multiple 5-s response files through out the slew time plus single time preiod for the non-slew times, and weighted by the total counts in the corresponding time period using addrmf. An average response file is needed becuase a spectral fit using the pre-slew DRM will introduce some errors in both a spectral shape and a normalization if the PHA file contains a lot of the slew/post-slew time interval.
- 3) For fits to more complicated models (e.g. a power-law over a cutoff power-law), the BAT team has decided to require a chi-square improvement of more than 6 for each extra dof.
Time averaged spectrum fit using the average DRM
Power-law model
Time interval is from   -0.620 sec. to   29.716 sec.

Spectral model in power-law:
------------------------------------------------------------
Parameters  : value       lower 90%   higher 90%
Photon index: 1.88812     ( -0.0909042   0.0925067 )
Norm@50keV  : 4.09445E-03    ( -0.000230425   0.000228579 )
------------------------------------------------------------
#Fit statistic : Chi-Squared =          61.18 using 59 PHA bins.
# Reduced chi-squared =          1.073 for     57 degrees of freedom
# Null hypothesis probability =   3.282111e-01

Photon flux (15-150 keV)    in 30.34 sec: 0.584655 ( -0.0287639  0.0287938 ) ph/cm2/s
Energy fluence (15-150 keV)             : 1.14201e-06 ( -6.35265e-08  6.41096e-08 ) ergs/cm2
Cutoff power-law model

Time interval is from   -0.620 sec. to   29.716 sec.
Spectral model in the cutoff power-law:
------------------------------------------------------------
Parameters  : value       lower 90%   higher 90%
Photon index: 1.03216     ( -0.451011   0.407449 )
Epeak [keV] : 49.2346      ( -5.90641 9.4415 )
Norm@50keV  : 1.21698E-02    ( -0.00485666   0.009379 )
------------------------------------------------------------
#Fit statistic : Chi-Squared =          46.93 using 59 PHA bins.
# Reduced chi-squared =         0.8380 for     56 degrees of freedom
# Null hypothesis probability =   8.008275e-01

Photon flux (15-150 keV)    in 30.34 sec: 0.557858 ( -0.030965  0.031039 ) ph/cm2/s
Energy fluence (15-150 keV)             : 1.04442e-06 ( -7.35957e-08  7.5847e-08 ) ergs/cm2
Band function

Time interval is from   -0.620 sec. to   29.716 sec.

Spectral model in the Band function:
------------------------------------------------------------
Parameters  : value       lower 90%   higher 90%
alpha       : -1.03193   ( -0.370381   0.433407 )
beta        : -10.0000    ( 10   1.77636e-15 )
Epeak [keV] : 49.2255      ( -5.9025 9.43185 )
Norm@50keV   : 1.21722E-02    ( -0.0048599   0.00938317 )
------------------------------------------------------------
#Fit statistic : Chi-Squared =          46.93 using 59 PHA bins.
# Reduced chi-squared =         0.8532 for     55 degrees of freedom
# Null hypothesis probability =   7.723355e-01

Photon flux (15-150 keV)    in 30.34 sec: 0.558633 (    ) ph/cm2/s
Energy fluence (15-150 keV)             : 0 ( 0  0 ) ergs/cm2
Single BB

Spectral model blackbody:
------------------------------------------------------------
Parameters  : value    Lower 90%  Upper 90%
kT [keV]    : 11.0085  (-0.629848  0.671565)
R^2/D10^2   : 0.187185  (-0.0377861   0.0471632)
(R is the radius in km and D10 is the distance to the source in units of 10 kpc)
------------------------------------------------------------
#Fit statistic : Chi-Squared =         104.35 using 59 PHA bins.
# Reduced chi-squared =         1.8307 for     57 degrees of freedom
# Null hypothesis probability =   1.320117e-04

Energy  Fluence     90% Error
[keV]   [erg/cm2]   [erg/cm2]
15- 25  1.438e-07   1.204e-08
25- 50  4.071e-07   2.078e-08
50-150  2.788e-07   3.606e-08
15-150  8.297e-07   4.688e-08
Thermal bremsstrahlung (OTTB)
Spectral model: thermal bremsstrahlung
------------------------------------------------------------
Parameters  : value         Lower 90%    Upper 90%
kT [keV]    : 80.6714       (-12.4901      16.4361)
Norm        : 2.72278       (-0.205426     0.22753)
------------------------------------------------------------
#Fit statistic : Chi-Squared =          48.01 using 59 PHA bins.
# Reduced chi-squared =         0.8422 for     57 degrees of freedom
# Null hypothesis probability =   7.961177e-01

Energy  Fluence     90% Error
[keV]   [erg/cm2]   [erg/cm2]
15- 25  2.145e-07   1.478e-08
25- 50  3.538e-07   1.654e-08
50-150  5.022e-07   6.053e-08
15-150  1.070e-06   7.024e-08
Double BB
Spectral model: bbodyrad<1> + bbodyrad<2>
------------------------------------------------------------
Parameters  : value         Lower 90%    Upper 90%
kT1 [keV]   : 6.48931        (-1.01335      1.06518)
R1^2/D10^2  : 0.883055        (-0.334872      0.653487)
kT2 [keV]   : 19.3321        (-3.05249      4.66454)
R2^2/D10^2  : 1.50669E-02    (-0.00884715   0.0162106)
------------------------------------------------------------
#Fit statistic : Chi-Squared =          43.46 using 59 PHA bins.
# Reduced chi-squared =         0.7901 for     55 degrees of freedom
# Null hypothesis probability =   8.695011e-01

Energy  Fluence     90% Error
[keV]   [erg/cm2]   [erg/cm2]
15- 25  1.997e-07   5.470e-08
25- 50  3.583e-07   7.788e-08
50-150  4.721e-07   2.088e-07
15-150  1.030e-06   2.966e-07
Peak spectrum fit
Power-law model
Time interval is from   28.580 sec. to   29.580 sec.

Spectral model in power-law:
------------------------------------------------------------
Parameters  : value       lower 90%   higher 90%
Photon index: 1.64235     ( -0.0978626   0.0992584 )
Norm@50keV  : 2.48139E-02    ( -0.00153675   0.00152783 )
------------------------------------------------------------
#Fit statistic : Chi-Squared =          72.04 using 59 PHA bins.
# Reduced chi-squared =          1.264 for     57 degrees of freedom
# Null hypothesis probability =   8.656552e-02

Photon flux (15-150 keV)    in 1 sec: 3.23196 ( -0.188473  0.18858 ) ph/cm2/s
Energy fluence (15-150 keV)             : 2.30959e-07 ( -1.52161e-08  1.53242e-08 ) ergs/cm2
Cutoff power-law model

Time interval is from   28.580 sec. to   29.580 sec.
Spectral model in the cutoff power-law:
------------------------------------------------------------
Parameters  : value       lower 90%   higher 90%
Photon index: 0.805755     ( -0.462061   0.418565 )
Epeak [keV] : 67.2495      ( -10.1553 22.4428 )
Norm@50keV  : 6.87665E-02    ( -0.0269682   0.0507474 )
------------------------------------------------------------
#Fit statistic : Chi-Squared =          59.29 using 59 PHA bins.
# Reduced chi-squared =          1.059 for     56 degrees of freedom
# Null hypothesis probability =   3.564918e-01

Photon flux (15-150 keV)    in 1 sec: 3.12569 ( -0.19509  0.19517 ) ph/cm2/s
Energy fluence (15-150 keV)             : 2.16194e-07 ( -1.6615e-08  1.6838e-08 ) ergs/cm2
Band function
Time interval is from   28.580 sec. to   29.580 sec.

Spectral model in the Band function:
------------------------------------------------------------
Parameters  : value       lower 90%   higher 90%
alpha       : -0.805706   ( -0.334712   0.535564 )
beta        : -10.0000    ( 10   1.06581e-13 )
Epeak [keV] : 67.2365      ( -8.7993 22.4386 )
Norm@50keV   : 6.87683E-02    ( -0.0269732   0.0508306 )
------------------------------------------------------------
#Fit statistic : Chi-Squared =          59.29 using 59 PHA bins.
# Reduced chi-squared =          1.078 for     55 degrees of freedom
# Null hypothesis probability =   3.219727e-01

Photon flux (15-150 keV)    in 1 sec:  (    ) ph/cm2/s
Energy fluence (15-150 keV)             : 0 ( 0  0 ) ergs/cm2
Single BB
Spectral model blackbody:
------------------------------------------------------------
Parameters  : value    Lower 90%  Upper 90%
kT [keV]    : 13.2333  (-0.916496  0.98619)
R^2/D10^2   : 0.566471  (-0.129368   0.167264)
(R is the radius in km and D10 is the distance to the source in units of 10 kpc)
------------------------------------------------------------
#Fit statistic : Chi-Squared =         105.29 using 59 PHA bins.
# Reduced chi-squared =         1.8472 for     57 degrees of freedom
# Null hypothesis probability =   1.046514e-04

Energy  Fluence     90% Error
[keV]   [erg/cm2]   [erg/cm2]
15- 25  2.103e-08   2.250e-09
25- 50  7.382e-08   5.300e-09
50-150  8.258e-08   1.096e-08
15-150  1.774e-07   1.230e-08
Thermal bremsstrahlung (OTTB)

Spectral model: thermal bremsstrahlung
------------------------------------------------------------
Parameters  : value         Lower 90%    Upper 90%
kT [keV]    : 143.427       (      )
Norm        : 13.5160       (-0.876861     1.03626)
------------------------------------------------------------
#Fit statistic : Chi-Squared =          62.70 using 59 PHA bins.
# Reduced chi-squared =          1.100 for     57 degrees of freedom
# Null hypothesis probability =   2.812929e-01

Energy  Fluence     90% Error
[keV]   [erg/cm2]   [erg/cm2]
15- 25  3.469e-08   2.955e-09
25- 50  6.394e-08   7.350e-09
50-150  1.242e-07   4.139e-08
15-150  2.228e-07   5.035e-08
Double BB
Spectral model: bbodyrad<1> + bbodyrad<2>
------------------------------------------------------------
Parameters  : value         Lower 90%    Upper 90%
kT1 [keV]   : 6.66038        (-1.23547      1.41651)
R1^2/D10^2  : 3.82134        (-1.72783      3.80248)
kT2 [keV]   : 20.9562        (-3.09331      4.85785)
R2^2/D10^2  : 8.08031E-02    (-0.0461167   0.0747997)
------------------------------------------------------------
#Fit statistic : Chi-Squared =          56.16 using 59 PHA bins.
# Reduced chi-squared =          1.021 for     55 degrees of freedom
# Null hypothesis probability =   4.313107e-01

Energy  Fluence     90% Error
[keV]   [erg/cm2]   [erg/cm2]
15- 25  3.250e-08   8.580e-09
25- 50  6.645e-08   1.342e-08
50-150  1.172e-07   3.494e-08
15-150  2.161e-07   5.795e-08
Pre-slew spectrum (Pre-slew PHA with pre-slew DRM)
Power-law model

Spectral model in power-law:
------------------------------------------------------------
Parameters  : value       lower 90%   higher 90%
Photon index: 1.88812     ( -0.0909042   0.0925067 )
Norm@50keV  : 4.09445E-03    ( -0.000230425   0.000228579 )
------------------------------------------------------------
#Fit statistic : Chi-Squared =          61.18 using 59 PHA bins.
# Reduced chi-squared =          1.073 for     57 degrees of freedom
# Null hypothesis probability =   3.282111e-01

Photon flux (15-150 keV)    in 30.34 sec: 0.584655 ( -0.0287639  0.0287938 ) ph/cm2/s
Energy fluence (15-150 keV)             : 1.14201e-06 ( -6.35265e-08  6.41096e-08 ) ergs/cm2
Cutoff power-law model

Spectral model in the cutoff power-law:
------------------------------------------------------------
Parameters  : value       lower 90%   higher 90%
Photon index: 1.03216     ( -0.451011   0.407449 )
Epeak [keV] : 49.2346      ( -5.90641 9.4415 )
Norm@50keV  : 1.21698E-02    ( -0.00485666   0.009379 )
------------------------------------------------------------
#Fit statistic : Chi-Squared =          46.93 using 59 PHA bins.
# Reduced chi-squared =         0.8380 for     56 degrees of freedom
# Null hypothesis probability =   8.008275e-01

Photon flux (15-150 keV)    in 30.34 sec: 0.557858 ( -0.030965  0.031039 ) ph/cm2/s
Energy fluence (15-150 keV)             : 1.04442e-06 ( -7.35957e-08  7.5847e-08 ) ergs/cm2
Band function
Spectral model in the Band function:
------------------------------------------------------------
Parameters  : value       lower 90%   higher 90%
alpha       : -1.03193   ( -0.370381   0.433407 )
beta        : -10.0000    ( 10   5.32907e-15 )
Epeak [keV] : 49.2255      ( -5.9025 9.43185 )
Norm@50keV   : 1.21722E-02    ( -0.0048599   0.00938317 )
------------------------------------------------------------
#Fit statistic : Chi-Squared =          46.93 using 59 PHA bins.
# Reduced chi-squared =         0.8532 for     55 degrees of freedom
# Null hypothesis probability =   7.723355e-01

Photon flux (15-150 keV)    in 30.34 sec: 0.558633 (    ) ph/cm2/s
Energy fluence (15-150 keV)             : 0 ( 0  0 ) ergs/cm2
S(25-50 keV) vs. S(50-100 keV) plot

S(25-50 keV)  = 3.32e-07
S(50-100 keV) = 3.59e-07
T90 vs. Hardness ratio plot
T90                                   = 16.1240000128746 sec.
Hardness ratio (energy fluence ratio) = 1.08133
Color vs. Color plot
Count Ratio  (25-50 keV) / (15-25 keV) = 1.24884
Count Ratio (50-100 keV) / (15-25 keV) = 0.652201
Mask shadow pattern

IMX = 7.921960456349829E-02, IMY = 4.005086390093962E-01
TIME vs. PHA plot around the trigger time

TIME vs. DetID plot around the trigger time
100 us light curve (15-350 keV)

Spacecraft aspect plot

Bright source in the pre-burst/pre-slew/post-slew images
Pre-burst image of 15-350 keV band
Time interval of the image:
-299.608000 -0.620000

# RAcent  DECcent POSerr Theta    Phi  PeakCts   SNR AngSep     Name
#  [deg]    [deg]    ['] [deg]  [deg]                   [']
135.5424 -40.5595    0.9  38.1   81.6   7.5343  12.6    0.7	Vela X-1
170.3066 -60.6232   34.1  42.1  127.3   0.2147   0.3    0.3	Cen X-3
186.5540 -62.7816    2.4  46.5  136.8   3.7866   4.8    2.9	GX 301-2
 63.8756 -12.6890    2.3  47.0  -29.3   1.8503   5.1 ------	UNKNOWN
Pre-slew background subtracted image of 15-350 keV band
Time interval of the image:
-0.620000 29.716000

# RAcent  DECcent POSerr Theta    Phi  PeakCts   SNR AngSep     Name
#  [deg]    [deg]    ['] [deg]  [deg]                   [']
135.5420 -40.5869    5.6  38.1   81.6  -0.3632  -2.1    2.0	Vela X-1
170.0651 -60.5847   17.0  42.1  127.1  -0.1256  -0.7    7.7	Cen X-3
186.7491 -62.7819   27.6  46.6  136.9   0.0974   0.4    2.6	GX 301-2
 49.6972 -46.3883    0.4  22.2  -78.8   2.0700  30.9 ------	UNKNOWN
 41.9572 -41.8623    2.0  29.3  -80.3   0.4443   5.7 ------	UNKNOWN
Post-slew image of 15-350 keV band
Time interval of the image:
Plot creation:
Sun May 31 17:19:35 EDT 2015