Click here for the BAT GCN circular template
Image
Pre-slew 15.0-350.0 keV image (Event data)

#   RAcent    DECcent   POSerr    Theta     Phi              Peak Cts       SNR   Name
  154.1717    43.5797   0.0236    37.0839   158.0771         0.9717634      8.159 TRIG_00111622

Foreground time interval of the image:
-66.187  10.413 (delta_t =  76.600 [sec])
Background time interval of the image:
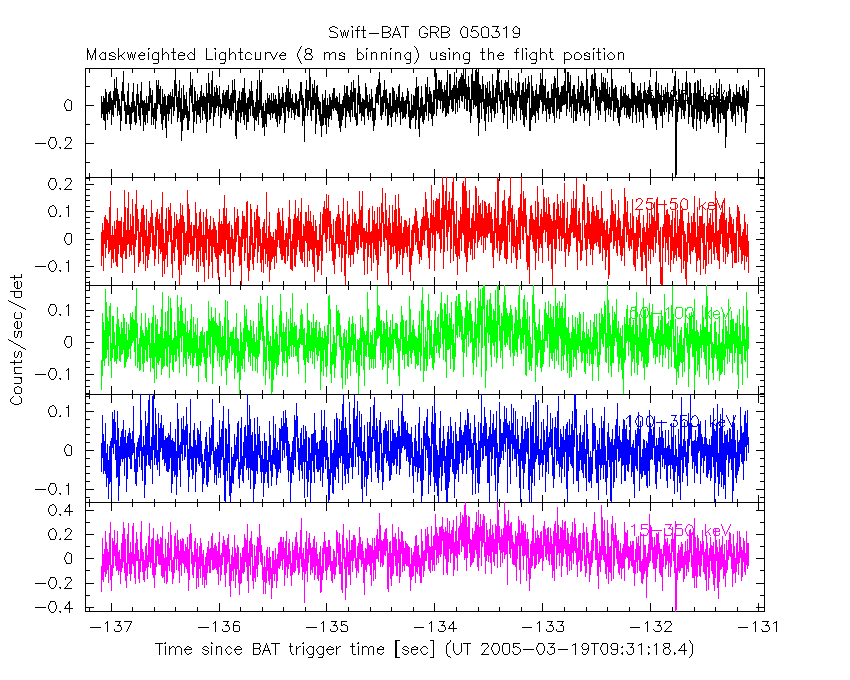
Lightcurves
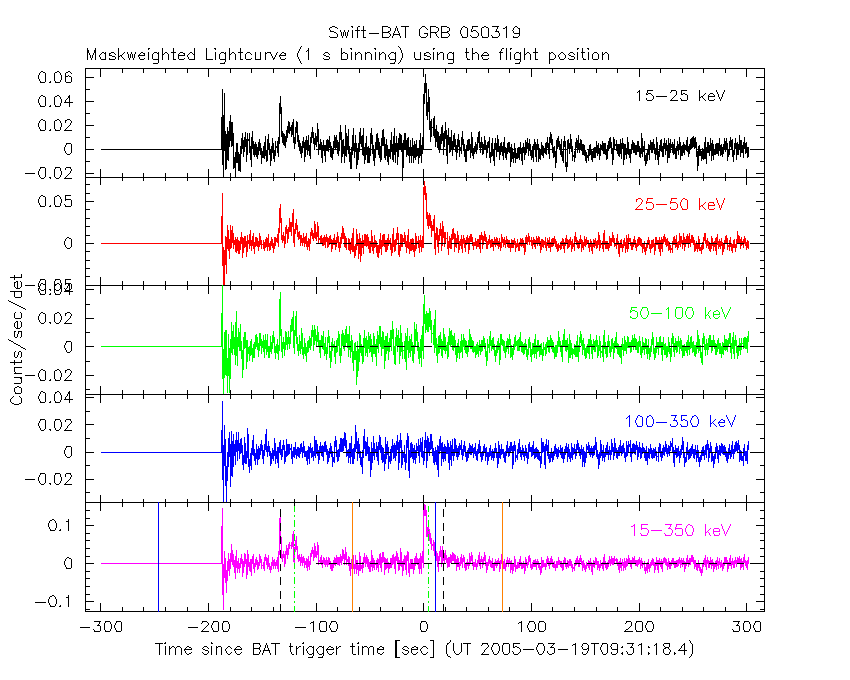
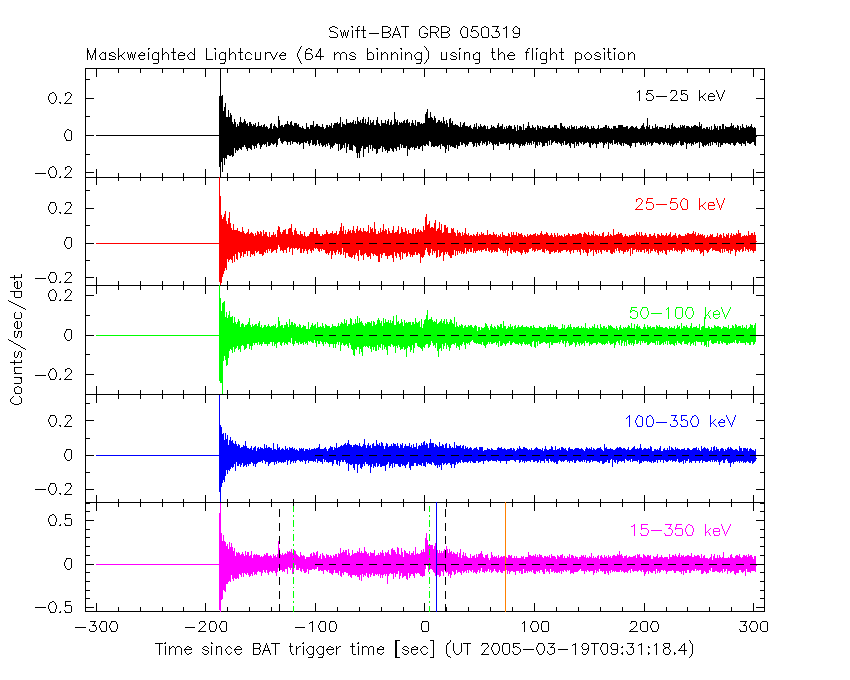
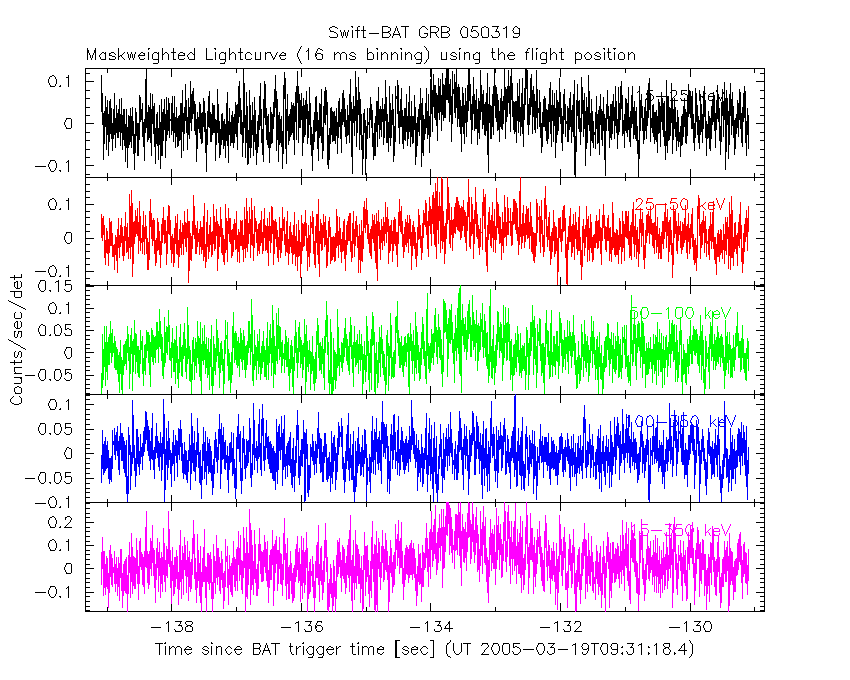
Notes:
- 1) The mask-weighted light curves are using the flight position.
- 2) Multiple plots of different time binning/intervals are shown to cover all scenarios of short/long GRBs, rate/image triggers, and real/false positives.
- 3) For all the mask-weighted lightcurves, the y-axis units are counts/sec/det where a det is 0.4 x 0.4 = 0.16 sq cm.
- 4) The verticle lines correspond to following: green dotted lines are T50 interval, black dotted lines are T90 interval, blue solid line(s) is a spacecraft slew start time, and orange solid line(s) is a spacecraft slew end time.
- 5) Time of each bin is in the middle of the bin.
1 s binning
From T0-310 s to T0+310 s

From T100_start - 20 s to T100_end + 30 s
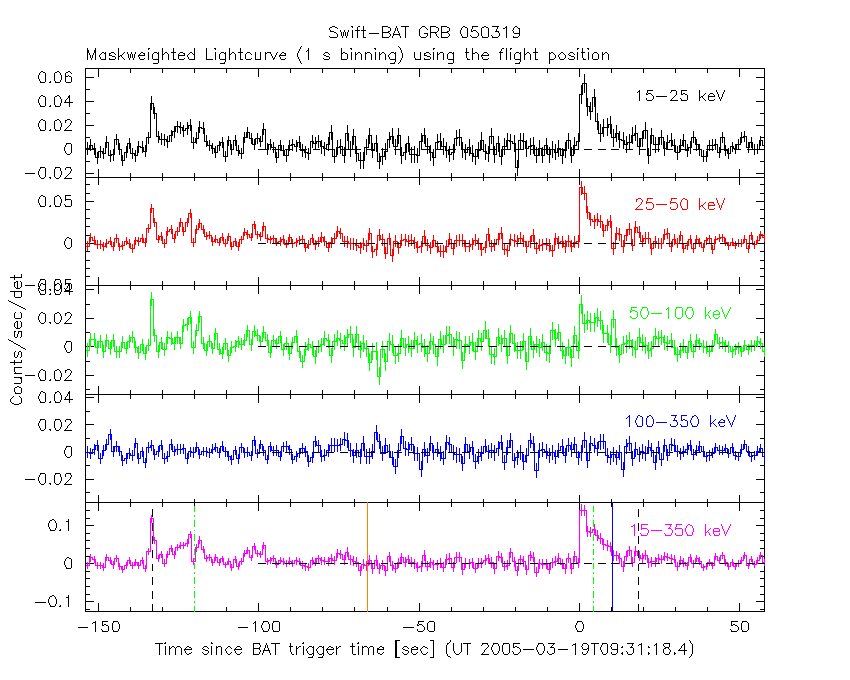
Full time interval
64 ms binning
Full time interval
From T100_start to T100_end

From T0-5 sec to T0+5 sec

16 ms binning
From T100_start-5 s to T100_start+5 s
8 ms binning
From T100_start-3 s to T100_start+3 s
2 ms binning
From T100_start-1 s to T100_start+1 s

SN=5 or 10 sec. binning (whichever binning is satisfied first)
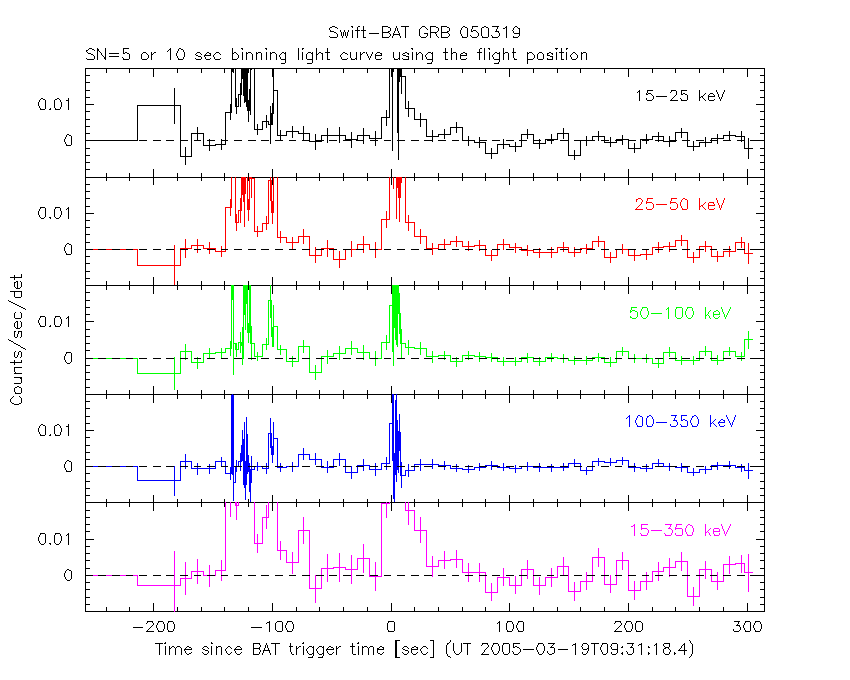
SN=5 or 10 sec. binning (T < 200 sec)

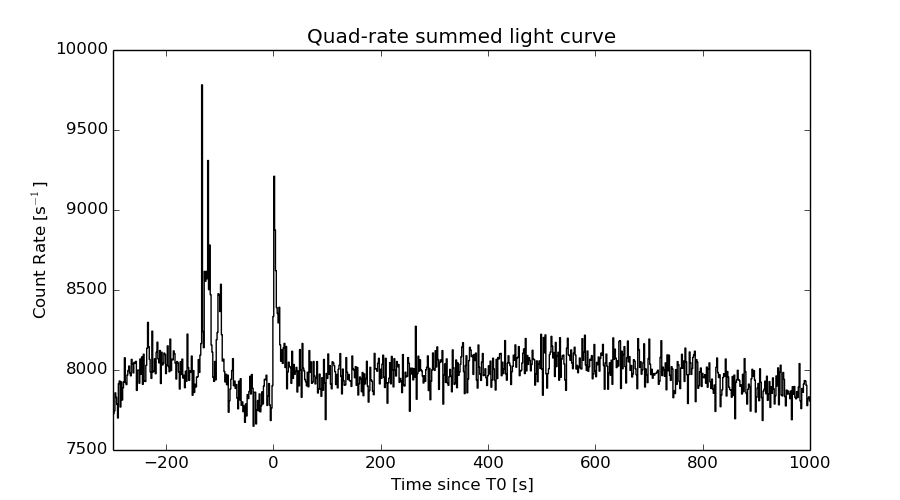
Quad-rate summed light curves (from T0-300s to T0+1000s)
Spectral Evolution

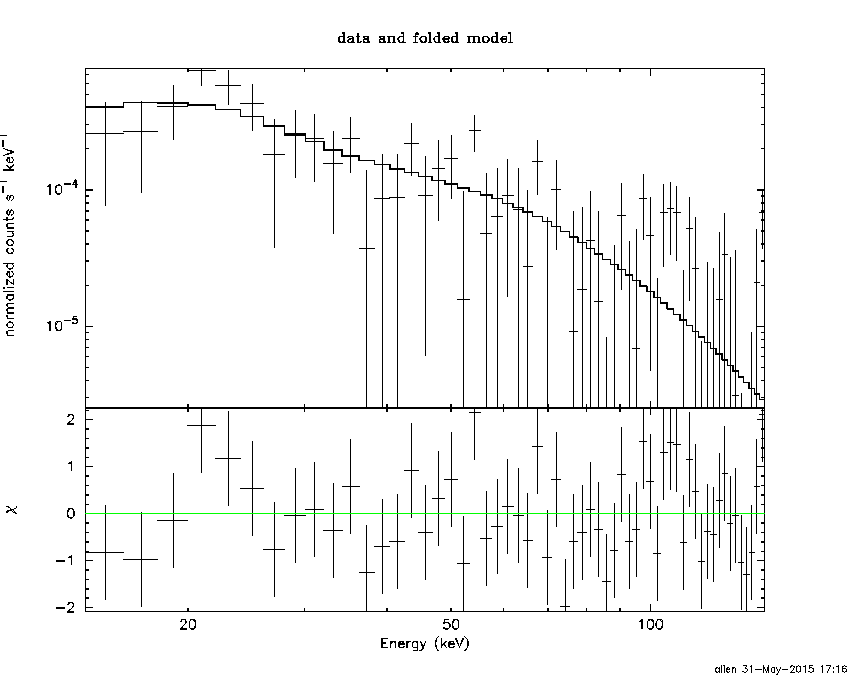
Spectra
Notes:
- 1) The fitting includes the systematic errors.
- 2) When the burst includes telescope slew time periods, the fitting uses an average response file made from multiple 5-s response files through out the slew time plus single time preiod for the non-slew times, and weighted by the total counts in the corresponding time period using addrmf. An average response file is needed becuase a spectral fit using the pre-slew DRM will introduce some errors in both a spectral shape and a normalization if the PHA file contains a lot of the slew/post-slew time interval.
- 3) For fits to more complicated models (e.g. a power-law over a cutoff power-law), the BAT team has decided to require a chi-square improvement of more than 6 for each extra dof.
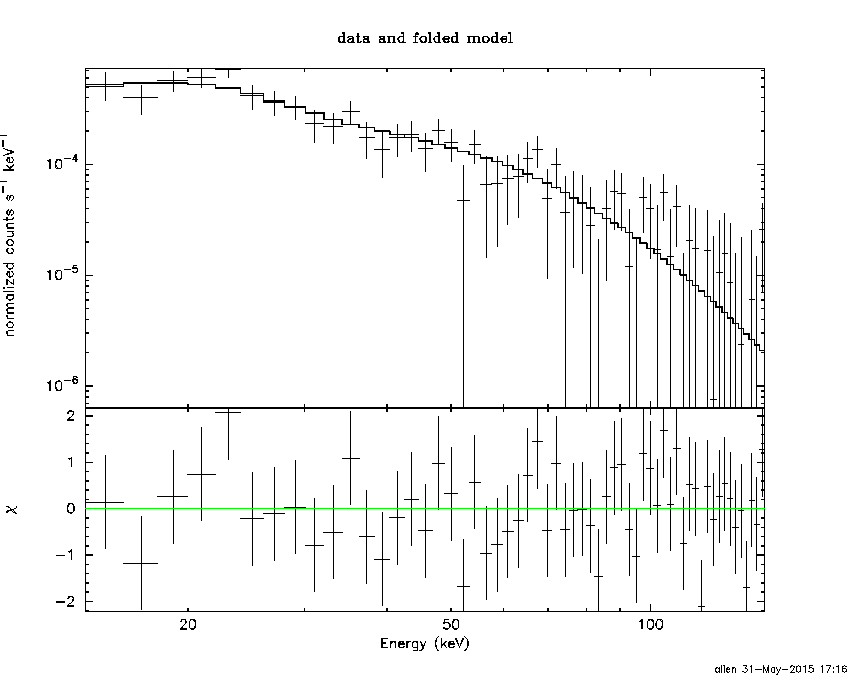
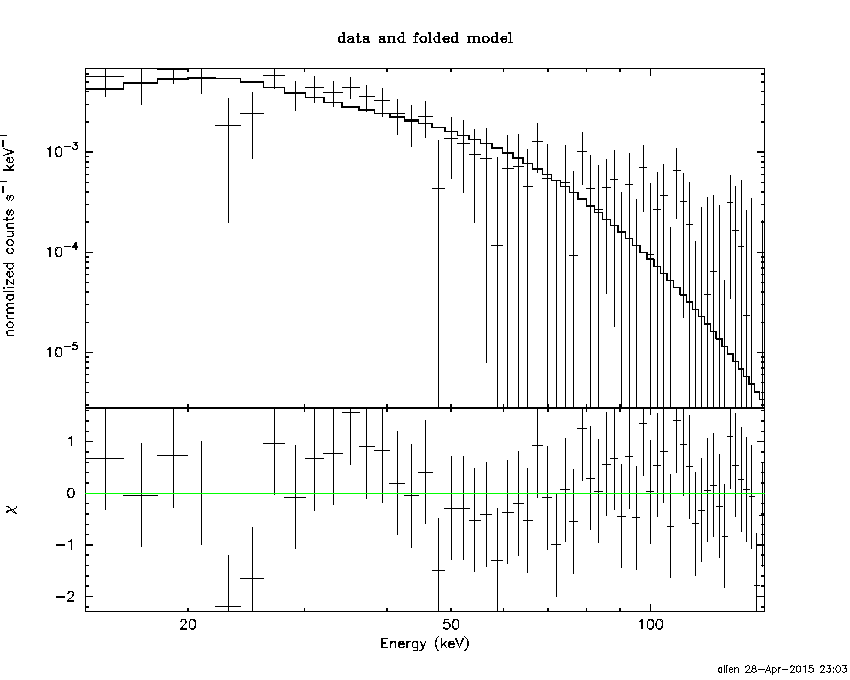
Time averaged spectrum fit using the average DRM
Power-law model

Time interval is from -134.092 sec. to   27.772 sec.

Spectral model in power-law:
------------------------------------------------------------
Parameters  : value       lower 90%   higher 90%
Photon index: 1.93441     ( -0.170734   0.178265 )
Norm@50keV  : 8.95013E-04    ( -0.000103162   0.000101053 )
------------------------------------------------------------
#Fit statistic : Chi-Squared =          43.32 using 59 PHA bins.
# Reduced chi-squared =         0.7599 for     57 degrees of freedom
# Null hypothesis probability =   9.094769e-01

Photon flux (15-150 keV)    in 161.9 sec: 0.130361 ( -0.0120901  0.0120933 ) ph/cm2/s
Energy fluence (15-150 keV)             : 1.33293e-06 ( -1.47429e-07  1.50016e-07 ) ergs/cm2
Cutoff power-law model

Time interval is from -134.092 sec. to   27.772 sec.
Spectral model in the cutoff power-law:
------------------------------------------------------------
Parameters  : value       lower 90%   higher 90%
Photon index: 1.62412     ( -0.736159   0.572953 )
Epeak [keV] : 51.4015      ( -45.2308 -51.4015 )
Norm@50keV  : 1.34851E-03    ( -0.000706353   0.00220515 )
------------------------------------------------------------
#Fit statistic : Chi-Squared =          42.63 using 59 PHA bins.
# Reduced chi-squared =         0.7613 for     56 degrees of freedom
# Null hypothesis probability =   9.059604e-01

Photon flux (15-150 keV)    in 161.9 sec: 0.128784 ( -0.012493  0.012486 ) ph/cm2/s
Energy fluence (15-150 keV)             : 1.28988e-06 ( -1.70084e-07  1.73165e-07 ) ergs/cm2
Band function

Time interval is from -134.092 sec. to   27.772 sec.

Spectral model in the Band function:
------------------------------------------------------------
Parameters  : value       lower 90%   higher 90%
alpha       : -1.64619   ( 1.64629   0.635129 )
beta        : -4.54514    ( 9.00489   19.0049 )
Epeak [keV] : 52.7427      ( -22.0538 168.973 )
Norm@50keV   : 1.30542E-03    ( -0.000120351   0.000280492 )
------------------------------------------------------------
#Fit statistic : Chi-Squared =          42.64 using 59 PHA bins.
# Reduced chi-squared =         0.7752 for     55 degrees of freedom
# Null hypothesis probability =   8.880346e-01

Photon flux (15-150 keV)    in 161.9 sec:  (    ) ph/cm2/s
Energy fluence (15-150 keV)             : 1.29804e-06 ( -1.29691e-06  -1.51299e-07 ) ergs/cm2
Single BB

Spectral model blackbody:
------------------------------------------------------------
Parameters  : value    Lower 90%  Upper 90%
kT [keV]    : 9.91502  (-1.15687  1.33453)
R^2/D10^2   : 6.18738E-02  (-0.023569   0.0377024)
(R is the radius in km and D10 is the distance to the source in units of 10 kpc)
------------------------------------------------------------
#Fit statistic : Chi-Squared =          70.41 using 59 PHA bins.
# Reduced chi-squared =          1.235 for     57 degrees of freedom
# Null hypothesis probability =   1.092097e-01

Energy  Fluence     90% Error
[keV]   [erg/cm2]   [erg/cm2]
15- 25  2.000e-07   3.223e-08
25- 50  4.912e-07   5.602e-08
50-150  2.501e-07   5.950e-08
15-150  9.413e-07   1.152e-07
Thermal bremsstrahlung (OTTB)
Spectral model: thermal bremsstrahlung
------------------------------------------------------------
Parameters  : value         Lower 90%    Upper 90%
kT [keV]    : 74.8173       (-19.9821      33.1085)
Norm        : 0.624489       (-0.0877375     0.107039)
------------------------------------------------------------
#Fit statistic : Chi-Squared =          43.15 using 59 PHA bins.
# Reduced chi-squared =         0.7571 for     57 degrees of freedom
# Null hypothesis probability =   9.124572e-01

Energy  Fluence     90% Error
[keV]   [erg/cm2]   [erg/cm2]
15- 25  2.610e-07   3.359e-08
25- 50  4.226e-07   4.015e-08
50-150  5.697e-07   1.497e-07
15-150  1.253e-06   1.788e-07
Double BB

Spectral model: bbodyrad<1> + bbodyrad<2>
------------------------------------------------------------
Parameters  : value         Lower 90%    Upper 90%
kT1 [keV]   : 5.96500        (-1.30513      1.45468)
R1^2/D10^2  : 0.319821        (-0.171998      0.271745)
kT2 [keV]   : 21.9546        (-5.89125      12.1833)
R2^2/D10^2  : 2.16435E-03    (-0.0017158   0.00303864)
------------------------------------------------------------
#Fit statistic : Chi-Squared =          41.00 using 59 PHA bins.
# Reduced chi-squared =         0.7455 for     55 degrees of freedom
# Null hypothesis probability =   9.196995e-01

Energy  Fluence     90% Error
[keV]   [erg/cm2]   [erg/cm2]
15- 25  2.740e-07   1.053e-07
25- 50  4.042e-07   1.129e-07
50-150  6.164e-07   3.308e-07
15-150  1.295e-06   4.808e-07
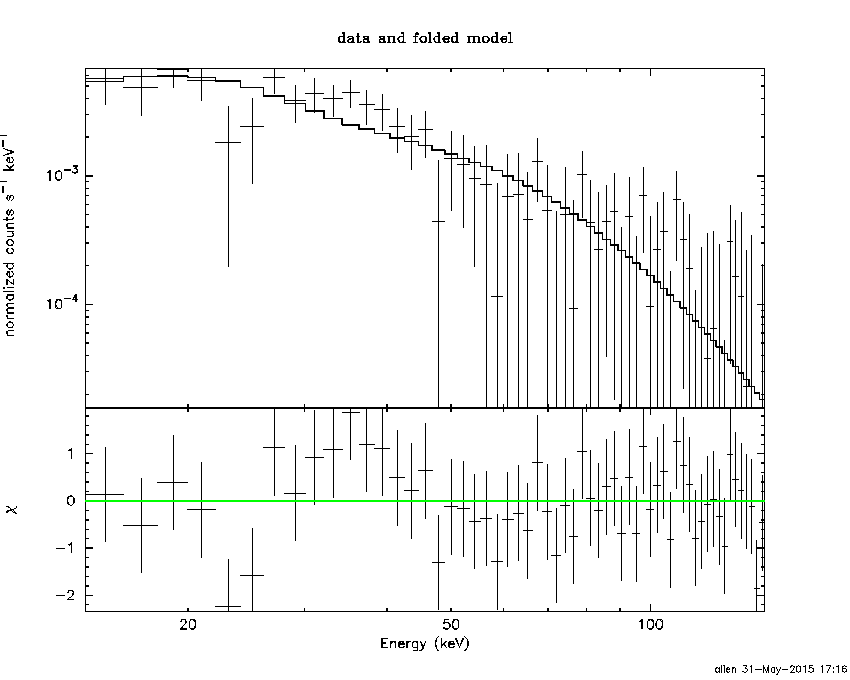
Peak spectrum fit
Power-law model

Time interval is from    0.648 sec. to    1.648 sec.

Spectral model in power-law:
------------------------------------------------------------
Parameters  : value       lower 90%   higher 90%
Photon index: 2.01377     ( -0.233161   0.250796 )
Norm@50keV  : 9.63875E-03    ( -0.00165251   0.00161208 )
------------------------------------------------------------
#Fit statistic : Chi-Squared =          43.19 using 59 PHA bins.
# Reduced chi-squared =         0.7577 for     57 degrees of freedom
# Null hypothesis probability =   9.117897e-01

Photon flux (15-150 keV)    in 1 sec: 1.45506 ( -0.200839  0.200892 ) ph/cm2/s
Energy fluence (15-150 keV)             : 8.89579e-08 ( -1.41894e-08  1.44878e-08 ) ergs/cm2
Cutoff power-law model
Time interval is from    0.648 sec. to    1.648 sec.
Spectral model in the cutoff power-law:
------------------------------------------------------------
Parameters  : value       lower 90%   higher 90%
Photon index: 0.107727     ( -2.71378   1.4775 )
Epeak [keV] : 40.0126      ( -8.6513 12.3709 )
Norm@50keV  : 0.126398    ( -0.128523   5.61912 )
------------------------------------------------------------
#Fit statistic : Chi-Squared =          37.68 using 59 PHA bins.
# Reduced chi-squared =         0.6728 for     56 degrees of freedom
# Null hypothesis probability =   9.714293e-01

Photon flux (15-150 keV)    in 1 sec: 1.38043 ( -0.2137  0.21048 ) ph/cm2/s
Energy fluence (15-150 keV)             : 7.71911e-08 ( -1.49249e-08  1.6601e-08 ) ergs/cm2
Band function

Time interval is from    0.648 sec. to    1.648 sec.

Spectral model in the Band function:
------------------------------------------------------------
Parameters  : value       lower 90%   higher 90%
alpha       : 1.63098   ( -3.45286   -2.41301 )
beta        : -3.01654    ( -6.60683   0.734002 )
Epeak [keV] : 36.1674      ( -5.19116 10.4961 )
Norm@50keV   : 1.65930    ( -1.58755   100.776 )
------------------------------------------------------------
#Fit statistic : Chi-Squared =          35.70 using 59 PHA bins.
# Reduced chi-squared =         0.6491 for     55 degrees of freedom
# Null hypothesis probability =   9.797363e-01

Photon flux (15-150 keV)    in 1 sec:  (    ) ph/cm2/s
Energy fluence (15-150 keV)             : 8.04642e-08 ( 0  0 ) ergs/cm2
Single BB

Spectral model blackbody:
------------------------------------------------------------
Parameters  : value    Lower 90%  Upper 90%
kT [keV]    : 9.82563  (-1.21878  1.41588)
R^2/D10^2   : 0.767987  (-0.314149   0.510999)
(R is the radius in km and D10 is the distance to the source in units of 10 kpc)
------------------------------------------------------------
#Fit statistic : Chi-Squared =          39.01 using 59 PHA bins.
# Reduced chi-squared =         0.6845 for     57 degrees of freedom
# Null hypothesis probability =   9.670696e-01

Energy  Fluence     90% Error
[keV]   [erg/cm2]   [erg/cm2]
15- 25  1.501e-08   3.440e-09
25- 50  3.639e-08   5.950e-09
50-150  1.804e-08   6.205e-09
15-150  6.943e-08   1.274e-08
Thermal bremsstrahlung (OTTB)
Spectral model: thermal bremsstrahlung
------------------------------------------------------------
Parameters  : value         Lower 90%    Upper 90%
kT [keV]    : 62.5187       (-19.4435      34.262)
Norm        : 7.61373       (-1.52718     1.86788)
------------------------------------------------------------
#Fit statistic : Chi-Squared =          39.33 using 59 PHA bins.
# Reduced chi-squared =         0.6900 for     57 degrees of freedom
# Null hypothesis probability =   9.641616e-01

Energy  Fluence     90% Error
[keV]   [erg/cm2]   [erg/cm2]
15- 25  1.926e-08   3.470e-09
25- 50  2.967e-08   4.405e-09
50-150  3.492e-08   1.262e-08
15-150  8.385e-08   1.780e-08
Double BB
------------------------------------------------------------
Parameters  : value         Lower 90%    Upper 90%
kT1 [keV]   : 1.03045E-04        (      )
R1^2/D10^2  : 3.76637E+05        (-376636      -376636)
kT2 [keV]   : 9.82554        (-1.21869      1.41597)
R2^2/D10^2  : 0.768014    (-0.314177   0.510973)
------------------------------------------------------------
#Fit statistic : Chi-Squared =          39.09 using 59 PHA bins.
#Fit statistic : Chi-Squared =          39.01 using 59 PHA bins.
# Reduced chi-squared =         0.7107 for     55 degrees of freedom
# Reduced chi-squared =         0.7094 for     55 degrees of freedom
# Null hypothesis probability =   9.483900e-01
# Null hypothesis probability =   9.492902e-01

Energy  Fluence     90% Error
[keV]   [erg/cm2]   [erg/cm2]
15- 25  1.558e-08   3.960e-09
25- 50  3.627e-08   7.175e-09
50-150  1.659e-08   6.812e-09
15-150  6.844e-08   1.279e-08
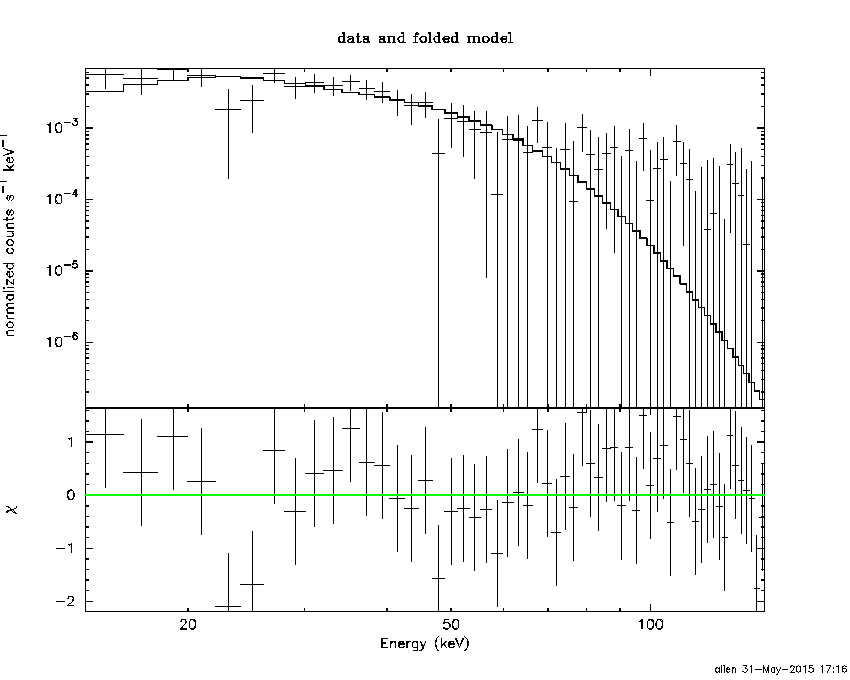
Pre-slew spectrum (Pre-slew PHA with pre-slew DRM)
Power-law model

Spectral model in power-law:
------------------------------------------------------------
Parameters  : value       lower 90%   higher 90%
Photon index: 1.91383     ( -0.320772   0.347151 )
Norm@50keV  : 7.54408E-04    ( -0.000171119   0.000164701 )
------------------------------------------------------------
#Fit statistic : Chi-Squared =          52.58 using 59 PHA bins.
# Reduced chi-squared =         0.9224 for     57 degrees of freedom
# Null hypothesis probability =   6.415593e-01

Photon flux (15-150 keV)    in 76.6 sec: 0.108907 ( -0.0197142  0.0197178 ) ph/cm2/s
Energy fluence (15-150 keV)             : 5.31369e-07 ( -1.14424e-07  1.18104e-07 ) ergs/cm2
Cutoff power-law model
Spectral model in the cutoff power-law:
------------------------------------------------------------
Parameters  : value       lower 90%   higher 90%
Photon index: 1.66093     ( -1.70974   0.528793 )
Epeak [keV] : 55.0298      (   )
Norm@50keV  : 1.06438E-03    (     )
------------------------------------------------------------
#Fit statistic : Chi-Squared =          52.47 using 59 PHA bins.
# Reduced chi-squared =         0.9369 for     56 degrees of freedom
# Null hypothesis probability =   6.094161e-01

Photon flux (15-150 keV)    in 76.6 sec: 0.108090 ( -0.0201858  0.020064 ) ph/cm2/s
Energy fluence (15-150 keV)             : 5.16637e-07 ( -1.36114e-07  1.30078e-07 ) ergs/cm2
Band function

Spectral model in the Band function:
------------------------------------------------------------
Parameters  : value       lower 90%   higher 90%
alpha       : 4.96208   ( -4.96208   -4.96208 )
beta        : -2.15830    ( -0.590675   0.415868 )
Epeak [keV] : 23.7096      ( -23.7096 5.18639 )
Norm@50keV   : 160.586    ( -28.5788   764887 )
------------------------------------------------------------
#Fit statistic : Chi-Squared =          50.06 using 59 PHA bins.
# Reduced chi-squared =         0.9101 for     55 degrees of freedom
# Null hypothesis probability =   6.635484e-01

Photon flux (15-150 keV)    in 76.6 sec:  (    ) ph/cm2/s
Energy fluence (15-150 keV)             : 0 ( 0  0 ) ergs/cm2
S(25-50 keV) vs. S(50-100 keV) plot
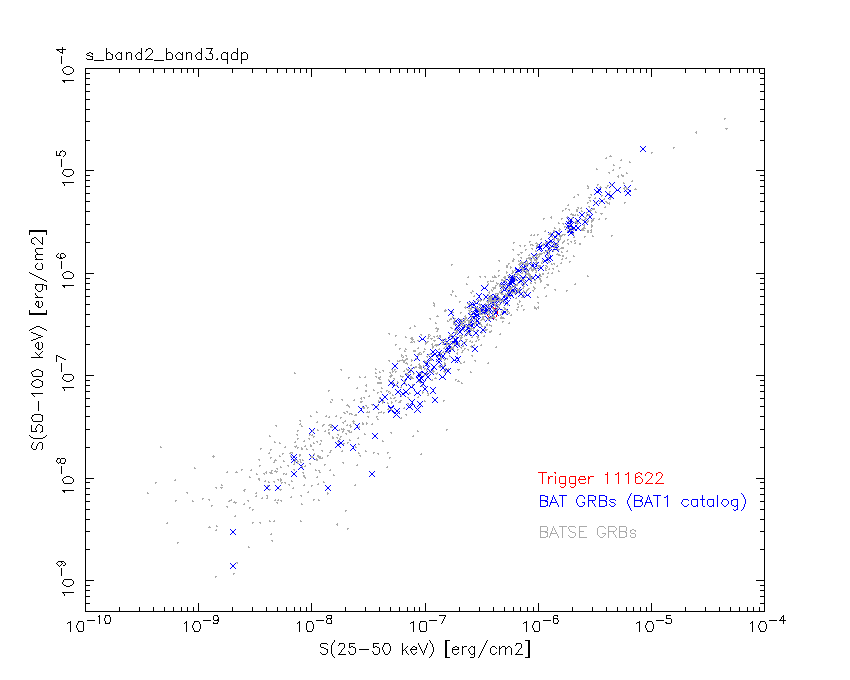
S(25-50 keV)  = 3.93e-07
S(50-100 keV) = 4.12e-07
T90 vs. Hardness ratio plot

T90                                   = 151.584000006318 sec.
Hardness ratio (energy fluence ratio) = 1.04835
Color vs. Color plot
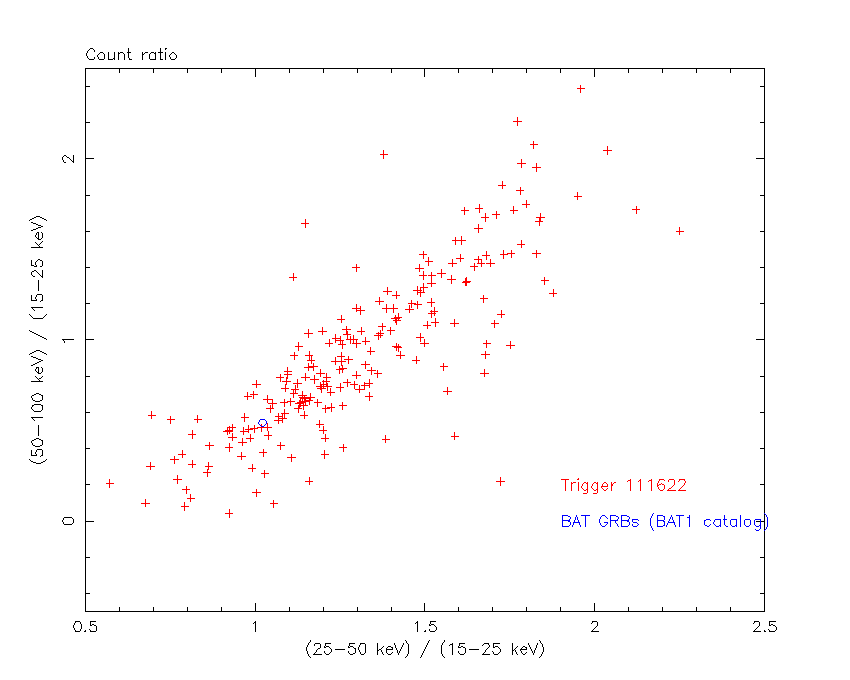
Count Ratio  (25-50 keV) / (15-25 keV) = 1.02164
Count Ratio (50-100 keV) / (15-25 keV) = 0.542348
Mask shadow pattern
IMX = -7.011950019389600E-01, IMY = -2.822039830821212E-01
TIME vs. PHA plot around the trigger time

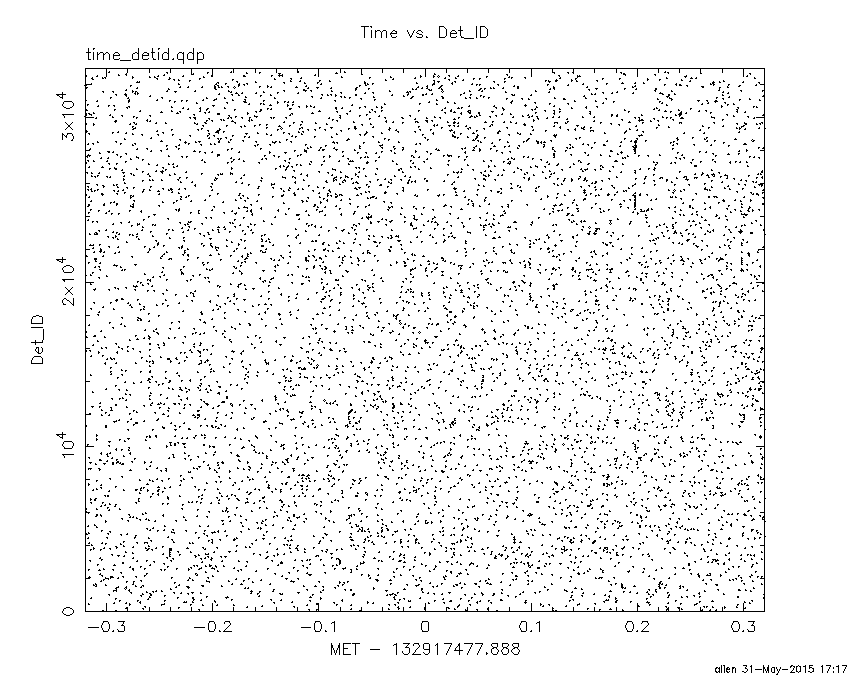
TIME vs. DetID plot around the trigger time
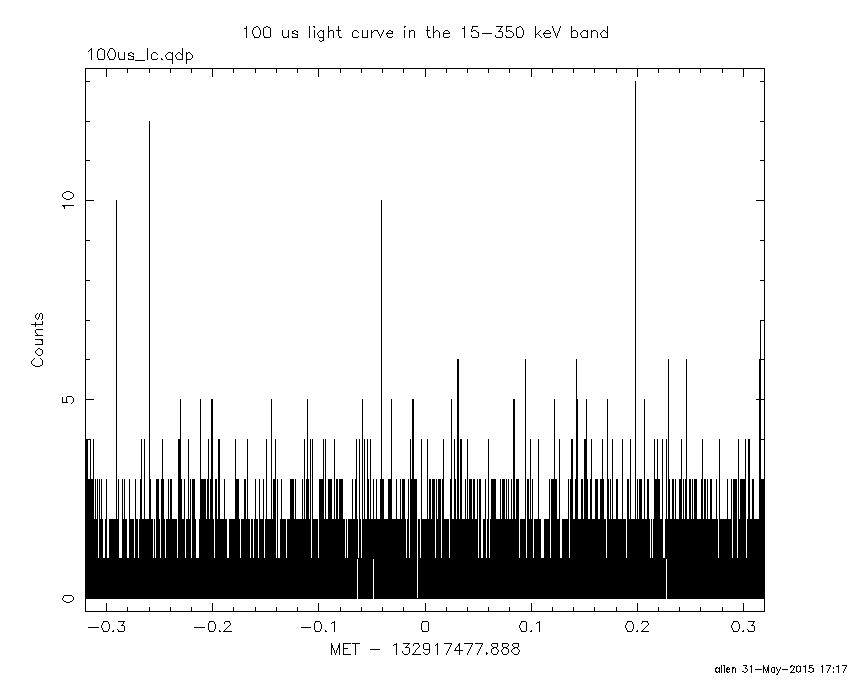
100 us light curve (15-350 keV)
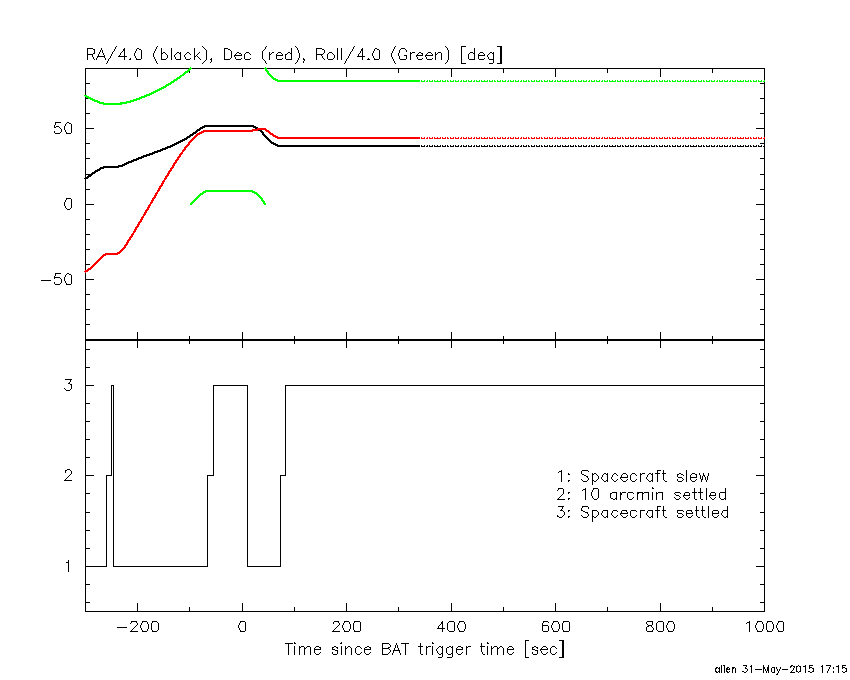
Spacecraft aspect plot
Bright source in the pre-burst/pre-slew/post-slew images
Pre-burst image of 15-350 keV band
Time interval of the image:
Pre-slew background subtracted image of 15-350 keV band
Time interval of the image:
-66.187400 10.412590

# RAcent  DECcent POSerr Theta    Phi  PeakCts   SNR AngSep     Name
#  [deg]    [deg]    ['] [deg]  [deg]                   [']
254.4622  35.2013    7.3  36.2  -30.8   0.1558   1.6    8.5	Her X-1
136.5976  34.8508    2.6  53.2  158.3   1.6849   4.4 ------	UNKNOWN
154.1718  43.5797    1.4  37.1  158.1   0.9719   8.2 ------	UNKNOWN
Post-slew image of 15-350 keV band
Time interval of the image:
73.212590 302.190600

# RAcent  DECcent POSerr Theta    Phi  PeakCts   SNR AngSep     Name
#  [deg]    [deg]    ['] [deg]  [deg]                   [']
129.7299   4.2509    2.2  44.9  159.9   1.6121   5.2 ------	UNKNOWN
147.5580  60.8374    2.3  17.7  -66.4   0.7077   5.0 ------	UNKNOWN
260.7839  68.6823    2.5  55.5  -30.8   3.4357   4.7 ------	UNKNOWN
 90.6534  23.6796    3.3  55.0 -145.2   3.1230   3.5 ------	UNKNOWN
 89.6736  70.2115    2.9  41.0  -83.6   2.5209   4.0 ------	UNKNOWN
Plot creation:
Sun May 31 17:17:33 EDT 2015