Estimated redshift from machine learning (Ukwatta et al. 2016) - may take a few minute to calcaulte
Image
Pre-slew 15.0-350.0 keV image (Event data)

#   RAcent    DECcent   POSerr    Theta     Phi              Peak Cts       SNR   Name
   47.0831   -19.3188   0.0086    19.4986    32.0722         3.8084303     22.326 TRIG_01116221

Foreground time interval of the image:
-47.800   9.853 (delta_t =  57.653 [sec])
Background time interval of the image:
-179.048 -47.800 (delta_t = 131.248 [sec])
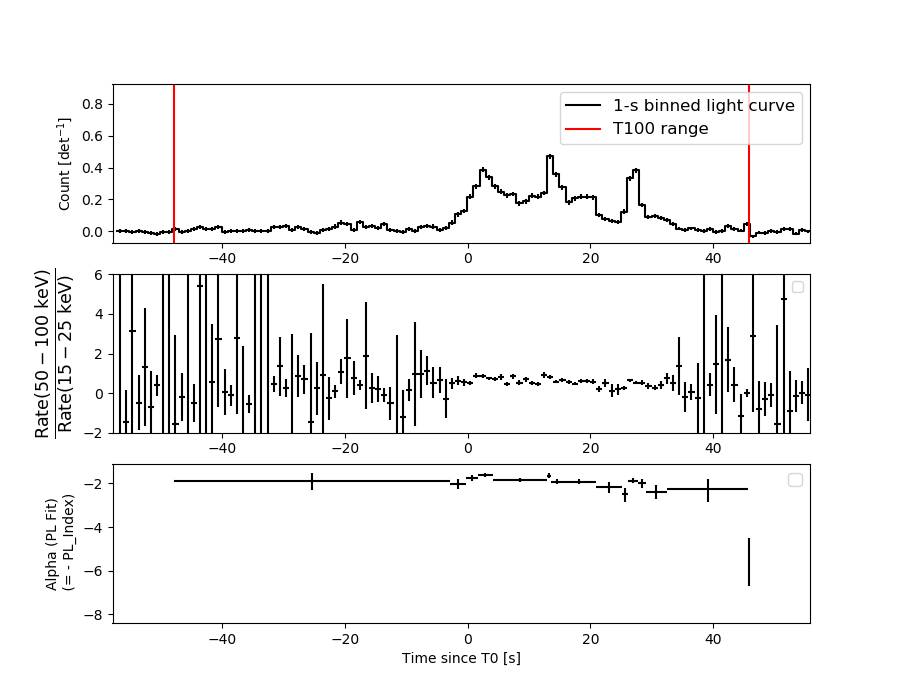
Lightcurves
Notes:
- 1) The mask-weighted light curves are using the flight position.
- 2) Multiple plots of different time binning/intervals are shown to cover all scenarios of short/long GRBs, rate/image triggers, and real/false positives.
- 3) For all the mask-weighted lightcurves, the y-axis units are counts/sec/det where a det is 0.4 x 0.4 = 0.16 sq cm.
- 4) The verticle lines correspond to following: green dotted lines are T50 interval, black dotted lines are T90 interval, blue solid line(s) is a spacecraft slew start time, and orange solid line(s) is a spacecraft slew end time.
- 5) Time of each bin is in the middle of the bin.
1 s binning
From T0-310 s to T0+310 s
From T100_start - 20 s to T100_end + 30 s

Full time interval

64 ms binning
Full time interval
From T100_start to T100_end

From T0-5 sec to T0+5 sec
16 ms binning
From T100_start-5 s to T100_start+5 s
8 ms binning
From T100_start-3 s to T100_start+3 s

2 ms binning
From T100_start-1 s to T100_start+1 s
SN=5 or 10 sec. binning (whichever binning is satisfied first)

SN=5 or 10 sec. binning (T < 200 sec)

Quad-rate summed light curves (from T0-300s to T0+1000s)

Spectral Evolution
Spectra
Notes:
- 1) The fitting includes the systematic errors.
- 2) When the burst includes telescope slew time periods, the fitting uses an average response file made from multiple 5-s response files through out the slew time plus single time preiod for the non-slew times, and weighted by the total counts in the corresponding time period using addrmf. An average response file is needed becuase a spectral fit using the pre-slew DRM will introduce some errors in both a spectral shape and a normalization if the PHA file contains a lot of the slew/post-slew time interval.
- 3) For fits to more complicated models (e.g. a power-law over a cutoff power-law), the BAT team has decided to require a chi-square improvement of more than 6 for each extra dof.
Time averaged spectrum fit using the average DRM
Power-law model

Time interval is from  -47.800 sec. to   45.748 sec.

Spectral model in power-law:
------------------------------------------------------------
Parameters  : value       lower 90%   higher 90%
Photon index: 1.90924     ( -0.0654537   0.0660206 )
Norm@50keV  : 5.18304E-03    ( -0.000172178   0.000171299 )
------------------------------------------------------------
#Fit statistic  : Chi-Squared                   45.50     using 59 bins.
 Reduced chi-squared = 0.798246
# Null hypothesis probability of 8.63e-01 with 57 degrees of freedom

Photon flux (15-150 keV)    in 93.55 sec: 0.746802 ( -0.024864  0.02498 ) ph/cm2/s
Energy fluence (15-150 keV)             : 4.45896e-06 ( -1.45915e-07  1.46511e-07 ) ergs/cm2
Cutoff power-law model

Time interval is from  -47.800 sec. to   45.748 sec.
Spectral model in the cutoff power-law:
------------------------------------------------------------
Parameters  : value       lower 90%   higher 90%
Photon index: 1.90907     ( -0.0659907   0.0660937 )
Epeak [keV] : 9999.28      ( -9999.35 -9999.36 )
Norm@50keV  : 5.18578E-03    ( -0.00142886   0.00110149 )
------------------------------------------------------------
#Fit statistic  : Chi-Squared                   45.51     using 59 bins.
 Reduced chi-squared = 0.812679
# Null hypothesis probability of 8.41e-01 with 56 degrees of freedom

Photon flux (15-150 keV)    in 93.55 sec: 0.751730 ( -0.029813  0.020048 ) ph/cm2/s
Energy fluence (15-150 keV)             : 4.49369e-06 ( -1.91362e-07  1.07536e-07 ) ergs/cm2
Band function

Time interval is from  -47.800 sec. to   45.748 sec.


Spectral model in the Band function:
------------------------------------------------------------
Parameters  : value       lower 90%   higher 90%
alpha       :    (     )
beta        :     (     )
Epeak [keV] :       (   )
Norm@50keV   :     (     )
------------------------------------------------------------

Photon flux (15-150 keV)    in  sec:  (    ) ph/cm2/s
Energy fluence (15-150 keV)             : 0 ( 0  0 ) ergs/cm2
Single BB

Spectral model blackbody:
------------------------------------------------------------
Parameters  : value    Lower 90%  Upper 90%
kT [keV]    : 11.8391  (  )
R^2/D10^2   : 0.168185  (   )
(R is the radius in km and D10 is the distance to the source in units of 10 kpc)
------------------------------------------------------------
#Fit statistic  : Chi-Squared                  319.50     using 59 bins.
 Reduced chi-squared =
# Null hypothesis probability of 3.46e-38 with 57 degrees of freedom

Energy  Fluence     90% Error
[keV]   [erg/cm2]   [erg/cm2]
15- 25  4.659e-07   2.849e-08
25- 50  1.443e-06   5.426e-08
50-150  1.205e-06   9.542e-08
15-150  3.114e-06   1.076e-07
Thermal bremsstrahlung (OTTB)

Spectral model: thermal bremsstrahlung
------------------------------------------------------------
Parameters  : value         Lower 90%    Upper 90%
kT [keV]    : 90.8143       (-10.7687      13.2651)
Norm        : 3.24844       (-0.169686     0.187603)
------------------------------------------------------------
#Fit statistic  : Chi-Squared                   64.96     using 59 bins.
 Reduced chi-squared =
# Null hypothesis probability of 2.19e-01 with 57 degrees of freedom

Energy  Fluence     90% Error
[keV]   [erg/cm2]   [erg/cm2]
15- 25  7.931e-07   4.626e-08
25- 50  1.344e-06   4.818e-08
50-150  2.058e-06   4.696e-07
15-150  4.195e-06   4.635e-07
Double BB

Spectral model: bbodyrad<1> + bbodyrad<2>
------------------------------------------------------------
Parameters  : value         Lower 90%    Upper 90%
kT1 [keV]   : 6.36379        (-0.530142      0.557338)
R1^2/D10^2  : 1.37717        (-0.377536      0.562823)
kT2 [keV]   : 25.1342        (-2.79057      3.63362)
R2^2/D10^2  : 7.97957E-03    (-0.00301172   0.00430892)
------------------------------------------------------------
#Fit statistic  : Chi-Squared                   42.88     using 59 bins.
 Reduced chi-squared =
# Null hypothesis probability of 8.83e-01 with 55 degrees of freedom

Energy  Fluence     90% Error
[keV]   [erg/cm2]   [erg/cm2]
15- 25  8.325e-07   7.919e-08
25- 50  1.314e-06   8.326e-08
50-150  2.274e-06   2.746e-07
15-150  4.420e-06   3.433e-07
Peak spectrum fit
Power-law model

Time interval is from   12.892 sec. to   13.892 sec.

Spectral model in power-law:
------------------------------------------------------------
Parameters  : value       lower 90%   higher 90%
Photon index: 1.64781     ( -0.11165   0.113563 )
Norm@50keV  : 2.94449E-02    ( -0.00196958   0.00195286 )
------------------------------------------------------------
#Fit statistic  : Chi-Squared                   40.80     using 59 bins.
 Reduced chi-squared = 0.715789
# Null hypothesis probability of 9.48e-01 with 57 degrees of freedom

Photon flux (15-150 keV)    in 1 sec: 3.84215 ( -0.23894  0.2391 ) ph/cm2/s
Energy fluence (15-150 keV)             : 2.73949e-07 ( -1.95649e-08  1.97483e-08 ) ergs/cm2
Cutoff power-law model

Time interval is from   12.892 sec. to   13.892 sec.
Spectral model in the cutoff power-law:
------------------------------------------------------------
Parameters  : value       lower 90%   higher 90%
Photon index: 1.44887     ( -0.462165   0.292979 )
Epeak [keV] : 131.456      ( -62.4369 -131.458 )
Norm@50keV  : 3.75032E-02    ( -0.00973007   0.0276511 )
------------------------------------------------------------
#Fit statistic  : Chi-Squared                   40.16     using 59 bins.
 Reduced chi-squared = 0.717143
# Null hypothesis probability of 9.45e-01 with 56 degrees of freedom

Photon flux (15-150 keV)    in 1 sec: 3.80617 ( -0.25068  0.25043 ) ph/cm2/s
Energy fluence (15-150 keV)             : 2.68955e-07 ( -2.23738e-08  2.21971e-08 ) ergs/cm2
Band function

Time interval is from   12.892 sec. to   13.892 sec.


Spectral model in the Band function:
------------------------------------------------------------
Parameters  : value       lower 90%   higher 90%
alpha       :    (     )
beta        :     (     )
Epeak [keV] :       (   )
Norm@50keV   :     (     )
------------------------------------------------------------

Photon flux (15-150 keV)    in  sec:  (    ) ph/cm2/s
Energy fluence (15-150 keV)             : 0 ( 0  0 ) ergs/cm2
Single BB

Spectral model blackbody:
------------------------------------------------------------
Parameters  : value    Lower 90%  Upper 90%
kT [keV]    : 12.5735  (-0.974992  1.08352)
R^2/D10^2   : 0.783622  (-0.202795   0.267227)
(R is the radius in km and D10 is the distance to the source in units of 10 kpc)
------------------------------------------------------------
#Fit statistic  : Chi-Squared                  100.19     using 59 bins.
 Reduced chi-squared =
# Null hypothesis probability of 3.60e-04 with 57 degrees of freedom

Energy  Fluence     90% Error
[keV]   [erg/cm2]   [erg/cm2]
15- 25  2.627e-08   2.940e-09
25- 50  8.722e-08   6.130e-09
50-150  8.544e-08   1.223e-08
15-150  1.989e-07   1.545e-08
Thermal bremsstrahlung (OTTB)

Spectral model: thermal bremsstrahlung
------------------------------------------------------------
Parameters  : value         Lower 90%    Upper 90%
kT [keV]    : 152.561       (-40.8096      -152.179)
Norm        : 15.8156       (-1.09711     1.27993)
------------------------------------------------------------
#Fit statistic  : Chi-Squared                   40.52     using 59 bins.
 Reduced chi-squared =
# Null hypothesis probability of 9.52e-01 with 57 degrees of freedom

Energy  Fluence     90% Error
[keV]   [erg/cm2]   [erg/cm2]
15- 25  4.056e-08   3.585e-09
25- 50  7.537e-08   1.024e-08
50-150  1.498e-07   5.952e-08
15-150  2.657e-07   6.185e-08
Double BB

Spectral model: bbodyrad<1> + bbodyrad<2>
------------------------------------------------------------
Parameters  : value         Lower 90%    Upper 90%
kT1 [keV]   : 7.58766        (-1.30152      1.3315)
R1^2/D10^2  : 3.48727        (-1.40539      2.98335)
kT2 [keV]   : 29.7359        (-7.02021      13.9471)
R2^2/D10^2  : 2.66163E-02    (-0.0187137   0.0437461)
------------------------------------------------------------
#Fit statistic  : Chi-Squared                   40.03     using 59 bins.
 Reduced chi-squared =
# Null hypothesis probability of 9.35e-01 with 55 degrees of freedom

Energy  Fluence     90% Error
[keV]   [erg/cm2]   [erg/cm2]
15- 25  3.851e-08   8.665e-09
25- 50  7.820e-08   1.448e-08
50-150  1.548e-07   6.634e-08
15-150  2.715e-07   8.155e-08
Pre-slew spectrum (Pre-slew PHA with pre-slew DRM)
Power-law model

Spectral model in power-law:
------------------------------------------------------------
Parameters  : value       lower 90%   higher 90%
Photon index: 1.78520     ( -0.0979626   0.0993571 )
Norm@50keV  : 3.73653E-03    ( -0.000203904   0.000201953 )
------------------------------------------------------------
#Fit statistic  : Chi-Squared                   58.38     using 59 bins.
 Reduced chi-squared =
# Null hypothesis probability of 4.24e-01 with 57 degrees of freedom

Photon flux (15-150 keV)    in 57.65 sec: 0.511962 ( -0.0252754  0.0253367 ) ph/cm2/s
Energy fluence (15-150 keV)             : 1.98421e-06 ( -1.11236e-07  1.12364e-07 ) ergs/cm2
Cutoff power-law model

Spectral model in the cutoff power-law:
------------------------------------------------------------
Parameters  : value       lower 90%   higher 90%
Photon index: 1.78356     ( -0.146263   0.100651 )
Epeak [keV] : 9998.84      ( -9999.34 -9999.35 )
Norm@50keV  : 3.74137E-03    ( -0.000205583   0.00147787 )
------------------------------------------------------------
#Fit statistic  : Chi-Squared                   58.39     using 59 bins.
 Reduced chi-squared =
# Null hypothesis probability of 3.88e-01 with 56 degrees of freedom

Photon flux (15-150 keV)    in 57.65 sec: 0.511744 ( -0.025222  0.025271 ) ph/cm2/s
Energy fluence (15-150 keV)             : 1.9833e-06 ( -1.19687e-07  1.10803e-07 ) ergs/cm2
Band function

Spectral model in the Band function:
------------------------------------------------------------
Parameters  : value       lower 90%   higher 90%
alpha       :    (     )
beta        :     (     )
Epeak [keV] :       (   )
Norm@50keV   :     (     )
------------------------------------------------------------

Photon flux (15-150 keV)    in  sec:  (    ) ph/cm2/s
Energy fluence (15-150 keV)             : 0 ( 0  0 ) ergs/cm2
S(25-50 keV) vs. S(50-100 keV) plot

S(25-50 keV)  = 1.30e-06
S(50-100 keV) = 1.39e-06
T90 vs. Hardness ratio plot

T90                                   = 49.039999961853 sec.
Hardness ratio (energy fluence ratio) = 1.06923
Color vs. Color plot

Count Ratio  (25-50 keV) / (15-25 keV) = 1.07935
Count Ratio (50-100 keV) / (15-25 keV) = 0.608101
Mask shadow pattern

IMX = 3.000499177724512E-01, IMY = -1.880177922912658E-01
TIME vs. PHA plot around the trigger time

TIME vs. DetID plot around the trigger time

100 us light curve (15-350 keV)

Spacecraft aspect plot

Bright source in the pre-burst/pre-slew/post-slew images
Pre-burst image of 15-350 keV band
Time interval of the image:
-179.048000 -47.800000

# RAcent  DECcent POSerr Theta    Phi  PeakCts   SNR AngSep     Name
#  [deg]    [deg]    ['] [deg]  [deg]                   [']
 83.6967  21.9831    6.1  39.5 -102.2   2.5538   1.9    4.0	Crab
 72.4191 -27.8842    3.6  35.2  -12.0   1.5638   3.2 ------	UNKNOWN
 58.9584  34.8267    2.1  35.9 -143.5   3.0515   5.5 ------	UNKNOWN
 85.2533 -19.6583    3.1  39.7  -34.4   2.4389   3.8 ------	UNKNOWN
Pre-slew background subtracted image of 15-350 keV band
Time interval of the image:
-47.800000 9.852600

# RAcent  DECcent POSerr Theta    Phi  PeakCts   SNR AngSep     Name
#  [deg]    [deg]    ['] [deg]  [deg]                   [']
 83.6656  21.9975    3.6  39.5 -102.3   1.7127   3.3    2.1	Crab
 10.9775  25.2815    3.3  45.4  150.7   1.6612   3.6 ------	UNKNOWN
 25.5824  24.3932    2.7  34.0  161.5   0.9060   4.2 ------	UNKNOWN
 47.0831 -19.3189    0.5  19.5   32.1   3.8083  22.3 ------	UNKNOWN
 92.9719   0.5780    2.5  43.0  -67.0   3.2141   4.7 ------	UNKNOWN
Post-slew image of 15-350 keV band
Time interval of the image:
64.052590 178.652590

# RAcent  DECcent POSerr Theta    Phi  PeakCts   SNR AngSep     Name
#  [deg]    [deg]    ['] [deg]  [deg]                   [']
  7.8703  -6.0722    3.2  40.4  132.8   2.3631   3.7  595.7	UNKNOWN
  9.5149   8.4101    2.9  46.3  152.4   2.7262   3.9 ------	UNKNOWN
 35.8127 -53.0843    2.3  34.9   40.8   1.7661   5.1 ------	UNKNOWN
 52.1352 -47.1919    2.2  28.2   21.7   1.2019   5.2 ------	UNKNOWN
 25.6212  29.4226    2.9  53.0 -174.6   2.3236   3.9 ------	UNKNOWN
 78.2218 -43.1341    3.2  35.3  -11.8   0.9251   3.6 ------	UNKNOWN
Plot creation:
Mon Oct 24 12:40:37 EDT 2022