Estimated redshift from machine learning (Ukwatta et al. 2016) - may take a few minute to calcaulte
Image
Pre-slew 15.0-350.0 keV image (Event data)
#   RAcent    DECcent   POSerr    Theta     Phi              Peak Cts       SNR   Name
  254.8555   -33.5839   0.0069    12.4796    43.2906         1.4608527     27.740 TRIG_01116441

Foreground time interval of the image:
 -0.148  17.621 (delta_t =  17.769 [sec])
Background time interval of the image:
-239.680  -0.148 (delta_t = 239.532 [sec])
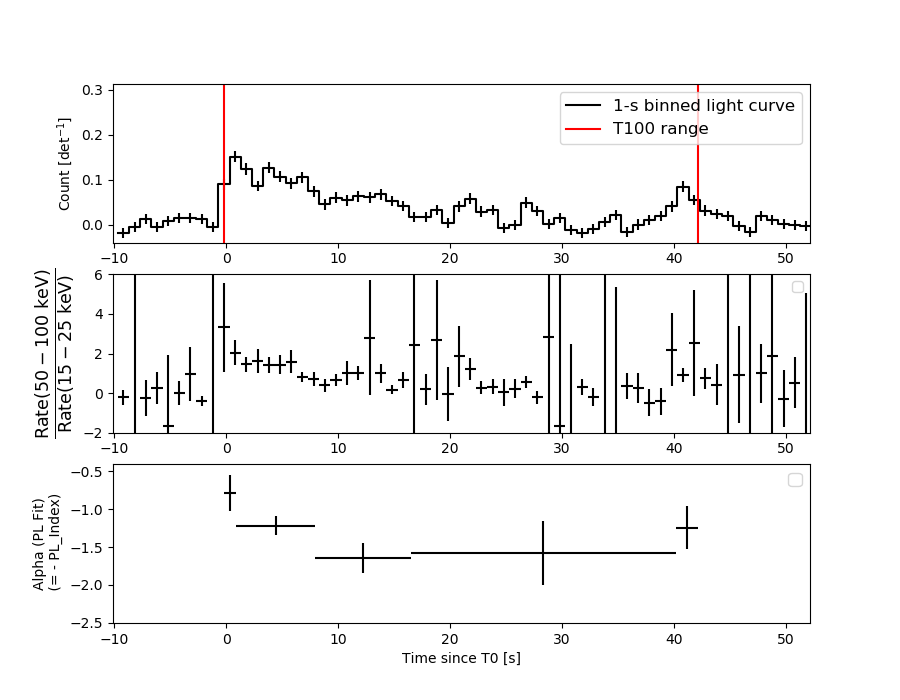
Lightcurves
Notes:
- 1) The mask-weighted light curves are using the flight position.
- 2) Multiple plots of different time binning/intervals are shown to cover all scenarios of short/long GRBs, rate/image triggers, and real/false positives.
- 3) For all the mask-weighted lightcurves, the y-axis units are counts/sec/det where a det is 0.4 x 0.4 = 0.16 sq cm.
- 4) The verticle lines correspond to following: green dotted lines are T50 interval, black dotted lines are T90 interval, blue solid line(s) is a spacecraft slew start time, and orange solid line(s) is a spacecraft slew end time.
- 5) Time of each bin is in the middle of the bin.
1 s binning
From T0-310 s to T0+310 s
From T100_start - 20 s to T100_end + 30 s
Full time interval
64 ms binning
Full time interval
From T100_start to T100_end
From T0-5 sec to T0+5 sec
16 ms binning
From T100_start-5 s to T100_start+5 s
Blue+Cyan dotted lines: Time interval of the scaled map
From 0.000000 to 1.024000
8 ms binning
From T100_start-3 s to T100_start+3 s
Blue+Cyan dotted lines: Time interval of the scaled map
From 0.000000 to 1.024000
2 ms binning
From T100_start-1 s to T100_start+1 s
Blue+Cyan dotted lines: Time interval of the scaled map
From 0.000000 to 1.024000
SN=5 or 10 sec. binning (whichever binning is satisfied first)
SN=5 or 10 sec. binning (T < 200 sec)
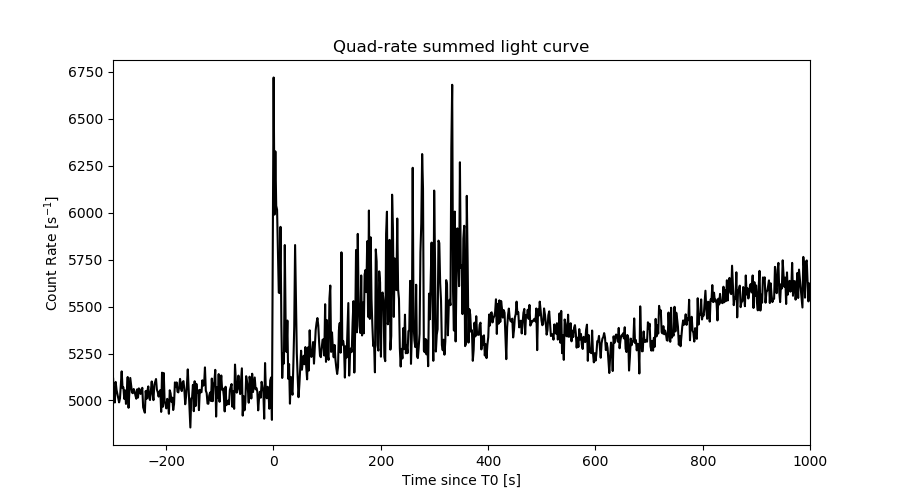
Quad-rate summed light curves (from T0-300s to T0+1000s)
Spectral Evolution
Spectra
Notes:
- 1) The fitting includes the systematic errors.
- 2) When the burst includes telescope slew time periods, the fitting uses an average response file made from multiple 5-s response files through out the slew time plus single time preiod for the non-slew times, and weighted by the total counts in the corresponding time period using addrmf. An average response file is needed becuase a spectral fit using the pre-slew DRM will introduce some errors in both a spectral shape and a normalization if the PHA file contains a lot of the slew/post-slew time interval.
- 3) For fits to more complicated models (e.g. a power-law over a cutoff power-law), the BAT team has decided to require a chi-square improvement of more than 6 for each extra dof.
Time averaged spectrum fit using the average DRM
Power-law model
Time interval is from   -0.148 sec. to   42.172 sec.

Spectral model in power-law:
------------------------------------------------------------
Parameters  : value       lower 90%   higher 90%
Photon index: 1.35819     ( -0.112874   0.112224 )
Norm@50keV  : 2.89411E-03    ( -0.000183883   0.000183725 )
------------------------------------------------------------
#Fit statistic  : Chi-Squared                   73.48     using 59 bins.
 Reduced chi-squared = 1.28912
# Null hypothesis probability of 6.99e-02 with 57 degrees of freedom

Photon flux (15-150 keV)    in 42.32 sec: 0.349258 ( -0.022958  0.023 ) ph/cm2/s
Energy fluence (15-150 keV)             : 1.19417e-06 ( -8.34203e-08  8.39629e-08 ) ergs/cm2
Cutoff power-law model
Time interval is from   -0.148 sec. to   42.172 sec.
Spectral model in the cutoff power-law:
------------------------------------------------------------
Parameters  : value       lower 90%   higher 90%
Photon index: 1.00543     ( -0.502506   0.399018 )
Epeak [keV] : 142.557      ( -56.5442 -142.59 )
Norm@50keV  : 4.34349E-03    ( -0.00154324   0.00328875 )
------------------------------------------------------------
#Fit statistic  : Chi-Squared                   71.69     using 59 bins.
 Reduced chi-squared = 1.28018
# Null hypothesis probability of 7.72e-02 with 56 degrees of freedom

Photon flux (15-150 keV)    in 42.32 sec: 0.343260 ( -0.024239  0.024207 ) ph/cm2/s
Energy fluence (15-150 keV)             : 1.15847e-06 ( -9.64202e-08  9.54071e-08 ) ergs/cm2
Band function

Time interval is from   -0.148 sec. to   42.172 sec.


Spectral model in the Band function:
------------------------------------------------------------
Parameters  : value       lower 90%   higher 90%
alpha       :    (     )
beta        :     (     )
Epeak [keV] :       (   )
Norm@50keV   :     (     )
------------------------------------------------------------

Photon flux (15-150 keV)    in  sec:  (    ) ph/cm2/s
Energy fluence (15-150 keV)             : 0 ( 0  0 ) ergs/cm2
Single BB
Spectral model blackbody:
------------------------------------------------------------
Parameters  : value    Lower 90%  Upper 90%
kT [keV]    : 15.8184  (-1.26888  1.4257)
R^2/D10^2   : 3.35343E-02  (-0.00870717   0.0114256)
(R is the radius in km and D10 is the distance to the source in units of 10 kpc)
------------------------------------------------------------
#Fit statistic  : Chi-Squared                  112.55     using 59 bins.
 Reduced chi-squared =
# Null hypothesis probability of 1.63e-05 with 57 degrees of freedom

Energy  Fluence     90% Error
[keV]   [erg/cm2]   [erg/cm2]
15- 25  7.361e-08   1.003e-08
25- 50  3.067e-07   2.516e-08
50-150  5.340e-07   5.861e-08
15-150  9.144e-07   7.512e-08
Thermal bremsstrahlung (OTTB)
Spectral model: thermal bremsstrahlung
------------------------------------------------------------
Parameters  : value         Lower 90%    Upper 90%
kT [keV]    : 200.000       (-21.3445      -200)
Norm        : 1.45116       (-0.0922283     0.0922283)
------------------------------------------------------------
#Fit statistic  : Chi-Squared                   79.47     using 59 bins.
 Reduced chi-squared =
# Null hypothesis probability of 2.62e-02 with 57 degrees of freedom

Energy  Fluence     90% Error
[keV]   [erg/cm2]   [erg/cm2]
15- 25  1.529e-07   1.208e-08
25- 50  2.942e-07   2.903e-08
50-150  6.451e-07   1.767e-07
15-150  1.092e-06   1.856e-07
Double BB

Spectral model: bbodyrad<1> + bbodyrad<2>
------------------------------------------------------------
Parameters  : value         Lower 90%    Upper 90%
kT1 [keV]   : 10.6564        (-2.03462      1.71314)
R1^2/D10^2  : 0.102613        (-0.0383943      0.0564768)
kT2 [keV]   : 61.4508        (-29.5872      -61.8129)
R2^2/D10^2  : 3.56210E-04    (-0.00029548   0.00186648)
------------------------------------------------------------
#Fit statistic  : Chi-Squared                   66.79     using 59 bins.
 Reduced chi-squared =
# Null hypothesis probability of 1.32e-01 with 55 degrees of freedom

Energy  Fluence     90% Error
[keV]   [erg/cm2]   [erg/cm2]
15- 25  1.076e-07   2.270e-08
25- 50  3.173e-07   6.409e-08
50-150  7.549e-07   3.433e-07
15-150  1.180e-06   4.075e-07
Peak spectrum fit
Power-law model
Time interval is from   -0.076 sec. to    0.924 sec.

Spectral model in power-law:
------------------------------------------------------------
Parameters  : value       lower 90%   higher 90%
Photon index: 0.784164     ( -0.247507   0.232793 )
Norm@50keV  : 1.13267E-02    ( -0.00143159   0.00139265 )
------------------------------------------------------------
#Fit statistic  : Chi-Squared                   51.01     using 59 bins.
 Reduced chi-squared = 0.894912
# Null hypothesis probability of 6.98e-01 with 57 degrees of freedom

Photon flux (15-150 keV)    in 1 sec: 1.30259 ( -0.15688  0.15738 ) ph/cm2/s
Energy fluence (15-150 keV)             : 1.33266e-07 ( -1.66414e-08  1.67128e-08 ) ergs/cm2
Cutoff power-law model

Time interval is from   -0.076 sec. to    0.924 sec.
Spectral model in the cutoff power-law:
------------------------------------------------------------
Parameters  : value       lower 90%   higher 90%
Photon index: 0.777649     ( -0.266654   0.219368 )
Epeak [keV] : 1.00000E+04      ( -10000 -10000 )
Norm@50keV  : 1.14089E-02    ( -0.00143673   0.00130069 )
------------------------------------------------------------
#Fit statistic  : Chi-Squared                   51.07     using 59 bins.
 Reduced chi-squared = 0.911964
# Null hypothesis probability of 6.61e-01 with 56 degrees of freedom

Photon flux (15-150 keV)    in 1 sec: 1.30244 ( -0.15717  0.15705 ) ph/cm2/s
Energy fluence (15-150 keV)             : 1.3314e-07 ( -1.65906e-08  1.6756e-08 ) ergs/cm2
Band function

Time interval is from   -0.076 sec. to    0.924 sec.


Spectral model in the Band function:
------------------------------------------------------------
Parameters  : value       lower 90%   higher 90%
alpha       :    (     )
beta        :     (     )
Epeak [keV] :       (   )
Norm@50keV   :     (     )
------------------------------------------------------------

Photon flux (15-150 keV)    in  sec:  (    ) ph/cm2/s
Energy fluence (15-150 keV)             : 0 ( 0  0 ) ergs/cm2
Single BB
Spectral model blackbody:
------------------------------------------------------------
Parameters  : value    Lower 90%  Upper 90%
kT [keV]    : 30.0292  (-6.00766  9.00526)
R^2/D10^2   : 1.87825E-02  (-0.0186524   0.0168325)
(R is the radius in km and D10 is the distance to the source in units of 10 kpc)
------------------------------------------------------------
#Fit statistic  : Chi-Squared                   72.77     using 59 bins.
 Reduced chi-squared =
# Null hypothesis probability of 7.77e-02 with 57 degrees of freedom

Energy  Fluence     90% Error
[keV]   [erg/cm2]   [erg/cm2]
15- 25  2.648e-09   7.280e-10
25- 50  1.634e-08   3.885e-09
50-150  1.041e-07   2.237e-08
15-150  1.231e-07   2.407e-08
Thermal bremsstrahlung (OTTB)
Spectral model: thermal bremsstrahlung
------------------------------------------------------------
Parameters  : value         Lower 90%    Upper 90%
kT [keV]    : 200.000       (-23.5682      -200)
Norm        : 5.24620       (-0.649586     0.649586)
------------------------------------------------------------
#Fit statistic  : Chi-Squared                   82.66     using 59 bins.
 Reduced chi-squared =
# Null hypothesis probability of 1.48e-02 with 57 degrees of freedom

Energy  Fluence     90% Error
[keV]   [erg/cm2]   [erg/cm2]
15- 25  1.307e-08   7.310e-09
25- 50  2.513e-08   1.385e-08
50-150  5.512e-08   3.019e-08
15-150  9.333e-08   5.155e-08
Double BB
Spectral model: bbodyrad<1> + bbodyrad<2>
------------------------------------------------------------
Parameters  : value         Lower 90%    Upper 90%
kT1 [keV]   : 9.49659        (-3.70413      4.8222)
R1^2/D10^2  : 0.414136        (-0.265259      1.79003)
kT2 [keV]   : 93.7553        (-52.4224      -94.3007)
R2^2/D10^2  : 1.17546E-03    (-0.0010044   0.00581585)
------------------------------------------------------------
#Fit statistic  : Chi-Squared                   47.91     using 59 bins.
 Reduced chi-squared =
# Null hypothesis probability of 7.40e-01 with 55 degrees of freedom

Energy  Fluence     90% Error
[keV]   [erg/cm2]   [erg/cm2]
15- 25  8.124e-09   4.588e-09
25- 50  2.254e-08   1.190e-08
50-150  1.093e-07   1.050e-07
15-150  1.399e-07   1.128e-07
Pre-slew spectrum (Pre-slew PHA with pre-slew DRM)
Power-law model
Spectral model in power-law:
------------------------------------------------------------
Parameters  : value       lower 90%   higher 90%
Photon index: 1.30776     ( -0.105411   0.104654 )
Norm@50keV  : 5.27821E-03    ( -0.000298239   0.000298206 )
------------------------------------------------------------
#Fit statistic  : Chi-Squared                   55.42     using 59 bins.
 Reduced chi-squared =
# Null hypothesis probability of 5.34e-01 with 57 degrees of freedom

Photon flux (15-150 keV)    in 17.77 sec: 0.630612 ( -0.0373246  0.0374311 ) ph/cm2/s
Energy fluence (15-150 keV)             : 9.25112e-07 ( -5.77701e-08  5.80372e-08 ) ergs/cm2
Cutoff power-law model

Spectral model in the cutoff power-law:
------------------------------------------------------------
Parameters  : value       lower 90%   higher 90%
Photon index: 1.30944     ( -0.109746   0.102007 )
Epeak [keV] : 9999.33      ( -9999.36 -9999.36 )
Norm@50keV  : 5.28989E-03    ( -0.000295604   0.00192889 )
------------------------------------------------------------
#Fit statistic  : Chi-Squared                   55.45     using 59 bins.
 Reduced chi-squared =
# Null hypothesis probability of 4.96e-01 with 56 degrees of freedom

Photon flux (15-150 keV)    in 17.77 sec: 0.630846 ( -0.037802  0.036943 ) ph/cm2/s
Energy fluence (15-150 keV)             : 9.24641e-07 ( -5.76903e-08  5.77792e-08 ) ergs/cm2
Band function
Spectral model in the Band function:
------------------------------------------------------------
Parameters  : value       lower 90%   higher 90%
alpha       :    (     )
beta        :     (     )
Epeak [keV] :       (   )
Norm@50keV   :     (     )
------------------------------------------------------------

Photon flux (15-150 keV)    in  sec:  (    ) ph/cm2/s
Energy fluence (15-150 keV)             : 0 ( 0  0 ) ergs/cm2
S(25-50 keV) vs. S(50-100 keV) plot
S(25-50 keV)  = 2.75e-07
S(50-100 keV) = 4.27e-07
T90 vs. Hardness ratio plot
T90                                   = 40.4079998731613 sec.
Hardness ratio (energy fluence ratio) = 1.55273
Color vs. Color plot
Count Ratio  (25-50 keV) / (15-25 keV) = 1.48641
Count Ratio (50-100 keV) / (15-25 keV) = 1.11364
Mask shadow pattern
IMX = 1.610963696020557E-01, IMY = -1.517595504118485E-01
TIME vs. PHA plot around the trigger time
Blue+Cyan dotted lines: Time interval of the scaled map
From 0.000000 to 1.024000
TIME vs. DetID plot around the trigger time
Blue+Cyan dotted lines: Time interval of the scaled map
From 0.000000 to 1.024000
100 us light curve (15-350 keV)
Blue+Cyan dotted lines: Time interval of the scaled map
From 0.000000 to 1.024000
Spacecraft aspect plot
Bright source in the pre-burst/pre-slew/post-slew images
Pre-burst image of 15-350 keV band
Time interval of the image:
-239.680000 -0.148000

# RAcent  DECcent POSerr Theta    Phi  PeakCts   SNR AngSep     Name
#  [deg]    [deg]    ['] [deg]  [deg]                   [']
186.7250 -62.8581    5.9  39.4 -108.2   2.2779   2.0    5.6	GX 301-2
245.0059 -15.6279    0.8  30.7   18.4   7.1493  14.7    1.7	Sco X-1
256.0113 -37.7973    2.5   8.6   54.3   1.6148   4.6    3.0	4U 1700-377
256.3864 -36.6283    0.0   9.8   53.6   1.2257   3.6   12.5	GX 349+2
262.8340 -24.7265    5.8  22.9   57.9  -0.8454  -2.0    9.6	GX 1+4
264.4868 -44.4368    8.2   9.1  116.9   0.4999   1.4   11.0	4U 1735-44
270.2825 -25.1113    2.8  25.5   73.2   2.0132   4.2    1.9	GX 5-1
270.1999 -25.6996    5.7  25.0   73.7   0.9479   2.1    6.1	GRS 1758-258
274.0719 -13.9620    5.8  37.0   69.0   2.3183   2.0    5.9	GX 17+2
275.9198 -30.5700    0.0  24.2   90.5   0.4619   0.9   12.2	H1820-303
285.0091 -24.7675   88.1  34.0   94.3   0.1035   0.1    9.3	HT1900.1-2455
263.0591 -33.9224    9.7  14.7   71.1   0.4516   1.2    6.3	GX 354-0
314.5761 -44.9886    2.4  42.9  143.7   4.8907   4.8 ------	UNKNOWN
310.4916 -46.9959    2.8  39.5  144.9   3.4120   4.1 ------	UNKNOWN
259.2064 -35.1361    2.9  12.1   61.7   1.2447   4.0 ------	UNKNOWN
352.4228 -58.9172    2.7  56.8  173.9   5.8523   4.3 ------	UNKNOWN
227.3472 -16.8322    3.8  35.4  -11.8   1.3284   3.1 ------	UNKNOWN
228.0115 -29.2648    3.0  24.9  -25.3   1.4106   3.8 ------	UNKNOWN
Pre-slew background subtracted image of 15-350 keV band
Time interval of the image:
-0.148000 17.620640

# RAcent  DECcent POSerr Theta    Phi  PeakCts   SNR AngSep     Name
#  [deg]    [deg]    ['] [deg]  [deg]                   [']
186.6204 -62.6246    9.6  39.5 -107.8   0.1941   1.2    8.8	GX 301-2
245.0753 -15.5385    5.9  30.8   18.6  -0.1306  -2.0    8.2	Sco X-1
256.0599 -37.8224    4.5   8.6   54.6  -0.1375  -2.6    3.7	4U 1700-377
256.4842 -36.2179    0.0  10.3   53.2   0.0916   1.7   12.5	GX 349+2
263.0163 -24.7398    6.7  23.0   58.3  -0.1141  -1.7    0.5	GX 1+4
264.7677 -44.2389    0.0   9.3  116.0  -0.0874  -1.7   12.7	4U 1735-44
270.5137 -25.0809    0.0  25.6   73.5  -0.0632  -0.8   12.5	GX 5-1
270.2267 -25.7628    8.0  24.9   73.9   0.1138   1.4    4.3	GRS 1758-258
273.9051 -14.0737    9.5  36.8   68.8  -0.1721  -1.2    6.3	GX 17+2
275.9061 -30.2349   17.6  24.4   89.9  -0.0485  -0.7    8.0	H1820-303
285.0420 -24.8929   13.3  33.9   94.5   0.0988   0.9    1.7	HT1900.1-2455
262.8212 -33.7586    4.7  14.7   70.1   0.1467   2.4    9.5	GX 354-0
254.8555 -33.5839    0.4  12.5   43.3   1.4609  27.8 ------	UNKNOWN
203.6501 -13.9711    2.1  51.3  -36.5   1.0366   5.6 ------	UNKNOWN
Post-slew image of 15-350 keV band
Time interval of the image:
80.020600 962.383100

# RAcent  DECcent POSerr Theta    Phi  PeakCts   SNR AngSep     Name
#  [deg]    [deg]    ['] [deg]  [deg]                   [']
186.5747 -62.6171   50.1  50.8 -138.1   1.2569   0.2    9.5	GX 301-2
244.9898 -15.6547    0.5  20.0  -20.5  27.4449  21.6    1.1	Sco X-1
255.9910 -37.8452    0.6   4.4  177.0  21.3238  18.0    0.2	4U 1700-377
256.4384 -36.4334    4.9   3.1  165.0   2.8033   2.3    0.6	GX 349+2
262.8656 -24.8433    7.2  11.2   49.0   1.9210   1.6    9.8	GX 1+4
264.6244 -44.3182   16.7  13.1  156.2   0.8627   0.7    9.4	4U 1735-44
268.5075  -1.4552    5.8  34.6   32.9  -4.1900  -2.0    8.4	SW J1753.5-0127
270.0792 -24.9795    0.0  15.8   69.4  -1.3937  -1.0   12.6	GX 5-1
270.0964 -25.6438    0.0  15.4   71.4  -1.9081  -1.3   12.6	GRS 1758-258
274.0414 -13.9252    4.4  26.2   54.5   4.7754   2.6    7.0	GX 17+2
276.0541 -30.4783    5.6  18.2   94.4   2.9976   2.0    9.4	H1820-303
285.1893 -24.8641    5.3  27.7   88.2  -4.3864  -2.2    9.0	HT1900.1-2455
263.1402 -33.7115    7.1   6.9  101.8   1.8963   1.6   10.6	GX 354-0
255.4341  20.6696    2.5  54.3    9.1  12.9573   4.6 ------	UNKNOWN
250.5265  21.0413    2.6  54.8    3.4  12.1996   4.5 ------	UNKNOWN
243.3861   0.0031    4.0  35.3  -11.8   4.6793   2.9 ------	UNKNOWN
229.0279  17.9524    2.1  57.1  -21.2  23.4173   5.5 ------	UNKNOWN
163.1085 -77.3110    3.3  57.7 -156.5  27.8925   3.5 ------	UNKNOWN
219.8927  -2.7777    3.7  44.9  -45.8  10.6012   3.1 ------	UNKNOWN
Plot creation:
Wed Jun 14 14:03:26 EDT 2023