Estimated redshift from machine learning (Ukwatta et al. 2016) - may take a few minute to calcaulte
Image
Pre-slew 15.0-350.0 keV image (Event data)
#   RAcent    DECcent   POSerr    Theta     Phi              Peak Cts       SNR   Name
   81.5319   -33.0183   0.0123    11.2603   -65.0072         0.8584158     15.575 TRIG_01120270

Foreground time interval of the image:
 -9.628   8.872 (delta_t =  18.500 [sec])
Background time interval of the image:
-239.248  -9.628 (delta_t = 229.620 [sec])
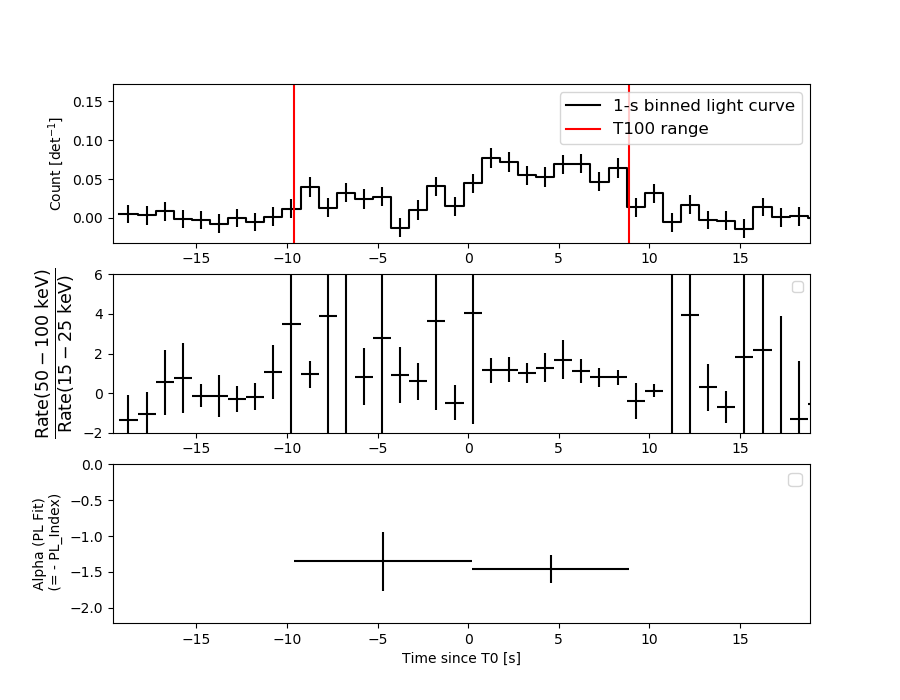
Lightcurves
Notes:
- 1) The mask-weighted light curves are using the flight position.
- 2) Multiple plots of different time binning/intervals are shown to cover all scenarios of short/long GRBs, rate/image triggers, and real/false positives.
- 3) For all the mask-weighted lightcurves, the y-axis units are counts/sec/det where a det is 0.4 x 0.4 = 0.16 sq cm.
- 4) The verticle lines correspond to following: green dotted lines are T50 interval, black dotted lines are T90 interval, blue solid line(s) is a spacecraft slew start time, and orange solid line(s) is a spacecraft slew end time.
- 5) Time of each bin is in the middle of the bin.
1 s binning
From T0-310 s to T0+310 s
From T100_start - 20 s to T100_end + 30 s
Full time interval
64 ms binning
Full time interval

From T100_start to T100_end
From T0-5 sec to T0+5 sec

16 ms binning
From T100_start-5 s to T100_start+5 s
Blue+Cyan dotted lines: Time interval of the scaled map
From 0.000000 to 4.096000
8 ms binning
From T100_start-3 s to T100_start+3 s
Blue+Cyan dotted lines: Time interval of the scaled map
From 0.000000 to 4.096000
2 ms binning
From T100_start-1 s to T100_start+1 s
Blue+Cyan dotted lines: Time interval of the scaled map
From 0.000000 to 4.096000
SN=5 or 10 sec. binning (whichever binning is satisfied first)

SN=5 or 10 sec. binning (T < 200 sec)
Quad-rate summed light curves (from T0-300s to T0+1000s)

Spectral Evolution
Spectra
Notes:
- 1) The fitting includes the systematic errors.
- 2) When the burst includes telescope slew time periods, the fitting uses an average response file made from multiple 5-s response files through out the slew time plus single time preiod for the non-slew times, and weighted by the total counts in the corresponding time period using addrmf. An average response file is needed becuase a spectral fit using the pre-slew DRM will introduce some errors in both a spectral shape and a normalization if the PHA file contains a lot of the slew/post-slew time interval.
- 3) For fits to more complicated models (e.g. a power-law over a cutoff power-law), the BAT team has decided to require a chi-square improvement of more than 6 for each extra dof.
Time averaged spectrum fit using the average DRM
Power-law model

Time interval is from   -9.628 sec. to    8.872 sec.

Spectral model in power-law:
------------------------------------------------------------
Parameters  : value       lower 90%   higher 90%
Photon index: 1.41705     ( -0.189279   0.192071 )
Norm@50keV  : 2.60814E-03    ( -0.000300892   0.000298742 )
------------------------------------------------------------
#Fit statistic  : Chi-Squared                   55.07     using 59 bins.
 Reduced chi-squared = 0.96614
# Null hypothesis probability of 5.48e-01 with 57 degrees of freedom

Photon flux (15-150 keV)    in 18.5 sec: 0.318879 ( -0.035436  0.035455 ) ph/cm2/s
Energy fluence (15-150 keV)             : 4.647e-07 ( -6.00197e-08  6.09686e-08 ) ergs/cm2
Cutoff power-law model

Time interval is from   -9.628 sec. to    8.872 sec.
Spectral model in the cutoff power-law:
------------------------------------------------------------
Parameters  : value       lower 90%   higher 90%
Photon index: 0.387050     ( -1.06615   0.852988 )
Epeak [keV] : 77.4842      ( -18.2712 122.366 )
Norm@50keV  : 8.65316E-03    ( -0.00537162   0.0200663 )
------------------------------------------------------------
#Fit statistic  : Chi-Squared                   50.69     using 59 bins.
 Reduced chi-squared = 0.905179
# Null hypothesis probability of 6.76e-01 with 56 degrees of freedom

Photon flux (15-150 keV)    in 18.5 sec: 0.304566 ( -0.037652  0.037457 ) ph/cm2/s
Energy fluence (15-150 keV)             : 4.28127e-07 ( -6.45204e-08  6.7348e-08 ) ergs/cm2
Band function

Time interval is from   -9.628 sec. to    8.872 sec.


Spectral model in the Band function:
------------------------------------------------------------
Parameters  : value       lower 90%   higher 90%
alpha       :    (     )
beta        :     (     )
Epeak [keV] :       (   )
Norm@50keV   :     (     )
------------------------------------------------------------

Photon flux (15-150 keV)    in  sec:  (    ) ph/cm2/s
Energy fluence (15-150 keV)             : 0 ( 0  0 ) ergs/cm2
Single BB
Spectral model blackbody:
------------------------------------------------------------
Parameters  : value    Lower 90%  Upper 90%
kT [keV]    : 15.4744  (-1.85673  2.1643)
R^2/D10^2   : 3.39405E-02  (-0.0123288   0.0187887)
(R is the radius in km and D10 is the distance to the source in units of 10 kpc)
------------------------------------------------------------
#Fit statistic  : Chi-Squared                   57.31     using 59 bins.
 Reduced chi-squared =
# Null hypothesis probability of 4.64e-01 with 57 degrees of freedom

Energy  Fluence     90% Error
[keV]   [erg/cm2]   [erg/cm2]
15- 25  3.131e-08   7.095e-09
25- 50  1.279e-07   1.996e-08
50-150  2.113e-07   4.651e-08
15-150  3.706e-07   5.476e-08
Thermal bremsstrahlung (OTTB)

Spectral model: thermal bremsstrahlung
------------------------------------------------------------
Parameters  : value         Lower 90%    Upper 90%
kT [keV]    : 200.000       (-61.7673      -200)
Norm        : 1.30887       (-0.144268     0.144268)
------------------------------------------------------------
#Fit statistic  : Chi-Squared                   54.18     using 59 bins.
 Reduced chi-squared =
# Null hypothesis probability of 5.81e-01 with 57 degrees of freedom

Energy  Fluence     90% Error
[keV]   [erg/cm2]   [erg/cm2]
15- 25  6.030e-08   3.348e-08
25- 50  1.160e-07   6.330e-08
50-150  2.544e-07   1.410e-07
15-150  4.307e-07   2.370e-07
Double BB
Spectral model: bbodyrad<1> + bbodyrad<2>
------------------------------------------------------------
Parameters  : value         Lower 90%    Upper 90%
kT1 [keV]   : 3.27279        (-1.60294      3.60414)
R1^2/D10^2  : 4.71524        (-4.5139      414.489)
kT2 [keV]   : 17.5442        (-2.52525      3.93178)
R2^2/D10^2  : 2.07260E-02    (-0.0113089   0.0113395)
------------------------------------------------------------
#Fit statistic  : Chi-Squared                   48.39     using 59 bins.
 Reduced chi-squared =
# Null hypothesis probability of 7.24e-01 with 55 degrees of freedom

Energy  Fluence     90% Error
[keV]   [erg/cm2]   [erg/cm2]
15- 25  5.127e-08   2.223e-08
25- 50  1.134e-07   3.396e-08
50-150  2.397e-07   7.503e-08
15-150  4.044e-07   8.140e-08
Peak spectrum fit
Power-law model
Time interval is from    1.876 sec. to    2.876 sec.

Spectral model in power-law:
------------------------------------------------------------
Parameters  : value       lower 90%   higher 90%
Photon index: 1.22050     ( -0.408046   0.412298 )
Norm@50keV  : 5.41380E-03    ( -0.00128756   0.00128352 )
------------------------------------------------------------
#Fit statistic  : Chi-Squared                   44.57     using 59 bins.
 Reduced chi-squared = 0.78193
# Null hypothesis probability of 8.85e-01 with 57 degrees of freedom

Photon flux (15-150 keV)    in 1 sec: 0.637368 ( -0.151567  0.151814 ) ph/cm2/s
Energy fluence (15-150 keV)             : 5.46185e-08 ( -1.46636e-08  1.50313e-08 ) ergs/cm2
Cutoff power-law model

Time interval is from    1.876 sec. to    2.876 sec.
Spectral model in the cutoff power-law:
------------------------------------------------------------
Parameters  : value       lower 90%   higher 90%
Photon index: -0.166166     ( -3.90814   1.58782 )
Epeak [keV] : 84.2892      ( -29.4332 -83.7668 )
Norm@50keV  : 2.39772E-02    ( -0.0247485   1.31549 )
------------------------------------------------------------
#Fit statistic  : Chi-Squared                   43.19     using 59 bins.
 Reduced chi-squared = 0.77125
# Null hypothesis probability of 8.95e-01 with 56 degrees of freedom

Photon flux (15-150 keV)    in 1 sec: 0.598702 ( -0.168707  0.163188 ) ph/cm2/s
Energy fluence (15-150 keV)             : 5.03211e-08 ( -1.56937e-08  1.63949e-08 ) ergs/cm2
Band function

Time interval is from    1.876 sec. to    2.876 sec.


Spectral model in the Band function:
------------------------------------------------------------
Parameters  : value       lower 90%   higher 90%
alpha       :    (     )
beta        :     (     )
Epeak [keV] :       (   )
Norm@50keV   :     (     )
------------------------------------------------------------

Photon flux (15-150 keV)    in  sec:  (    ) ph/cm2/s
Energy fluence (15-150 keV)             : 0 ( 0  0 ) ergs/cm2
Single BB
Spectral model blackbody:
------------------------------------------------------------
Parameters  : value    Lower 90%  Upper 90%
kT [keV]    : 17.9597  (-4.08226  5.90191)
R^2/D10^2   : 4.35198E-02  (-0.0265543   0.058758)
(R is the radius in km and D10 is the distance to the source in units of 10 kpc)
------------------------------------------------------------
#Fit statistic  : Chi-Squared                   43.63     using 59 bins.
 Reduced chi-squared =
# Null hypothesis probability of 9.04e-01 with 57 degrees of freedom

Energy  Fluence     90% Error
[keV]   [erg/cm2]   [erg/cm2]
15- 25  2.813e-09   1.350e-09
25- 50  1.299e-08   6.189e-09
50-150  3.039e-08   1.445e-08
15-150  4.618e-08   2.016e-08
Thermal bremsstrahlung (OTTB)

Spectral model: thermal bremsstrahlung
------------------------------------------------------------
Parameters  : value         Lower 90%    Upper 90%
kT [keV]    : 199.362       (-91.5312      -199.363)
Norm        : 2.59623       (-0.62053     0.621947)
------------------------------------------------------------
#Fit statistic  : Chi-Squared                   45.96     using 59 bins.
 Reduced chi-squared =
# Null hypothesis probability of 8.52e-01 with 57 degrees of freedom

Energy  Fluence     90% Error
[keV]   [erg/cm2]   [erg/cm2]
15- 25  6.465e-09   3.910e-09
25- 50  1.244e-08   7.540e-09
50-150  2.727e-08   1.630e-08
15-150  4.618e-08   2.725e-08
Double BB
Spectral model: bbodyrad<1> + bbodyrad<2>
------------------------------------------------------------
Parameters  : value         Lower 90%    Upper 90%
kT1 [keV]   : 1.23627        (-1.18401      2.58773)
R1^2/D10^2  : 3.04399E+04        (-28037.2      -28039.9)
kT2 [keV]   : 19.0712        (-4.4362      6.89944)
R2^2/D10^2  : 3.47008E-02    (-0.022108   0.0484188)
------------------------------------------------------------
#Fit statistic  : Chi-Squared                   39.46     using 59 bins.
 Reduced chi-squared =
# Null hypothesis probability of 9.43e-01 with 55 degrees of freedom

Energy  Fluence     90% Error
[keV]   [erg/cm2]   [erg/cm2]
15- 25  3.788e-09   1.536e-09
25- 50  1.199e-08   6.788e-09
50-150  3.190e-08   1.783e-08
15-150  4.768e-08   2.326e-08
Pre-slew spectrum (Pre-slew PHA with pre-slew DRM)
Power-law model
Spectral model in power-law:
------------------------------------------------------------
Parameters  : value       lower 90%   higher 90%
Photon index: 1.41705     ( -0.189279   0.192071 )
Norm@50keV  : 2.60814E-03    ( -0.000300892   0.000298742 )
------------------------------------------------------------
#Fit statistic  : Chi-Squared                   55.07     using 59 bins.
 Reduced chi-squared =
# Null hypothesis probability of 5.48e-01 with 57 degrees of freedom

Photon flux (15-150 keV)    in 18.5 sec: 0.318873 ( -0.0354351  0.0354541 ) ph/cm2/s
Energy fluence (15-150 keV)             : 4.64637e-07 ( -5.99961e-08  6.09828e-08 ) ergs/cm2
Cutoff power-law model

Spectral model in the cutoff power-law:
------------------------------------------------------------
Parameters  : value       lower 90%   higher 90%
Photon index: 0.387038     ( -1.06615   0.85299 )
Epeak [keV] : 77.4840      ( -18.2712 122.352 )
Norm@50keV  : 8.65327E-03    ( -0.00537162   0.0200663 )
------------------------------------------------------------
#Fit statistic  : Chi-Squared                   50.69     using 59 bins.
 Reduced chi-squared =
# Null hypothesis probability of 6.76e-01 with 56 degrees of freedom

Photon flux (15-150 keV)    in 18.5 sec: 0.304544 ( -0.037646  0.037448 ) ph/cm2/s
Energy fluence (15-150 keV)             : 4.28294e-07 ( -6.46667e-08  6.74177e-08 ) ergs/cm2
Band function

Spectral model in the Band function:
------------------------------------------------------------
Parameters  : value       lower 90%   higher 90%
alpha       :    (     )
beta        :     (     )
Epeak [keV] :       (   )
Norm@50keV   :     (     )
------------------------------------------------------------

Photon flux (15-150 keV)    in  sec:  (    ) ph/cm2/s
Energy fluence (15-150 keV)             : 0 ( 0  0 ) ergs/cm2
S(25-50 keV) vs. S(50-100 keV) plot

S(25-50 keV)  = 1.10e-07
S(50-100 keV) = 1.65e-07
T90 vs. Hardness ratio plot

T90                                   = 16.5920000076294 sec.
Hardness ratio (energy fluence ratio) = 1.5
Color vs. Color plot

Count Ratio  (25-50 keV) / (15-25 keV) = 1.66735
Count Ratio (50-100 keV) / (15-25 keV) = 1.33229
Mask shadow pattern
IMX = 8.411997507449501E-02, IMY = 1.804552305637522E-01
TIME vs. PHA plot around the trigger time
Blue+Cyan dotted lines: Time interval of the scaled map
From 0.000000 to 4.096000
TIME vs. DetID plot around the trigger time

Blue+Cyan dotted lines: Time interval of the scaled map
From 0.000000 to 4.096000
100 us light curve (15-350 keV)
Blue+Cyan dotted lines: Time interval of the scaled map
From 0.000000 to 4.096000
Spacecraft aspect plot
Bright source in the pre-burst/pre-slew/post-slew images
Pre-burst image of 15-350 keV band
Time interval of the image:
-239.248000 -9.628000

# RAcent  DECcent POSerr Theta    Phi  PeakCts   SNR AngSep     Name
#  [deg]    [deg]    ['] [deg]  [deg]                   [']
 29.6394 -21.2291    3.1  35.9  116.7   3.3996   3.8 ------	UNKNOWN
 37.2545  -5.4712    2.8  39.5  144.8   3.3511   4.1 ------	UNKNOWN
 83.9305 -51.8871    2.4  22.6   -7.5   1.6916   4.8 ------	UNKNOWN
 74.3044   5.1353    2.2  38.0 -151.7   2.6149   5.1 ------	UNKNOWN
Pre-slew background subtracted image of 15-350 keV band
Time interval of the image:
-9.628000 8.872000

# RAcent  DECcent POSerr Theta    Phi  PeakCts   SNR AngSep     Name
#  [deg]    [deg]    ['] [deg]  [deg]                   [']
 81.5319 -33.0183    0.7  11.3  -65.0   0.8586  15.5 ------	UNKNOWN
118.5788 -41.5566    2.2  40.7  -43.8   0.5639   5.3 ------	UNKNOWN
146.5851 -54.2317    2.1  57.7  -24.3   2.1318   5.6 ------	UNKNOWN
Post-slew image of 15-350 keV band
Time interval of the image:
78.852590 962.887800

# RAcent  DECcent POSerr Theta    Phi  PeakCts   SNR AngSep     Name
#  [deg]    [deg]    ['] [deg]  [deg]                   [']
 83.6043  22.0042    2.0  55.0 -149.3  36.0094   5.7    1.7	Crab
135.3187 -40.5915    0.0  43.1  -35.4  -3.2724  -1.7    9.8	Vela X-1
 40.3120 -27.1122    3.1  35.9  116.7  12.3934   3.8 ------	UNKNOWN
 40.3062 -26.6510    3.3  36.1  117.4  12.8434   4.1 ------	UNKNOWN
 46.1167 -10.4995    2.7  39.5  144.9  12.2549   4.2 ------	UNKNOWN
101.9016 -49.8008    2.5  22.6   -7.5   5.5177   4.6 ------	UNKNOWN
 69.6391   3.9316    2.8  38.6 -170.8   6.6573   4.1 ------	UNKNOWN
131.5605 -57.4769    3.1  41.5  -10.1   6.8706   3.8 ------	UNKNOWN
 98.5123  12.2022    3.0  48.0 -129.0  22.2834   3.9 ------	UNKNOWN
Plot creation:
Wed Jun 14 14:02:13 EDT 2023