Click here for the BAT GCN circular template
Image
Pre-slew 15.0-350.0 keV image (Event data)
#   RAcent    DECcent   POSerr    Theta     Phi              Peak Cts       SNR   Name
    6.8812   -71.3744   0.0027    26.5586    78.2767         6.3594497     72.317 TRIG_00112453

Foreground time interval of the image:
 -9.840   6.317 (delta_t =  16.157 [sec])
Background time interval of the image:
-226.283  -9.840 (delta_t = 216.443 [sec])
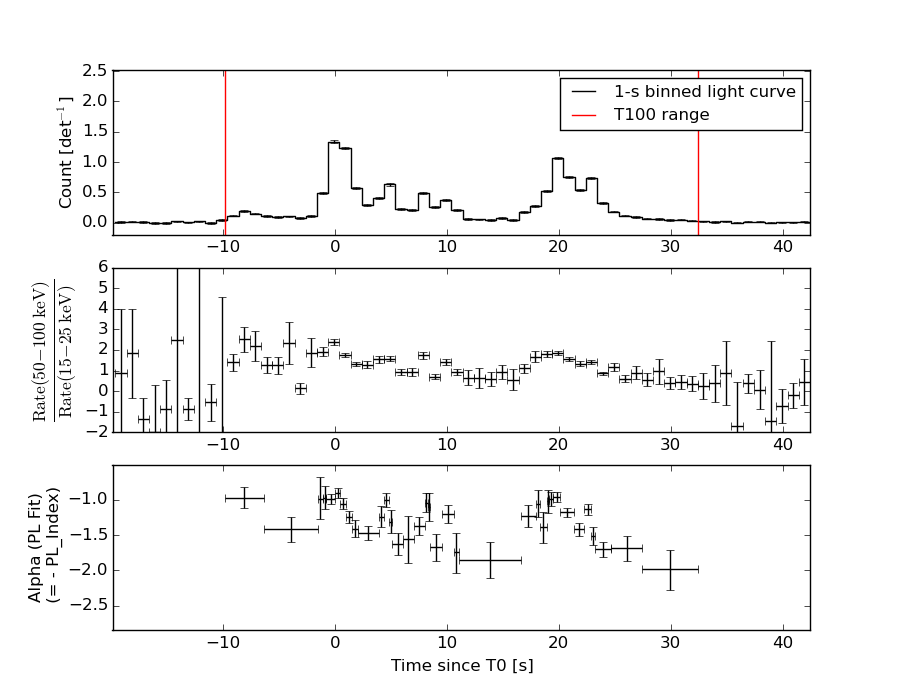
Lightcurves
Notes:
- 1) The mask-weighted light curves are using the flight position.
- 2) Multiple plots of different time binning/intervals are shown to cover all scenarios of short/long GRBs, rate/image triggers, and real/false positives.
- 3) For all the mask-weighted lightcurves, the y-axis units are counts/sec/det where a det is 0.4 x 0.4 = 0.16 sq cm.
- 4) The verticle lines correspond to following: green dotted lines are T50 interval, black dotted lines are T90 interval, blue solid line(s) is a spacecraft slew start time, and orange solid line(s) is a spacecraft slew end time.
- 5) Time of each bin is in the middle of the bin.
1 s binning
From T0-310 s to T0+310 s
From T100_start - 20 s to T100_end + 30 s

Full time interval
64 ms binning
Full time interval
From T100_start to T100_end
From T0-5 sec to T0+5 sec

16 ms binning
From T100_start-5 s to T100_start+5 s

8 ms binning
From T100_start-3 s to T100_start+3 s
2 ms binning
From T100_start-1 s to T100_start+1 s

SN=5 or 10 sec. binning (whichever binning is satisfied first)
SN=5 or 10 sec. binning (T < 200 sec)
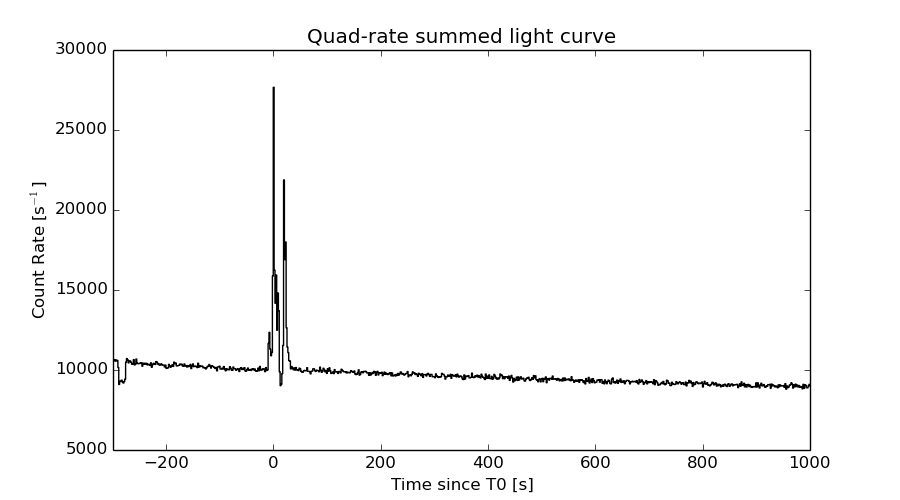
Quad-rate summed light curves (from T0-300s to T0+1000s)
Spectral Evolution
Spectra
Notes:
- 1) The fitting includes the systematic errors.
- 2) When the burst includes telescope slew time periods, the fitting uses an average response file made from multiple 5-s response files through out the slew time plus single time preiod for the non-slew times, and weighted by the total counts in the corresponding time period using addrmf. An average response file is needed becuase a spectral fit using the pre-slew DRM will introduce some errors in both a spectral shape and a normalization if the PHA file contains a lot of the slew/post-slew time interval.
- 3) For fits to more complicated models (e.g. a power-law over a cutoff power-law), the BAT team has decided to require a chi-square improvement of more than 6 for each extra dof.
Time averaged spectrum fit using the average DRM
Power-law model
Time interval is from   -9.840 sec. to   32.424 sec.

Spectral model in power-law:
------------------------------------------------------------
Parameters  : value       lower 90%   higher 90%
Photon index: 1.26088     ( -0.0325241   0.0324373 )
Norm@50keV  : 2.09674E-02    ( -0.000361268   0.000360667 )
------------------------------------------------------------
#Fit statistic : Chi-Squared =          46.85 using 59 PHA bins.
# Reduced chi-squared =         0.8220 for     57 degrees of freedom
# Null hypothesis probability =   8.289529e-01

Photon flux (15-150 keV)    in 42.26 sec: 2.48433 ( -0.0478474  0.0479876 ) ph/cm2/s
Energy fluence (15-150 keV)             : 8.84269e-06 ( -1.51878e-07  1.51933e-07 ) ergs/cm2
Cutoff power-law model
Time interval is from   -9.840 sec. to   32.424 sec.
Spectral model in the cutoff power-law:
------------------------------------------------------------
Parameters  : value       lower 90%   higher 90%
Photon index: 1.15512     ( -0.134464   0.116693 )
Epeak [keV] : 484.000      ( -234.694 -484.102 )
Norm@50keV  : 2.31931E-02    ( -0.00156502   0.00309015 )
------------------------------------------------------------
#Fit statistic : Chi-Squared =          44.97 using 59 PHA bins.
# Reduced chi-squared =         0.8031 for     56 degrees of freedom
# Null hypothesis probability =   8.543707e-01

Photon flux (15-150 keV)    in 42.26 sec: 2.46331 ( -0.05372  0.05306 ) ph/cm2/s
Energy fluence (15-150 keV)             : 8.80162e-06 ( -1.62616e-07  1.61771e-07 ) ergs/cm2
Band function
Time interval is from   -9.840 sec. to   32.424 sec.

Spectral model in the Band function:
------------------------------------------------------------
Parameters  : value       lower 90%   higher 90%
alpha       : -0.920459   ( -0.50307   4.47203 )
beta        : -1.30545    ( 1.29439   0.0485248 )
Epeak [keV] : 140.665      ( -80.0584 219.7 )
Norm@50keV   : 3.14284E-02    ( -0.00939219   0.0169471 )
------------------------------------------------------------
#Fit statistic : Chi-Squared =          43.71 using 59 PHA bins.
# Reduced chi-squared =         0.7948 for     55 degrees of freedom
# Null hypothesis probability =   8.633109e-01

Photon flux (15-150 keV)    in 42.26 sec:  (    ) ph/cm2/s
Energy fluence (15-150 keV)             : 0 ( 0  0 ) ergs/cm2
Single BB
Spectral model blackbody:
------------------------------------------------------------
Parameters  : value    Lower 90%  Upper 90%
kT [keV]    : 20.6815  (  )
R^2/D10^2   : 9.78432E-02  (   )
(R is the radius in km and D10 is the distance to the source in units of 10 kpc)
------------------------------------------------------------
#Fit statistic : Chi-Squared =         653.83 using 59 PHA bins.
# Reduced chi-squared =         11.471 for     57 degrees of freedom
# Null hypothesis probability =  2.810047e-102

Energy  Fluence     90% Error
[keV]   [erg/cm2]   [erg/cm2]
15- 25  3.363e-07   1.177e-08
25- 50  1.712e-06   4.522e-08
50-150  5.451e-06   1.289e-07
15-150  7.499e-06   1.395e-07
Thermal bremsstrahlung (OTTB)

Spectral model: thermal bremsstrahlung
------------------------------------------------------------
Parameters  : value         Lower 90%    Upper 90%
kT [keV]    : 199.363       (      )
Norm        : 10.7516       (     )
------------------------------------------------------------
#Fit statistic : Chi-Squared =         343.78 using 59 PHA bins.
# Reduced chi-squared =         6.0312 for     57 degrees of freedom
# Null hypothesis probability =   1.364146e-42

Energy  Fluence     90% Error
[keV]   [erg/cm2]   [erg/cm2]
15- 25  1.131e-06   2.007e-08
25- 50  2.176e-06   4.036e-08
50-150  4.773e-06   9.508e-08
15-150  8.081e-06   1.521e-07
Double BB

Spectral model: bbodyrad<1> + bbodyrad<2>
------------------------------------------------------------
Parameters  : value         Lower 90%    Upper 90%
kT1 [keV]   : 8.81543        (-0.67218      0.716858)
R1^2/D10^2  : 0.993281        (-0.213242      0.289887)
kT2 [keV]   : 34.7055        (-2.57516      3.29209)
R2^2/D10^2  : 1.48660E-02    (-0.00380359   0.0044003)
------------------------------------------------------------
#Fit statistic : Chi-Squared =          59.79 using 59 PHA bins.
# Reduced chi-squared =          1.087 for     55 degrees of freedom
# Null hypothesis probability =   3.058774e-01

Energy  Fluence     90% Error
[keV]   [erg/cm2]   [erg/cm2]
15- 25  7.359e-07   4.923e-08
25- 50  1.995e-06   6.952e-08
50-150  6.028e-06   2.282e-07
15-150  8.759e-06   2.853e-07
Peak spectrum fit
Power-law model
Time interval is from   -0.080 sec. to    0.920 sec.

Spectral model in power-law:
------------------------------------------------------------
Parameters  : value       lower 90%   higher 90%
Photon index: 0.963991     ( -0.0537814   0.053433 )
Norm@50keV  : 0.106889    ( -0.00320989   0.00320284 )
------------------------------------------------------------
#Fit statistic : Chi-Squared =          54.88 using 59 PHA bins.
# Reduced chi-squared =         0.9629 for     57 degrees of freedom
# Null hypothesis probability =   5.549133e-01

Photon flux (15-150 keV)    in 1 sec: 12.2863 ( -0.373975  0.374245 ) ph/cm2/s
Energy fluence (15-150 keV)             : 1.17095e-06 ( -3.7821e-08  3.79086e-08 ) ergs/cm2
Cutoff power-law model
Time interval is from   -0.080 sec. to    0.920 sec.
Spectral model in the cutoff power-law:
------------------------------------------------------------
Parameters  : value       lower 90%   higher 90%
Photon index: 0.816588     ( -0.219077   0.17518 )
Epeak [keV] : 477.405      ( -477.405 -477.405 )
Norm@50keV  : 0.123710    ( -0.0183983   0.0290526 )
------------------------------------------------------------
#Fit statistic : Chi-Squared =          53.46 using 59 PHA bins.
# Reduced chi-squared =         0.9546 for     56 degrees of freedom
# Null hypothesis probability =   5.716980e-01

Photon flux (15-150 keV)    in 1 sec: 12.2072 ( -0.3891  0.3894 ) ph/cm2/s
Energy fluence (15-150 keV)             : 1.16469e-06 ( 0  0 ) ergs/cm2
Band function

Time interval is from   -0.080 sec. to    0.920 sec.

Spectral model in the Band function:
------------------------------------------------------------
Parameters  : value       lower 90%   higher 90%
alpha       : -0.811247   ( 0.811247   0.811247 )
beta        : -0.963972    ( -0.053441   0.0537848 )
Epeak [keV] : 51.4773      (   )
Norm@50keV   : 0.169604    (     )
------------------------------------------------------------
#Fit statistic : Chi-Squared =          54.88 using 59 PHA bins.
# Reduced chi-squared =         0.9979 for     55 degrees of freedom
# Null hypothesis probability =   4.790729e-01

Photon flux (15-150 keV)    in 1 sec:  (    ) ph/cm2/s
Energy fluence (15-150 keV)             : 0 ( 0  0 ) ergs/cm2
Single BB
Spectral model blackbody:
------------------------------------------------------------
Parameters  : value    Lower 90%  Upper 90%
kT [keV]    : 23.0811  (  )
R^2/D10^2   : 0.382550  (   )
(R is the radius in km and D10 is the distance to the source in units of 10 kpc)
------------------------------------------------------------
#Fit statistic : Chi-Squared =         227.82 using 59 PHA bins.
# Reduced chi-squared =         3.9969 for     57 degrees of freedom
# Null hypothesis probability =   2.780178e-22

Energy  Fluence     90% Error
[keV]   [erg/cm2]   [erg/cm2]
15- 25  3.687e-08   2.305e-09
25- 50  2.004e-07   9.050e-09
50-150  7.975e-07   3.785e-08
15-150  1.035e-06   3.895e-08
Thermal bremsstrahlung (OTTB)
Spectral model: thermal bremsstrahlung
------------------------------------------------------------
Parameters  : value         Lower 90%    Upper 90%
kT [keV]    : 199.363       (      )
Norm        : 49.8667       (     )
------------------------------------------------------------
#Fit statistic : Chi-Squared =         379.47 using 59 PHA bins.
# Reduced chi-squared =         6.6573 for     57 degrees of freedom
# Null hypothesis probability =   3.611172e-49

Energy  Fluence     90% Error
[keV]   [erg/cm2]   [erg/cm2]
15- 25  1.242e-07   4.200e-09
25- 50  2.389e-07   7.400e-09
50-150  5.239e-07   1.725e-08
15-150  8.869e-07   2.625e-08
Double BB
Spectral model: bbodyrad<1> + bbodyrad<2>
------------------------------------------------------------
Parameters  : value         Lower 90%    Upper 90%
kT1 [keV]   : 9.07174        (-1.31979      1.53461)
R1^2/D10^2  : 3.68960        (-1.2852      2.20475)
kT2 [keV]   : 38.1352        (-4.80607      7.84994)
R2^2/D10^2  : 7.05752E-02    (-0.0301848   0.0372415)
------------------------------------------------------------
#Fit statistic : Chi-Squared =          56.76 using 59 PHA bins.
# Reduced chi-squared =          1.032 for     55 degrees of freedom
# Null hypothesis probability =   4.091115e-01

Energy  Fluence     90% Error
[keV]   [erg/cm2]   [erg/cm2]
15- 25  7.306e-08   9.305e-09
25- 50  2.198e-07   1.710e-08
50-150  8.789e-07   9.495e-08
15-150  1.172e-06   1.068e-07
Pre-slew spectrum (Pre-slew PHA with pre-slew DRM)
Power-law model

Spectral model in power-law:
------------------------------------------------------------
Parameters  : value       lower 90%   higher 90%
Photon index: 1.17891     ( -0.0396499   0.0395254 )
Norm@50keV  : 2.61291E-02    ( -0.000560223   0.000559793 )
------------------------------------------------------------
#Fit statistic : Chi-Squared =          62.59 using 59 PHA bins.
# Reduced chi-squared =          1.098 for     57 degrees of freedom
# Null hypothesis probability =   2.846579e-01

Photon flux (15-150 keV)    in 16.16 sec: 3.05822 ( -0.070215  0.0703588 ) ph/cm2/s
Energy fluence (15-150 keV)             : 4.30978e-06 ( -9.61851e-08  9.62976e-08 ) ergs/cm2
Cutoff power-law model

Spectral model in the cutoff power-law:
------------------------------------------------------------
Parameters  : value       lower 90%   higher 90%
Photon index: 0.893429     ( -0.169617   0.163487 )
Epeak [keV] : 228.710      ( -62.9937 213.242 )
Norm@50keV  : 3.46086E-02    ( -0.00503155   0.00610487 )
------------------------------------------------------------
#Fit statistic : Chi-Squared =          53.52 using 59 PHA bins.
# Reduced chi-squared =         0.9558 for     56 degrees of freedom
# Null hypothesis probability =   5.691326e-01

Photon flux (15-150 keV)    in 16.16 sec: 3.00206 ( -0.07625  0.0765 ) ph/cm2/s
Energy fluence (15-150 keV)             : 4.25052e-06 ( -1.03537e-07  1.02842e-07 ) ergs/cm2
Band function
Spectral model in the Band function:
------------------------------------------------------------
Parameters  : value       lower 90%   higher 90%
alpha       : -0.679747   ( -0.337851   1.3751 )
beta        : -1.31596    ( -0.55724   0.104712 )
Epeak [keV] : 131.960      ( -85.0204 219.613 )
Norm@50keV   : 4.54052E-02    ( -0.0147129   0.0792137 )
------------------------------------------------------------
#Fit statistic : Chi-Squared =          52.39 using 59 PHA bins.
# Reduced chi-squared =         0.9525 for     55 degrees of freedom
# Null hypothesis probability =   5.751360e-01

Photon flux (15-150 keV)    in 16.16 sec:  (    ) ph/cm2/s
Energy fluence (15-150 keV)             : 0 ( 0  0 ) ergs/cm2
S(25-50 keV) vs. S(50-100 keV) plot
S(25-50 keV)  = 1.92e-06
S(50-100 keV) = 3.21e-06
T90 vs. Hardness ratio plot
T90                                   = 29.440000012517 sec.
Hardness ratio (energy fluence ratio) = 1.67188
Color vs. Color plot
Count Ratio  (25-50 keV) / (15-25 keV) = 1.5977
Count Ratio (50-100 keV) / (15-25 keV) = 1.46638
Mask shadow pattern
IMX = 1.015638606379468E-01, IMY = -4.894329814326609E-01
TIME vs. PHA plot around the trigger time

TIME vs. DetID plot around the trigger time
100 us light curve (15-350 keV)

Spacecraft aspect plot

Bright source in the pre-burst/pre-slew/post-slew images
Pre-burst image of 15-350 keV band
Time interval of the image:
-226.283410 -9.840000

# RAcent  DECcent POSerr Theta    Phi  PeakCts   SNR AngSep     Name
#  [deg]    [deg]    ['] [deg]  [deg]                   [']
289.8666 -56.7538    2.8  43.7  131.5   2.4948   4.1 ------	UNKNOWN
 38.0936  -6.5313    3.1  50.7  -44.5   2.9911   3.7 ------	UNKNOWN
  8.7145  -4.7530    2.2  41.0  -83.5   3.2966   5.2  595.1	UNKNOWN
Pre-slew background subtracted image of 15-350 keV band
Time interval of the image:
-9.840000 6.316600

# RAcent  DECcent POSerr Theta    Phi  PeakCts   SNR AngSep     Name
#  [deg]    [deg]    ['] [deg]  [deg]                   [']
  6.8811 -71.3744    0.2  26.6   78.3   6.3593  72.3 ------	UNKNOWN
 36.6245 -39.2954    2.4  27.5   -5.8   0.2917   4.8 ------	UNKNOWN
333.4144 -12.5383    2.8  39.6 -140.1   0.3691   4.2 ------	UNKNOWN
311.3076  -4.0238    3.0  59.0 -157.8   1.2347   3.9 ------	UNKNOWN
326.1984  -1.6151    2.9  52.6 -141.2   0.9486   3.9 ------	UNKNOWN
337.3444  -1.7338    2.6  47.7 -128.2   0.9724   4.4 ------	UNKNOWN
Post-slew image of 15-350 keV band
Time interval of the image:
85.316600 302.503600

# RAcent  DECcent POSerr Theta    Phi  PeakCts   SNR AngSep     Name
#  [deg]    [deg]    ['] [deg]  [deg]                   [']
135.5373 -40.5819    4.5  38.1   74.8   1.6575   2.5    1.7	Vela X-1
170.2632 -60.6630    4.3  42.2  120.4  -1.7801  -2.7    2.9	Cen X-3
209.4477 -71.8234    2.8  45.6  147.2   1.9311   4.2 ------	UNKNOWN
 68.3973 -16.6591    2.3  42.1  -31.2   1.2081   5.1 ------	UNKNOWN
 63.5375  -8.5284    3.2  51.0  -35.4   1.8954   3.6 ------	UNKNOWN
  8.1109 -45.4072    3.1  44.7 -119.9   2.2373   3.7 ------	UNKNOWN
Plot creation:
Sun May 31 17:15:39 EDT 2015