Special notes of this burst
Image
Pre-slew 15.0-350.0 keV image (Event data)
#   RAcent    DECcent   POSerr    Theta     Phi              Peak Cts       SNR   Name
   38.9380   -34.6151   0.0055    24.2661   -69.1492         3.3941642     35.211 TRIG_01129775

Foreground time interval of the image:
 -3.176  15.261 (delta_t =  18.437 [sec])
Background time interval of the image:
-201.539  -3.176 (delta_t = 198.363 [sec])
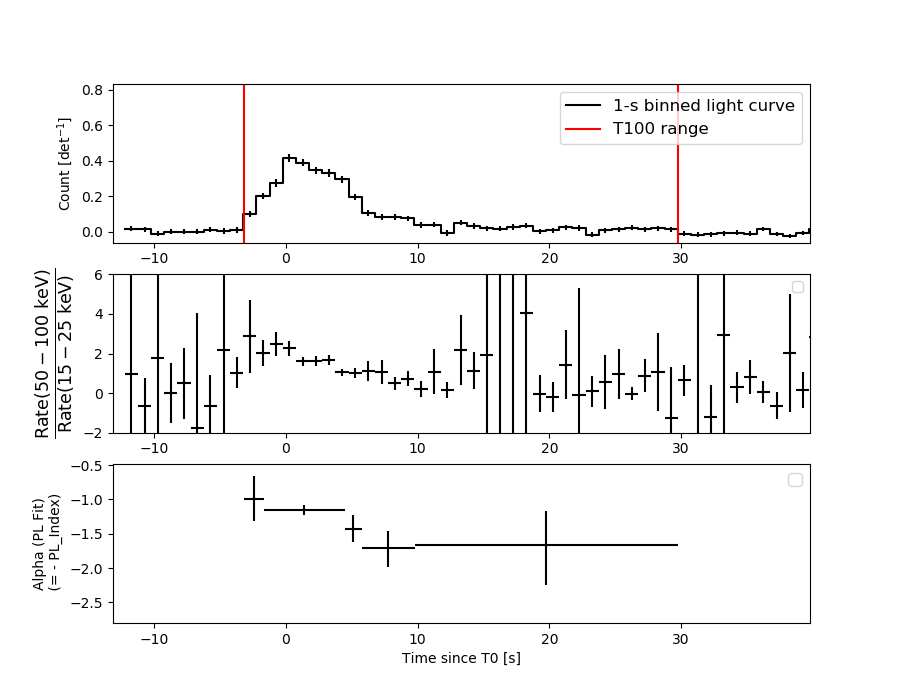
Lightcurves
Notes:
- 1) The mask-weighted light curves are using the flight position.
- 2) Multiple plots of different time binning/intervals are shown to cover all scenarios of short/long GRBs, rate/image triggers, and real/false positives.
- 3) For all the mask-weighted lightcurves, the y-axis units are counts/sec/det where a det is 0.4 x 0.4 = 0.16 sq cm.
- 4) The verticle lines correspond to following: green dotted lines are T50 interval, black dotted lines are T90 interval, blue solid line(s) is a spacecraft slew start time, and orange solid line(s) is a spacecraft slew end time.
- 5) Time of each bin is in the middle of the bin.
1 s binning
From T0-310 s to T0+310 s

From T100_start - 20 s to T100_end + 30 s
Full time interval
64 ms binning
Full time interval
From T100_start to T100_end
From T0-5 sec to T0+5 sec

16 ms binning
From T100_start-5 s to T100_start+5 s

8 ms binning
From T100_start-3 s to T100_start+3 s

2 ms binning
From T100_start-1 s to T100_start+1 s
SN=5 or 10 sec. binning (whichever binning is satisfied first)
SN=5 or 10 sec. binning (T < 200 sec)

Quad-rate summed light curves (from T0-300s to T0+1000s)

Spectral Evolution
Spectra
Notes:
- 1) The fitting includes the systematic errors.
- 2) When the burst includes telescope slew time periods, the fitting uses an average response file made from multiple 5-s response files through out the slew time plus single time preiod for the non-slew times, and weighted by the total counts in the corresponding time period using addrmf. An average response file is needed becuase a spectral fit using the pre-slew DRM will introduce some errors in both a spectral shape and a normalization if the PHA file contains a lot of the slew/post-slew time interval.
- 3) For fits to more complicated models (e.g. a power-law over a cutoff power-law), the BAT team has decided to require a chi-square improvement of more than 6 for each extra dof.
Time averaged spectrum fit using the average DRM
Power-law model
Time interval is from   -3.176 sec. to   29.800 sec.

Spectral model in power-law:
------------------------------------------------------------
Parameters  : value       lower 90%   higher 90%
Photon index: 1.28087     ( -0.0836576   0.0834755 )
Norm@50keV  : 6.83597E-03    ( -0.000319943   0.000319931 )
------------------------------------------------------------
#Fit statistic  : Chi-Squared                   63.21     using 59 bins.
 Reduced chi-squared = 1.10895
# Null hypothesis probability of 2.66e-01 with 57 degrees of freedom

Photon flux (15-150 keV)    in 32.98 sec: 0.812753 ( -0.039517  0.039577 ) ph/cm2/s
Energy fluence (15-150 keV)             : 2.23867e-06 ( -1.15718e-07  1.16218e-07 ) ergs/cm2
Cutoff power-law model

Time interval is from   -3.176 sec. to   29.800 sec.
Spectral model in the cutoff power-law:
------------------------------------------------------------
Parameters  : value       lower 90%   higher 90%
Photon index: 0.816820     ( -0.369794   0.340649 )
Epeak [keV] : 139.095      ( -38.8446 210.851 )
Norm@50keV  : 1.12348E-02    ( -0.00335978   0.00525646 )
------------------------------------------------------------
#Fit statistic  : Chi-Squared                   57.66     using 59 bins.
 Reduced chi-squared = 1.02964
# Null hypothesis probability of 4.14e-01 with 56 degrees of freedom

Photon flux (15-150 keV)    in 32.98 sec: 0.793048 ( -0.041986  0.041989 ) ph/cm2/s
Energy fluence (15-150 keV)             : 2.17456e-06 ( -1.2627e-07  1.25989e-07 ) ergs/cm2
Band function

Time interval is from   -3.176 sec. to   29.800 sec.


Spectral model in the Band function:
------------------------------------------------------------
Parameters  : value       lower 90%   higher 90%
alpha       :    (     )
beta        :     (     )
Epeak [keV] :       (   )
Norm@50keV   :     (     )
------------------------------------------------------------

Photon flux (15-150 keV)    in  sec:  (    ) ph/cm2/s
Energy fluence (15-150 keV)             : 0 ( 0  0 ) ergs/cm2
Single BB

Spectral model blackbody:
------------------------------------------------------------
Parameters  : value    Lower 90%  Upper 90%
kT [keV]    : 18.2583  (  )
R^2/D10^2   : 4.94753E-02  (   )
(R is the radius in km and D10 is the distance to the source in units of 10 kpc)
------------------------------------------------------------
#Fit statistic  : Chi-Squared                  122.47     using 59 bins.
 Reduced chi-squared =
# Null hypothesis probability of 1.09e-06 with 57 degrees of freedom

Energy  Fluence     90% Error
[keV]   [erg/cm2]   [erg/cm2]
15- 25  1.084e-07   1.029e-08
25- 50  5.067e-07   3.183e-08
50-150  1.230e-06   1.078e-07
15-150  1.846e-06   1.097e-07
Thermal bremsstrahlung (OTTB)

Spectral model: thermal bremsstrahlung
------------------------------------------------------------
Parameters  : value         Lower 90%    Upper 90%
kT [keV]    : 200.000       (-9.26154      -200)
Norm        : 3.38371       (-0.16004     0.16004)
------------------------------------------------------------
#Fit statistic  : Chi-Squared                   89.50     using 59 bins.
 Reduced chi-squared =
# Null hypothesis probability of 3.86e-03 with 57 degrees of freedom

Energy  Fluence     90% Error
[keV]   [erg/cm2]   [erg/cm2]
15- 25  2.778e-07   1.550e-08
25- 50  5.345e-07   2.622e-08
50-150  1.172e-06   6.860e-08
15-150  1.985e-06   1.148e-07
Double BB

Spectral model: bbodyrad<1> + bbodyrad<2>
------------------------------------------------------------
Parameters  : value         Lower 90%    Upper 90%
kT1 [keV]   : 6.21581        (-1.32778      1.80536)
R1^2/D10^2  : 0.911562        (-0.520079      1.37215)
kT2 [keV]   : 24.5833        (-2.68773      4.17765)
R2^2/D10^2  : 1.60348E-02    (-0.00701723   0.00834088)
------------------------------------------------------------
#Fit statistic  : Chi-Squared                   58.39     using 59 bins.
 Reduced chi-squared =
# Null hypothesis probability of 3.52e-01 with 55 degrees of freedom

Energy  Fluence     90% Error
[keV]   [erg/cm2]   [erg/cm2]
15- 25  2.181e-07   5.950e-08
25- 50  4.894e-07   9.195e-08
50-150  1.433e-06   1.850e-07
15-150  2.141e-06   2.676e-07
Peak spectrum fit
Power-law model

Time interval is from    0.028 sec. to    1.028 sec.

Spectral model in power-law:
------------------------------------------------------------
Parameters  : value       lower 90%   higher 90%
Photon index: 1.00359     ( -0.135423   0.133393 )
Norm@50keV  : 2.94191E-02    ( -0.00240654   0.00240439 )
------------------------------------------------------------
#Fit statistic  : Chi-Squared                   51.11     using 59 bins.
 Reduced chi-squared = 0.896667
# Null hypothesis probability of 6.95e-01 with 57 degrees of freedom

Photon flux (15-150 keV)    in 1 sec: 3.38764 ( -0.28056  0.28078 ) ph/cm2/s
Energy fluence (15-150 keV)             : 3.17753e-07 ( -2.84786e-08  2.86407e-08 ) ergs/cm2
Cutoff power-law model

Time interval is from    0.028 sec. to    1.028 sec.
Spectral model in the cutoff power-law:
------------------------------------------------------------
Parameters  : value       lower 90%   higher 90%
Photon index: 0.332161     ( -0.64837   0.557813 )
Epeak [keV] : 140.561      ( -43.3511 351.896 )
Norm@50keV  : 5.95055E-02    ( -0.0258889   0.0545339 )
------------------------------------------------------------
#Fit statistic  : Chi-Squared                   46.78     using 59 bins.
 Reduced chi-squared = 0.835357
# Null hypothesis probability of 8.05e-01 with 56 degrees of freedom

Photon flux (15-150 keV)    in 1 sec: 3.32390 ( -0.28717  0.28648 ) ph/cm2/s
Energy fluence (15-150 keV)             : 3.09072e-07 ( -3.04471e-08  3.01859e-08 ) ergs/cm2
Band function

Time interval is from    0.028 sec. to    1.028 sec.


Spectral model in the Band function:
------------------------------------------------------------
Parameters  : value       lower 90%   higher 90%
alpha       :    (     )
beta        :     (     )
Epeak [keV] :       (   )
Norm@50keV   :     (     )
------------------------------------------------------------

Photon flux (15-150 keV)    in  sec:  (    ) ph/cm2/s
Energy fluence (15-150 keV)             : 0 ( 0  0 ) ergs/cm2
Single BB

Spectral model blackbody:
------------------------------------------------------------
Parameters  : value    Lower 90%  Upper 90%
kT [keV]    : 21.1580  (-2.10231  2.42993)
R^2/D10^2   : 0.141120  (-0.0410238   0.0556298)
(R is the radius in km and D10 is the distance to the source in units of 10 kpc)
------------------------------------------------------------
#Fit statistic  : Chi-Squared                   61.57     using 59 bins.
 Reduced chi-squared =
# Null hypothesis probability of 3.16e-01 with 57 degrees of freedom

Energy  Fluence     90% Error
[keV]   [erg/cm2]   [erg/cm2]
15- 25  1.190e-08   1.901e-09
25- 50  6.144e-08   7.980e-09
50-150  2.051e-07   2.870e-08
15-150  2.784e-07   3.035e-08
Thermal bremsstrahlung (OTTB)
Spectral model: thermal bremsstrahlung
------------------------------------------------------------
Parameters  : value         Lower 90%    Upper 90%
kT [keV]    : 200.000       (-13.7085      -200)
Norm        : 13.4591       (-1.15257     1.15257)
------------------------------------------------------------
#Fit statistic  : Chi-Squared                   91.58     using 59 bins.
 Reduced chi-squared =
# Null hypothesis probability of 2.49e-03 with 57 degrees of freedom

Energy  Fluence     90% Error
[keV]   [erg/cm2]   [erg/cm2]
15- 25  3.351e-08   4.660e-09
25- 50  6.446e-08   1.743e-08
50-150  1.414e-07   5.689e-08
15-150  2.393e-07   8.230e-08
Double BB

Spectral model: bbodyrad<1> + bbodyrad<2>
------------------------------------------------------------
Parameters  : value         Lower 90%    Upper 90%
kT1 [keV]   : 9.38271        (-4.10215      6.15156)
R1^2/D10^2  : 0.826576        (-0.551155      3.70364)
kT2 [keV]   : 31.4788        (-7.77951      67.3464)
R2^2/D10^2  : 3.28489E-02    (-0.0309297   0.0577613)
------------------------------------------------------------
#Fit statistic  : Chi-Squared                   47.14     using 59 bins.
 Reduced chi-squared =
# Null hypothesis probability of 7.65e-01 with 55 degrees of freedom

Energy  Fluence     90% Error
[keV]   [erg/cm2]   [erg/cm2]
15- 25  1.940e-08   9.877e-09
25- 50  6.382e-08   2.801e-08
50-150  2.273e-07   1.151e-07
15-150  3.105e-07   1.494e-07
Pre-slew spectrum (Pre-slew PHA with pre-slew DRM)
Power-law model

Spectral model in power-law:
------------------------------------------------------------
Parameters  : value       lower 90%   higher 90%
Photon index: 1.28969     ( -0.0738128   0.0737059 )
Norm@50keV  : 1.14236E-02    ( -0.000473149   0.000473134 )
------------------------------------------------------------
#Fit statistic  : Chi-Squared                   67.17     using 59 bins.
 Reduced chi-squared =
# Null hypothesis probability of 1.68e-01 with 57 degrees of freedom

Photon flux (15-150 keV)    in 18.44 sec: 1.36030 ( -0.0586347  0.0587307 ) ph/cm2/s
Energy fluence (15-150 keV)             : 2.08689e-06 ( -9.52629e-08  9.5559e-08 ) ergs/cm2
Cutoff power-law model

Spectral model in the cutoff power-law:
------------------------------------------------------------
Parameters  : value       lower 90%   higher 90%
Photon index: 0.852482     ( -0.321105   0.299071 )
Epeak [keV] : 143.189      ( -38.7267 176.512 )
Norm@50keV  : 1.82539E-02    ( -0.00489662   0.00724374 )
------------------------------------------------------------
#Fit statistic  : Chi-Squared                   60.75     using 59 bins.
 Reduced chi-squared =
# Null hypothesis probability of 3.09e-01 with 56 degrees of freedom

Photon flux (15-150 keV)    in 18.44 sec: 1.32957 ( -0.06205  0.06207 ) ph/cm2/s
Energy fluence (15-150 keV)             : 2.03275e-06 ( -1.03946e-07  1.03375e-07 ) ergs/cm2
Band function

Spectral model in the Band function:
------------------------------------------------------------
Parameters  : value       lower 90%   higher 90%
alpha       :    (     )
beta        :     (     )
Epeak [keV] :       (   )
Norm@50keV   :     (     )
------------------------------------------------------------

Photon flux (15-150 keV)    in  sec:  (    ) ph/cm2/s
Energy fluence (15-150 keV)             : 0 ( 0  0 ) ergs/cm2
S(25-50 keV) vs. S(50-100 keV) plot
S(25-50 keV)  = 4.91e-07
S(50-100 keV) = 8.11e-07
T90 vs. Hardness ratio plot

T90                                   = 21.9839999675751 sec.
Hardness ratio (energy fluence ratio) = 1.65173
Color vs. Color plot
Count Ratio  (25-50 keV) / (15-25 keV) = 1.55011
Count Ratio (50-100 keV) / (15-25 keV) = 1.44175
Mask shadow pattern

IMX = 1.604581815327354E-01, IMY = 4.212827896937619E-01
TIME vs. PHA plot around the trigger time

TIME vs. DetID plot around the trigger time

100 us light curve (15-350 keV)

Spacecraft aspect plot
Bright source in the pre-burst/pre-slew/post-slew images
Pre-burst image of 15-350 keV band
Time interval of the image:
-201.539400 -3.176000

# RAcent  DECcent POSerr Theta    Phi  PeakCts   SNR AngSep     Name
#  [deg]    [deg]    ['] [deg]  [deg]                   [']
 83.6459  22.0219    4.7  55.3  166.6   6.5298   2.5    0.8	Crab
341.8213 -38.0477    2.4  57.2  -16.1   7.6981   4.7 ------	UNKNOWN
Pre-slew background subtracted image of 15-350 keV band
Time interval of the image:
-3.176000 15.260590

# RAcent  DECcent POSerr Theta    Phi  PeakCts   SNR AngSep     Name
#  [deg]    [deg]    ['] [deg]  [deg]                   [']
 83.8063  22.0146    9.0  55.4  166.7  -0.4122  -1.3    9.6	Crab
 56.2092 -11.6701    2.5  17.9 -151.3   0.2928   4.7 ------	UNKNOWN
 38.9380 -34.6151    0.3  24.3  -69.1   3.3942  35.2 ------	UNKNOWN
 95.6192  -1.0189    2.5  58.0 -162.5   1.9952   4.6 ------	UNKNOWN
Post-slew image of 15-350 keV band
Time interval of the image:
75.060600 350.060590

# RAcent  DECcent POSerr Theta    Phi  PeakCts   SNR AngSep     Name
#  [deg]    [deg]    ['] [deg]  [deg]                   [']
357.0343  -7.2209    2.8  47.2   49.2   7.3637   4.1  468.2	UNKNOWN
321.2465 -48.6870    2.0  57.1  -16.1  11.4746   5.7 ------	UNKNOWN
Plot creation:
Fri Nov  3 18:50:20 EDT 2023