Special notes of this burst
Image
Pre-slew 15.0-350.0 keV image (Event data)

#   RAcent    DECcent   POSerr    Theta     Phi              Peak Cts       SNR   Name
  247.8734     2.1866   0.0072    55.6708     5.6150         8.8356351     26.685 TRIG_00113120

Foreground time interval of the image:
 -5.908  25.317 (delta_t =  31.225 [sec])
Background time interval of the image:
-299.784  -5.908 (delta_t = 293.876 [sec])
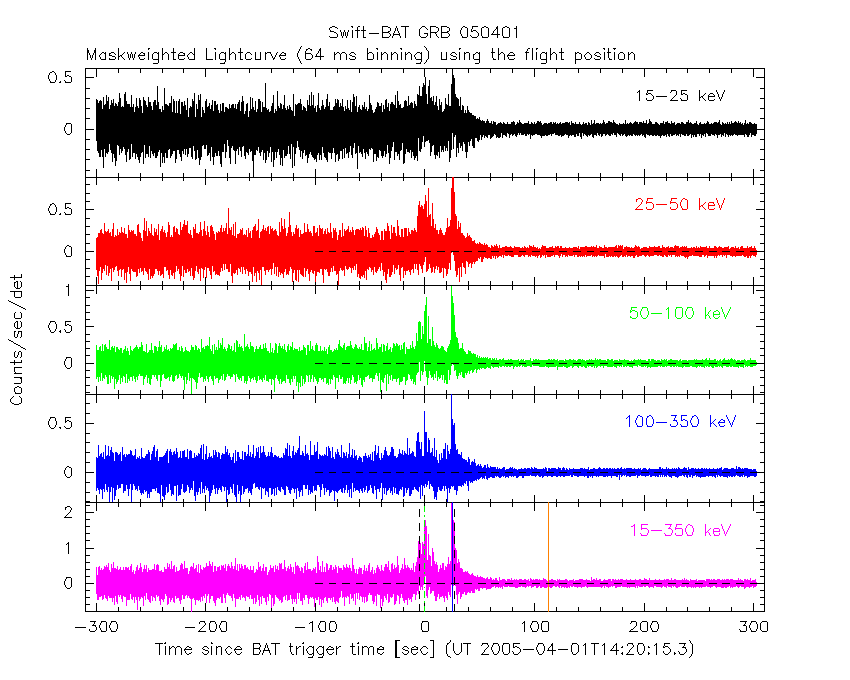
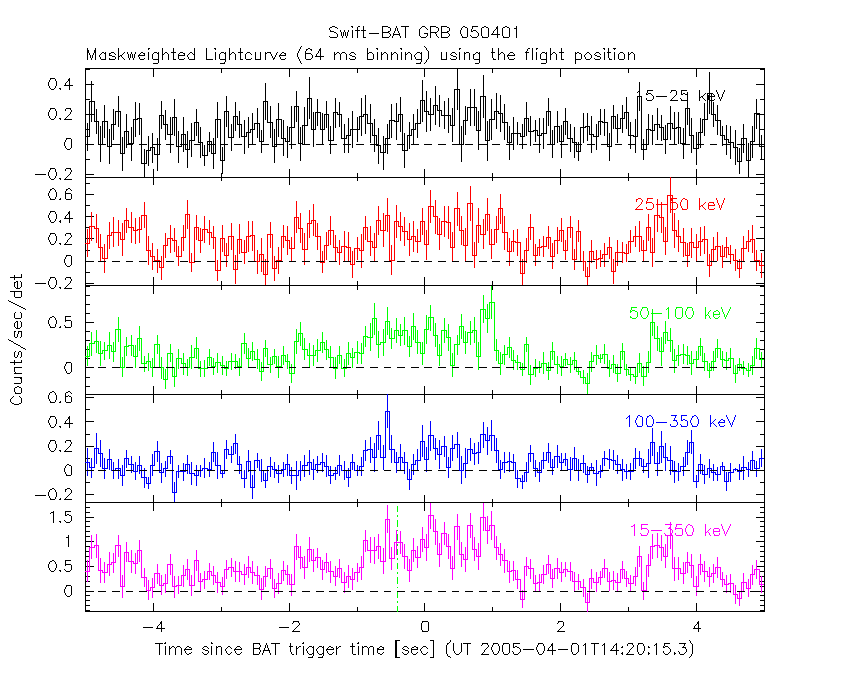
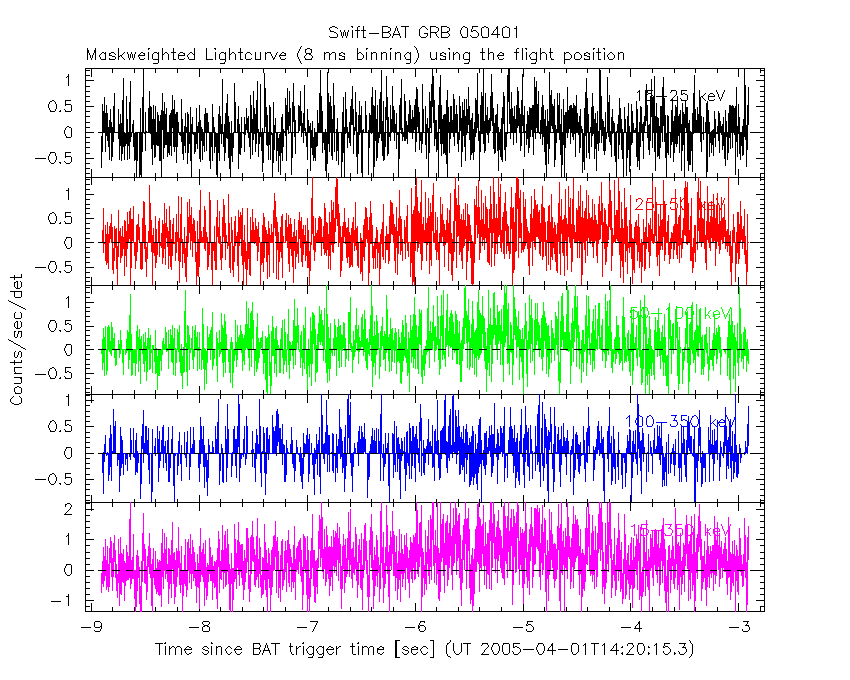
Lightcurves
Notes:
- 1) The mask-weighted light curves are using the flight position.
- 2) Multiple plots of different time binning/intervals are shown to cover all scenarios of short/long GRBs, rate/image triggers, and real/false positives.
- 3) For all the mask-weighted lightcurves, the y-axis units are counts/sec/det where a det is 0.4 x 0.4 = 0.16 sq cm.
- 4) The verticle lines correspond to following: green dotted lines are T50 interval, black dotted lines are T90 interval, blue solid line(s) is a spacecraft slew start time, and orange solid line(s) is a spacecraft slew end time.
- 5) Time of each bin is in the middle of the bin.
1 s binning
From T0-310 s to T0+310 s

From T100_start - 20 s to T100_end + 30 s

Full time interval

64 ms binning
Full time interval
From T100_start to T100_end

From T0-5 sec to T0+5 sec
16 ms binning
From T100_start-5 s to T100_start+5 s

8 ms binning
From T100_start-3 s to T100_start+3 s
2 ms binning
From T100_start-1 s to T100_start+1 s

SN=5 or 10 sec. binning (whichever binning is satisfied first)

SN=5 or 10 sec. binning (T < 200 sec)

Quad-rate summed light curves (from T0-300s to T0+1000s)

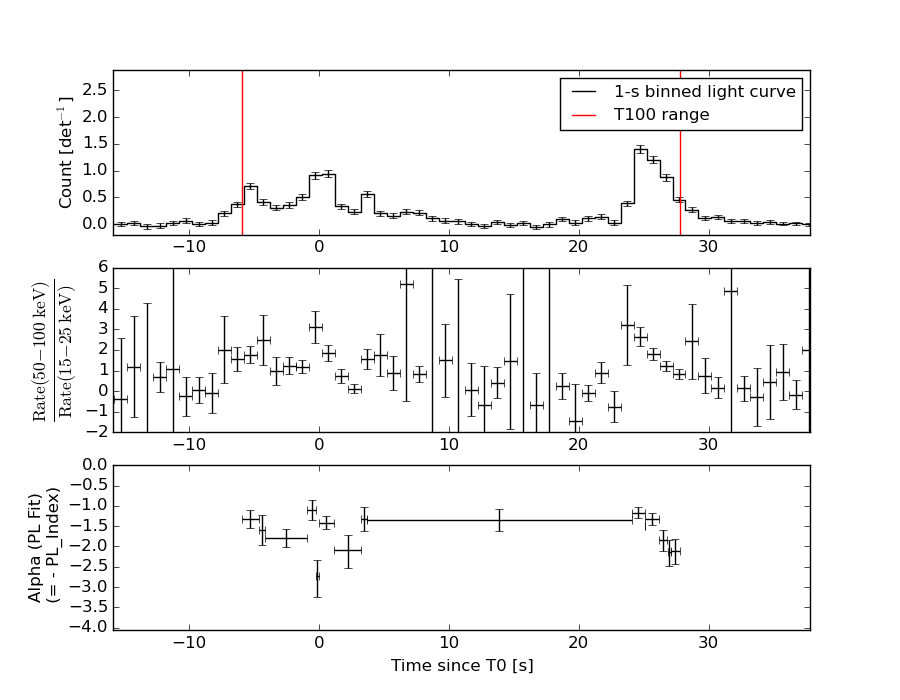
Spectral Evolution
Spectra
Notes:
- 1) The fitting includes the systematic errors.
- 2) When the burst includes telescope slew time periods, the fitting uses an average response file made from multiple 5-s response files through out the slew time plus single time preiod for the non-slew times, and weighted by the total counts in the corresponding time period using addrmf. An average response file is needed becuase a spectral fit using the pre-slew DRM will introduce some errors in both a spectral shape and a normalization if the PHA file contains a lot of the slew/post-slew time interval.
- 3) For fits to more complicated models (e.g. a power-law over a cutoff power-law), the BAT team has decided to require a chi-square improvement of more than 6 for each extra dof.
Time averaged spectrum fit using the average DRM
Power-law model

Time interval is from   -5.908 sec. to   27.804 sec.

Spectral model in power-law:
------------------------------------------------------------
Parameters  : value       lower 90%   higher 90%
Photon index: 1.38848     ( -0.075386   0.0750222 )
Norm@50keV  : 2.47658E-02    ( -0.00108759   0.00108622 )
------------------------------------------------------------
#Fit statistic : Chi-Squared =          55.44 using 59 PHA bins.
# Reduced chi-squared =         0.9726 for     57 degrees of freedom
# Null hypothesis probability =   5.339768e-01

Photon flux (15-150 keV)    in 33.71 sec: 3.00823 ( -0.146908  0.147425 ) ph/cm2/s
Energy fluence (15-150 keV)             : 8.08615e-06 ( -3.60852e-07  3.61007e-07 ) ergs/cm2
Cutoff power-law model

Time interval is from   -5.908 sec. to   27.804 sec.
Spectral model in the cutoff power-law:
------------------------------------------------------------
Parameters  : value       lower 90%   higher 90%
Photon index: 1.17321     ( -0.323698   0.247606 )
Epeak [keV] : 223.345      ( -100.176 -223.345 )
Norm@50keV  : 3.08743E-02    ( -0.00675415   0.0117449 )
------------------------------------------------------------
#Fit statistic : Chi-Squared =          54.00 using 59 PHA bins.
# Reduced chi-squared =         0.9642 for     56 degrees of freedom
# Null hypothesis probability =   5.511284e-01

Photon flux (15-150 keV)    in 33.71 sec: 2.97556 ( -0.15307  0.15378 ) ph/cm2/s
Energy fluence (15-150 keV)             : 8.0425e-06 ( -3.70271e-07  3.68922e-07 ) ergs/cm2
Band function

Time interval is from   -5.908 sec. to   27.804 sec.

Spectral model in the Band function:
------------------------------------------------------------
Parameters  : value       lower 90%   higher 90%
alpha       : -0.797942   ( -0.499478   5.6845 )
beta        : -1.54109    ( 1.54111   0.165905 )
Epeak [keV] : 97.4759      ( -48.6883 249.05 )
Norm@50keV   : 4.90517E-02    ( -0.0227474   0.27115 )
------------------------------------------------------------
#Fit statistic : Chi-Squared =          51.90 using 59 PHA bins.
# Reduced chi-squared =         0.9436 for     55 degrees of freedom
# Null hypothesis probability =   5.939359e-01

Photon flux (15-150 keV)    in 33.71 sec:  (    ) ph/cm2/s
Energy fluence (15-150 keV)             : 0 ( 0  0 ) ergs/cm2
Single BB

Spectral model blackbody:
------------------------------------------------------------
Parameters  : value    Lower 90%  Upper 90%
kT [keV]    : 18.5471  (  )
R^2/D10^2   : 0.169928  (   )
(R is the radius in km and D10 is the distance to the source in units of 10 kpc)
------------------------------------------------------------
#Fit statistic : Chi-Squared =         161.66 using 59 PHA bins.
# Reduced chi-squared =         2.8362 for     57 degrees of freedom
# Null hypothesis probability =   5.912850e-12

Energy  Fluence     90% Error
[keV]   [erg/cm2]   [erg/cm2]
15- 25  3.906e-07   3.573e-08
25- 50  1.847e-06   1.222e-07
50-150  4.645e-06   3.219e-07
15-150  6.882e-06   3.405e-07
Thermal bremsstrahlung (OTTB)

Spectral model: thermal bremsstrahlung
------------------------------------------------------------
Parameters  : value         Lower 90%    Upper 90%
kT [keV]    : 200.000       (      )
Norm        : 12.7817       (-0.559984     0.559784)
------------------------------------------------------------
#Fit statistic : Chi-Squared =          74.11 using 59 PHA bins.
# Reduced chi-squared =          1.300 for     57 degrees of freedom
# Null hypothesis probability =   6.342631e-02

Energy  Fluence     90% Error
[keV]   [erg/cm2]   [erg/cm2]
15- 25  1.073e-06   5.781e-08
25- 50  2.065e-06   1.094e-07
50-150  4.528e-06   2.309e-07
15-150  7.666e-06   3.826e-07
Double BB

Spectral model: bbodyrad<1> + bbodyrad<2>
------------------------------------------------------------
Parameters  : value         Lower 90%    Upper 90%
kT1 [keV]   : 10.6305        (-1.93346      1.95019)
R1^2/D10^2  : 0.804723        (-0.295535      0.62242)
kT2 [keV]   : 44.4928        (-12.7469      48.0527)
R2^2/D10^2  : 6.75737E-03    (-0.00551527   0.00774135)
------------------------------------------------------------
#Fit statistic : Chi-Squared =          58.20 using 59 PHA bins.
# Reduced chi-squared =          1.058 for     55 degrees of freedom
# Null hypothesis probability =   3.583286e-01

Energy  Fluence     90% Error
[keV]   [erg/cm2]   [erg/cm2]
15- 25  6.895e-07   9.692e-08
25- 50  2.097e-06   2.719e-07
50-150  5.160e-06   1.709e-06
15-150  7.946e-06   1.953e-06
Peak spectrum fit
Power-law model

Time interval is from   24.272 sec. to   25.272 sec.

Spectral model in power-law:
------------------------------------------------------------
Parameters  : value       lower 90%   higher 90%
Photon index: 1.14311     ( -0.130507   0.128882 )
Norm@50keV  : 0.107262    ( -0.00911817   0.00909533 )
------------------------------------------------------------
#Fit statistic : Chi-Squared =          71.50 using 59 PHA bins.
# Reduced chi-squared =          1.254 for     57 degrees of freedom
# Null hypothesis probability =   9.364115e-02

Photon flux (15-150 keV)    in 1 sec: 12.4988 ( -1.10996  1.11333 ) ph/cm2/s
Energy fluence (15-150 keV)             : 1.10651e-06 ( -9.56281e-08  9.57241e-08 ) ergs/cm2
Cutoff power-law model

Time interval is from   24.272 sec. to   25.272 sec.
Spectral model in the cutoff power-law:
------------------------------------------------------------
Parameters  : value       lower 90%   higher 90%
Photon index: 6.65530E-02     ( -0.693575   0.598546 )
Epeak [keV] : 107.979      ( -21.1666 59.3578 )
Norm@50keV  : 0.312041    ( -0.136705   0.286788 )
------------------------------------------------------------
#Fit statistic : Chi-Squared =          61.17 using 59 PHA bins.
# Reduced chi-squared =          1.092 for     56 degrees of freedom
# Null hypothesis probability =   2.958049e-01

Photon flux (15-150 keV)    in 1 sec: 12.1734 ( -1.1151  1.1211 ) ph/cm2/s
Energy fluence (15-150 keV)             : 1.0988e-06 ( -9.9528e-08  9.894e-08 ) ergs/cm2
Band function

Time interval is from   24.272 sec. to   25.272 sec.

Spectral model in the Band function:
------------------------------------------------------------
Parameters  : value       lower 90%   higher 90%
alpha       : 0.209136   ( -0.835188   -0.210476 )
beta        : -1.84627    ( 1.84497   0.505867 )
Epeak [keV] : 91.7014      ( -44.8651 66.1007 )
Norm@50keV   : 0.435657    ( -0.255635   330.19 )
------------------------------------------------------------
#Fit statistic : Chi-Squared =          60.87 using 59 PHA bins.
# Reduced chi-squared =          1.107 for     55 degrees of freedom
# Null hypothesis probability =   2.729120e-01

Photon flux (15-150 keV)    in 1 sec: 12.0585 ( -5.0585  -1.1376 ) ph/cm2/s
Energy fluence (15-150 keV)             : 1.08799e-06 ( -1.08798e-06  -9.7975e-08 ) ergs/cm2
Single BB

Spectral model blackbody:
------------------------------------------------------------
Parameters  : value    Lower 90%  Upper 90%
kT [keV]    : 21.0782  (-1.90723  2.14499)
R^2/D10^2   : 0.530892  (-0.146833   0.196439)
(R is the radius in km and D10 is the distance to the source in units of 10 kpc)
------------------------------------------------------------
#Fit statistic : Chi-Squared =          71.80 using 59 PHA bins.
# Reduced chi-squared =          1.260 for     57 degrees of freedom
# Null hypothesis probability =   8.960786e-02

Energy  Fluence     90% Error
[keV]   [erg/cm2]   [erg/cm2]
15- 25  4.449e-08   7.570e-09
25- 50  2.292e-07   2.835e-08
50-150  7.593e-07   9.425e-08
15-150  1.033e-06   1.023e-07
Thermal bremsstrahlung (OTTB)

Spectral model: thermal bremsstrahlung
------------------------------------------------------------
Parameters  : value         Lower 90%    Upper 90%
kT [keV]    : 200.000       (      )
Norm        : 53.1228       (-4.57862     4.57781)
------------------------------------------------------------
#Fit statistic : Chi-Squared =          96.45 using 59 PHA bins.
# Reduced chi-squared =          1.692 for     57 degrees of freedom
# Null hypothesis probability =   8.544737e-04

Energy  Fluence     90% Error
[keV]   [erg/cm2]   [erg/cm2]
15- 25  1.322e-07   1.220e-08
25- 50  2.544e-07   3.745e-08
50-150  5.579e-07   1.991e-07
15-150  9.445e-07   2.042e-07
Double BB

Spectral model: bbodyrad<1> + bbodyrad<2>
------------------------------------------------------------
Parameters  : value         Lower 90%    Upper 90%
kT1 [keV]   : 10.6270        (-5.12869      7.12927)
R1^2/D10^2  : 2.18142        (-1.38662      11.9779)
kT2 [keV]   : 30.0310        (-7.43025      -30.1599)
R2^2/D10^2  : 0.126117    (-0.122415   0.259271)
------------------------------------------------------------
#Fit statistic : Chi-Squared =          61.06 using 59 PHA bins.
# Reduced chi-squared =          1.110 for     55 degrees of freedom
# Null hypothesis probability =   2.672013e-01

Energy  Fluence     90% Error
[keV]   [erg/cm2]   [erg/cm2]
15- 25  6.886e-08   3.793e-08
25- 50  2.478e-07   1.291e-07
50-150  7.845e-07   4.079e-07
15-150  1.101e-06   5.615e-07
Pre-slew spectrum (Pre-slew PHA with pre-slew DRM)
Power-law model

Spectral model in power-law:
------------------------------------------------------------
Parameters  : value       lower 90%   higher 90%
Photon index: 1.36293     ( -0.0871607   0.0865284 )
Norm@50keV  : 2.11941E-02    ( -0.00108522   0.00108332 )
------------------------------------------------------------
#Fit statistic : Chi-Squared =          66.70 using 59 PHA bins.
# Reduced chi-squared =          1.170 for     57 degrees of freedom
# Null hypothesis probability =   1.780468e-01

Photon flux (15-150 keV)    in 31.22 sec: 2.56018 ( -0.144888  0.145446 ) ph/cm2/s
Energy fluence (15-150 keV)             : 6.444e-06 ( -3.34816e-07  3.35019e-07 ) ergs/cm2
Cutoff power-law model

Spectral model in the cutoff power-law:
------------------------------------------------------------
Parameters  : value       lower 90%   higher 90%
Photon index: 1.09909     ( -0.384681   0.300281 )
Epeak [keV] : 197.442      ( -84.2461 -197.455 )
Norm@50keV  : 2.78162E-02    ( -0.00718797   0.0130844 )
------------------------------------------------------------
#Fit statistic : Chi-Squared =          65.13 using 59 PHA bins.
# Reduced chi-squared =          1.163 for     56 degrees of freedom
# Null hypothesis probability =   1.889658e-01

Photon flux (15-150 keV)    in 31.22 sec: 2.52872 ( -0.15022  0.15094 ) ph/cm2/s
Energy fluence (15-150 keV)             : 6.40022e-06 ( -3.44606e-07  3.43077e-07 ) ergs/cm2
Band function

Spectral model in the Band function:
------------------------------------------------------------
Parameters  : value       lower 90%   higher 90%
alpha       : -0.683360   ( -0.552657   0.677082 )
beta        : -1.55751    ( 1.55433   0.199281 )
Epeak [keV] : 94.4014      ( -45.5686 180.056 )
Norm@50keV   : 4.61673E-02    ( -0.0250616   6.259 )
------------------------------------------------------------
#Fit statistic : Chi-Squared =          62.65 using 59 PHA bins.
# Reduced chi-squared =          1.139 for     55 degrees of freedom
# Null hypothesis probability =   2.234525e-01

Photon flux (15-150 keV)    in 31.22 sec:  (    ) ph/cm2/s
Energy fluence (15-150 keV)             : 0 ( 0  0 ) ergs/cm2
S(25-50 keV) vs. S(50-100 keV) plot
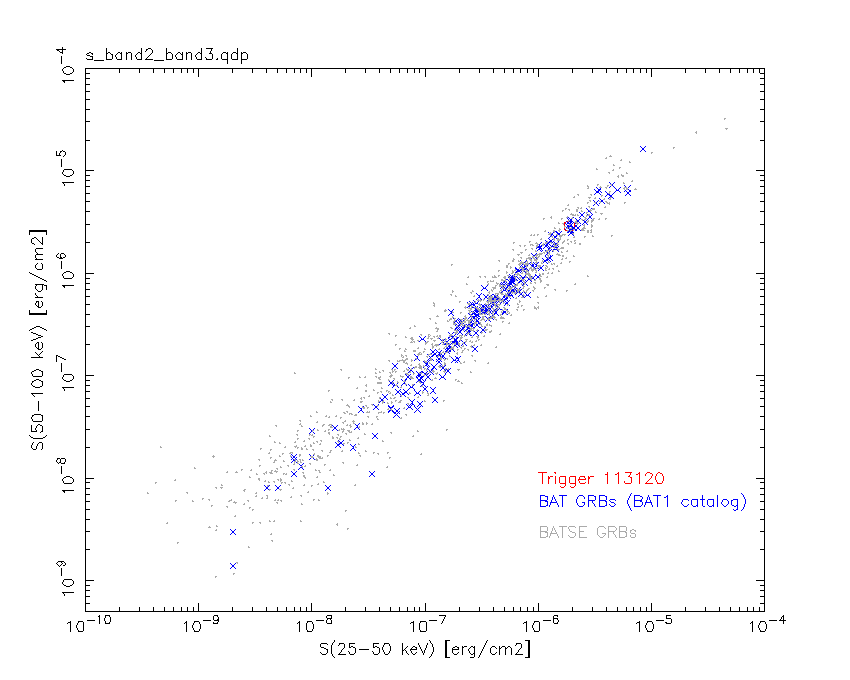
S(25-50 keV)  = 1.89e-06
S(50-100 keV) = 2.89e-06
T90 vs. Hardness ratio plot

T90                                   = 32.0920000076294 sec.
Hardness ratio (energy fluence ratio) = 1.5291
Color vs. Color plot

Count Ratio  (25-50 keV) / (15-25 keV) = 1.69068
Count Ratio (50-100 keV) / (15-25 keV) = 1.67572
Mask shadow pattern

IMX = 1.457314487497005E+00, IMY = -1.432755237830371E-01
TIME vs. PHA plot around the trigger time

TIME vs. DetID plot around the trigger time

100 us light curve (15-350 keV)

Spacecraft aspect plot

Bright source in the pre-burst/pre-slew/post-slew images
Pre-burst image of 15-350 keV band
Time interval of the image:
-299.784000 -5.908000

# RAcent  DECcent POSerr Theta    Phi  PeakCts   SNR AngSep     Name
#  [deg]    [deg]    ['] [deg]  [deg]                   [']
254.5448  35.2573    8.9  53.7  -35.9  -1.2636  -1.3    6.7	Her X-1
151.8041  11.6414    2.5  41.8  165.3   1.3466   4.6 ------	UNKNOWN
137.4834  12.9771    2.6  54.6  173.1   3.2350   4.4 ------	UNKNOWN
183.1822  16.8375    3.0  11.7  148.0   0.5427   3.9 ------	UNKNOWN
224.1733  12.9728    2.5  29.9    5.1   0.8096   4.6 ------	UNKNOWN
242.5756  11.5984    4.3  47.2   -2.9   0.8371   2.7 ------	UNKNOWN
168.7902  61.8461    2.4  43.5 -114.6   3.5621   4.8 ------	UNKNOWN
161.2027  60.4952    3.1  44.8 -119.9   2.6957   3.7 ------	UNKNOWN
193.2879  63.1356    3.9  41.1  -98.2   2.6871   3.0 ------	UNKNOWN
Pre-slew background subtracted image of 15-350 keV band
Time interval of the image:
-5.908000 25.316590

# RAcent  DECcent POSerr Theta    Phi  PeakCts   SNR AngSep     Name
#  [deg]    [deg]    ['] [deg]  [deg]                   [']
254.6236  35.3185   14.4  53.8  -35.9  -0.1995  -0.8    8.3	Her X-1
153.5100  -3.8473    2.3  47.5  144.6   0.9587   5.1 ------	UNKNOWN
247.8733   2.1866    0.5  55.7    5.6   8.8301  23.5 ------	UNKNOWN
217.5194  30.6845    2.6  22.5  -35.0   0.2369   4.5 ------	UNKNOWN
143.7368  54.6930    2.0  49.7 -133.3   1.4040   5.7 ------	UNKNOWN
Post-slew image of 15-350 keV band
Time interval of the image:
112.516600 302.320400

# RAcent  DECcent POSerr Theta    Phi  PeakCts   SNR AngSep     Name
#  [deg]    [deg]    ['] [deg]  [deg]                   [']
244.9857 -15.6385    0.2  18.0   16.2  11.0520  71.8    0.4	Sco X-1
254.4404  35.3673    5.6  33.7 -163.2  -0.4122  -2.0    1.7	Her X-1
255.9869 -37.8450  165.7  40.7   -2.7   0.0176   0.1    0.1	4U 1700-377
256.4679 -36.4674    3.7  39.5   -3.7   0.7201   3.1    3.1	GX 349+2
263.0291 -24.5901    7.4  30.5  -20.7   0.2874   1.6    9.4	GX 1+4
264.6068 -44.4751    4.8  49.0   -8.6   0.8120   2.4    6.0	4U 1735-44
268.5305  -1.5718    0.0  21.0  -72.7   0.0946   0.5   12.1	SW J1753.5-0127
270.3015 -25.0984    2.7  34.9  -30.0   0.8393   4.2    1.5	GX 5-1
270.2950 -25.7206    3.6  35.3  -29.3   0.6668   3.2    1.4	GRS 1758-258
274.1235 -13.9727    6.7  30.6  -50.3   0.3824   1.7    7.8	GX 17+2
276.0191 -30.4674    5.8  42.2  -30.0  -0.5518  -2.0    7.7	H1820-303
284.9467 -24.8135    8.8  44.9  -43.6   0.5542   1.3    8.1	HT1900.1-2455
262.8444 -33.8346    6.2  38.7  -12.9   0.3855   1.9    7.2	GX 354-0
273.6578   5.2964    3.0  25.9  -90.5   0.8545   3.8 ------	UNKNOWN
264.7583  60.1315    4.5  59.4 -163.2   3.7391   2.6 ------	UNKNOWN
290.3975 -19.6874    3.2  47.1  -53.1   2.6502   3.6 ------	UNKNOWN
Plot creation:
Sun May 31 17:09:02 EDT 2015