Estimated redshift from machine learning (Ukwatta et al. 2016) - may take a few minute to calcaulte
Image
Pre-slew 15.0-350.0 keV image (Event data)

#   RAcent    DECcent   POSerr    Theta     Phi              Peak Cts       SNR   Name
  225.6007    47.4526   0.0125    42.6614   177.4083         1.0924919     15.341 TRIG_01131397

Foreground time interval of the image:
 -6.544   4.192 (delta_t =  10.736 [sec])
Background time interval of the image:
-239.896  -6.544 (delta_t = 233.352 [sec])
Lightcurves
Notes:
- 1) The mask-weighted light curves are using the flight position.
- 2) Multiple plots of different time binning/intervals are shown to cover all scenarios of short/long GRBs, rate/image triggers, and real/false positives.
- 3) For all the mask-weighted lightcurves, the y-axis units are counts/sec/det where a det is 0.4 x 0.4 = 0.16 sq cm.
- 4) The verticle lines correspond to following: green dotted lines are T50 interval, black dotted lines are T90 interval, blue solid line(s) is a spacecraft slew start time, and orange solid line(s) is a spacecraft slew end time.
- 5) Time of each bin is in the middle of the bin.
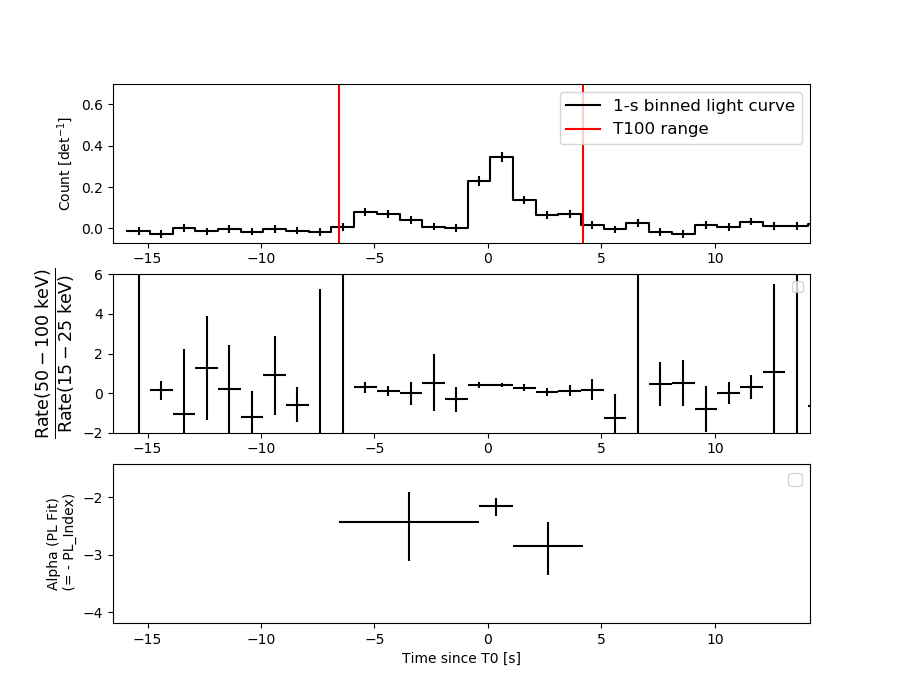
1 s binning
From T0-310 s to T0+310 s
From T100_start - 20 s to T100_end + 30 s

Full time interval

64 ms binning
Full time interval

From T100_start to T100_end
From T0-5 sec to T0+5 sec

16 ms binning
From T100_start-5 s to T100_start+5 s

Blue+Cyan dotted lines: Time interval of the scaled map
From 0.000000 to 1.024000
8 ms binning
From T100_start-3 s to T100_start+3 s
Blue+Cyan dotted lines: Time interval of the scaled map
From 0.000000 to 1.024000
2 ms binning
From T100_start-1 s to T100_start+1 s
Blue+Cyan dotted lines: Time interval of the scaled map
From 0.000000 to 1.024000
SN=5 or 10 sec. binning (whichever binning is satisfied first)
SN=5 or 10 sec. binning (T < 200 sec)
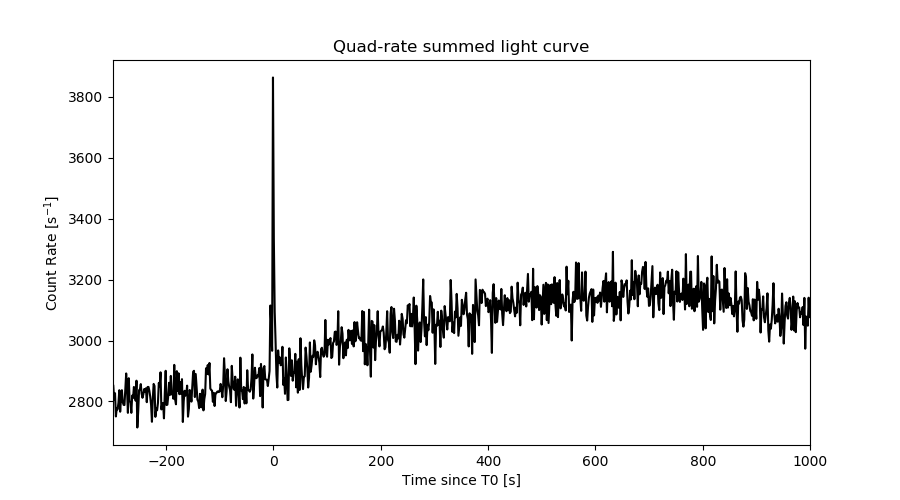
Quad-rate summed light curves (from T0-300s to T0+1000s)
Spectral Evolution
Spectra
Notes:
- 1) The fitting includes the systematic errors.
- 2) When the burst includes telescope slew time periods, the fitting uses an average response file made from multiple 5-s response files through out the slew time plus single time preiod for the non-slew times, and weighted by the total counts in the corresponding time period using addrmf. An average response file is needed becuase a spectral fit using the pre-slew DRM will introduce some errors in both a spectral shape and a normalization if the PHA file contains a lot of the slew/post-slew time interval.
- 3) For fits to more complicated models (e.g. a power-law over a cutoff power-law), the BAT team has decided to require a chi-square improvement of more than 6 for each extra dof.
Time averaged spectrum fit using the average DRM
Power-law model

Time interval is from   -6.544 sec. to    4.192 sec.

Spectral model in power-law:
------------------------------------------------------------
Parameters  : value       lower 90%   higher 90%
Photon index: 2.36473     ( -0.190677   0.204468 )
Norm@50keV  : 5.52053E-03    ( -0.000791552   0.000777669 )
------------------------------------------------------------
#Fit statistic  : Chi-Squared                   67.35     using 59 bins.
 Reduced chi-squared = 1.18158
# Null hypothesis probability of 1.64e-01 with 57 degrees of freedom

Photon flux (15-150 keV)    in 10.74 sec: 1.00087 ( -0.098182  0.09822 ) ph/cm2/s
Energy fluence (15-150 keV)             : 5.74029e-07 ( -6.56309e-08  6.68913e-08 ) ergs/cm2
Cutoff power-law model

Time interval is from   -6.544 sec. to    4.192 sec.
Spectral model in the cutoff power-law:
------------------------------------------------------------
Parameters  : value       lower 90%   higher 90%
Photon index: 1.13679     ( -1.88387   0.86577 )
Epeak [keV] : 25.1245      ( -24.1824 7.44396 )
Norm@50keV  : 3.28811E-02    ( -0.0335534   0.564364 )
------------------------------------------------------------
#Fit statistic  : Chi-Squared                   63.82     using 59 bins.
 Reduced chi-squared = 1.13964
# Null hypothesis probability of 2.21e-01 with 56 degrees of freedom

Photon flux (15-150 keV)    in 10.74 sec: 0.963126 ( -0.105214  0.104544 ) ph/cm2/s
Energy fluence (15-150 keV)             : 0 ( 0  0 ) ergs/cm2
Band function

Time interval is from   -6.544 sec. to    4.192 sec.


Spectral model in the Band function:
------------------------------------------------------------
Parameters  : value       lower 90%   higher 90%
alpha       :    (     )
beta        :     (     )
Epeak [keV] :       (   )
Norm@50keV   :     (     )
------------------------------------------------------------

Photon flux (15-150 keV)    in  sec:  (    ) ph/cm2/s
Energy fluence (15-150 keV)             : 0 ( 0  0 ) ergs/cm2
Single BB
Spectral model blackbody:
------------------------------------------------------------
Parameters  : value    Lower 90%  Upper 90%
kT [keV]    : 7.52437  (-0.730496  0.817785)
R^2/D10^2   : 1.41199  (-0.492905   0.7513)
(R is the radius in km and D10 is the distance to the source in units of 10 kpc)
------------------------------------------------------------
#Fit statistic  : Chi-Squared                   68.99     using 59 bins.
 Reduced chi-squared =
# Null hypothesis probability of 1.33e-01 with 57 degrees of freedom

Energy  Fluence     90% Error
[keV]   [erg/cm2]   [erg/cm2]
15- 25  1.478e-07   2.443e-08
25- 50  2.319e-07   3.147e-08
50-150  4.955e-08   1.580e-08
15-150  4.292e-07   5.268e-08
Thermal bremsstrahlung (OTTB)
Spectral model: thermal bremsstrahlung
------------------------------------------------------------
Parameters  : value         Lower 90%    Upper 90%
kT [keV]    : 36.7468       (-7.89034      10.9632)
Norm        : 6.86815       (-1.27848     1.63202)
------------------------------------------------------------
#Fit statistic  : Chi-Squared                   63.79     using 59 bins.
 Reduced chi-squared =
# Null hypothesis probability of 2.50e-01 with 57 degrees of freedom

Energy  Fluence     90% Error
[keV]   [erg/cm2]   [erg/cm2]
15- 25  1.643e-07   2.100e-08
25- 50  2.081e-07   2.411e-08
50-150  1.463e-07   4.235e-08
15-150  5.187e-07   6.320e-08
Double BB
Spectral model: bbodyrad<1> + bbodyrad<2>
------------------------------------------------------------
Parameters  : value         Lower 90%    Upper 90%
kT1 [keV]   : 6.67117        (-0.902382      0.894599)
R1^2/D10^2  : 2.13144        (-0.824793      1.53534)
kT2 [keV]   : 33.7826        (-16.4217      -33.7827)
R2^2/D10^2  : 1.88536E-03    (-0.00184572   0.0189574)
------------------------------------------------------------
#Fit statistic  : Chi-Squared                   56.03     using 59 bins.
 Reduced chi-squared =
# Null hypothesis probability of 4.36e-01 with 55 degrees of freedom

Energy  Fluence     90% Error
[keV]   [erg/cm2]   [erg/cm2]
15- 25  1.586e-07   3.574e-08
25- 50  2.150e-07   4.822e-08
50-150  1.918e-07   1.026e-07
15-150  5.654e-07   1.574e-07
Peak spectrum fit
Power-law model
Time interval is from   -0.108 sec. to    0.892 sec.

Spectral model in power-law:
------------------------------------------------------------
Parameters  : value       lower 90%   higher 90%
Photon index: 2.17302     ( -0.175524   0.186274 )
Norm@50keV  : 2.10520E-02    ( -0.00289856   0.00285131 )
------------------------------------------------------------
#Fit statistic  : Chi-Squared                   69.45     using 59 bins.
 Reduced chi-squared = 1.21842
# Null hypothesis probability of 1.25e-01 with 57 degrees of freedom

Photon flux (15-150 keV)    in 1 sec: 3.43690 ( -0.37017  0.37024 ) ph/cm2/s
Energy fluence (15-150 keV)             : 1.97247e-07 ( -2.41976e-08  2.45063e-08 ) ergs/cm2
Cutoff power-law model
Time interval is from   -0.108 sec. to    0.892 sec.
Spectral model in the cutoff power-law:
------------------------------------------------------------
Parameters  : value       lower 90%   higher 90%
Photon index: 7.11754E-02     ( -1.45728   1.08917 )
Epeak [keV] : 34.6668      ( -5.4818 5.32156 )
Norm@50keV  : 0.412678    ( -0.420179   3.20779 )
------------------------------------------------------------
#Fit statistic  : Chi-Squared                   55.95     using 59 bins.
 Reduced chi-squared = 0.999107
# Null hypothesis probability of 4.77e-01 with 56 degrees of freedom

Photon flux (15-150 keV)    in 1 sec: 3.34958 ( -0.36944  0.37055 ) ph/cm2/s
Energy fluence (15-150 keV)             : 0 ( 0  0 ) ergs/cm2
Band function

Time interval is from   -0.108 sec. to    0.892 sec.


Spectral model in the Band function:
------------------------------------------------------------
Parameters  : value       lower 90%   higher 90%
alpha       :    (     )
beta        :     (     )
Epeak [keV] :       (   )
Norm@50keV   :     (     )
------------------------------------------------------------

Photon flux (15-150 keV)    in  sec:  (    ) ph/cm2/s
Energy fluence (15-150 keV)             : 0 ( 0  0 ) ergs/cm2
Single BB

Spectral model blackbody:
------------------------------------------------------------
Parameters  : value    Lower 90%  Upper 90%
kT [keV]    : 8.76768  (-0.905964  1.00317)
R^2/D10^2   : 2.85018  (-1.00236   1.54242)
(R is the radius in km and D10 is the distance to the source in units of 10 kpc)
------------------------------------------------------------
#Fit statistic  : Chi-Squared                   59.93     using 59 bins.
 Reduced chi-squared =
# Null hypothesis probability of 3.70e-01 with 57 degrees of freedom

Energy  Fluence     90% Error
[keV]   [erg/cm2]   [erg/cm2]
15- 25  4.206e-08   7.300e-09
25- 50  8.577e-08   1.122e-08
50-150  3.019e-08   9.655e-09
15-150  1.580e-07   2.095e-08
Thermal bremsstrahlung (OTTB)
Spectral model: thermal bremsstrahlung
------------------------------------------------------------
Parameters  : value         Lower 90%    Upper 90%
kT [keV]    : 47.6738       (-10.4338      15.0088)
Norm        : 20.6622       (-3.34485     4.17642)
------------------------------------------------------------
#Fit statistic  : Chi-Squared                   59.60     using 59 bins.
 Reduced chi-squared =
# Null hypothesis probability of 3.81e-01 with 57 degrees of freedom

Energy  Fluence     90% Error
[keV]   [erg/cm2]   [erg/cm2]
15- 25  4.995e-08   7.155e-09
25- 50  7.050e-08   9.155e-09
50-150  6.539e-08   1.857e-08
15-150  1.858e-07   2.525e-08
Double BB
Spectral model: bbodyrad<1> + bbodyrad<2>
------------------------------------------------------------
Parameters  : value         Lower 90%    Upper 90%
kT1 [keV]   : 6.70870        (-2.05861      1.72687)
R1^2/D10^2  : 5.95949        (-2.51882      6.66588)
kT2 [keV]   : 16.0308        (-8.32239      -19.5153)
R2^2/D10^2  : 0.107865    (-0.046446   0.689869)
------------------------------------------------------------
#Fit statistic  : Chi-Squared                   53.29     using 59 bins.
 Reduced chi-squared =
# Null hypothesis probability of 5.40e-01 with 55 degrees of freedom

Energy  Fluence     90% Error
[keV]   [erg/cm2]   [erg/cm2]
15- 25  4.687e-08   2.688e-08
25- 50  7.596e-08   4.133e-08
50-150  5.075e-08   3.152e-08
15-150  1.736e-07   9.060e-08
Pre-slew spectrum (Pre-slew PHA with pre-slew DRM)
Power-law model
Spectral model in power-law:
------------------------------------------------------------
Parameters  : value       lower 90%   higher 90%
Photon index: 2.36473     ( -0.190677   0.204468 )
Norm@50keV  : 5.52053E-03    ( -0.000791552   0.000777669 )
------------------------------------------------------------
#Fit statistic  : Chi-Squared                   67.35     using 59 bins.
 Reduced chi-squared =
# Null hypothesis probability of 1.64e-01 with 57 degrees of freedom

Photon flux (15-150 keV)    in 10.74 sec: 1.00075 ( -0.0981671  0.0982031 ) ph/cm2/s
Energy fluence (15-150 keV)             : 5.73897e-07 ( -6.55984e-08  6.69081e-08 ) ergs/cm2
Cutoff power-law model
Spectral model in the cutoff power-law:
------------------------------------------------------------
Parameters  : value       lower 90%   higher 90%
Photon index: 1.14307     ( -1.88857   0.876308 )
Epeak [keV] : 25.0821      ( -23.3818 7.46552 )
Norm@50keV  : 3.25683E-02    ( -0.0334431   0.564578 )
------------------------------------------------------------
#Fit statistic  : Chi-Squared                   63.82     using 59 bins.
 Reduced chi-squared =
# Null hypothesis probability of 2.21e-01 with 56 degrees of freedom

Photon flux (15-150 keV)    in 10.74 sec: 0.962795 ( -0.105119  0.104515 ) ph/cm2/s
Energy fluence (15-150 keV)             : 5.08854e-07 ( -7.85191e-08  8.81367e-08 ) ergs/cm2
Band function
Spectral model in the Band function:
------------------------------------------------------------
Parameters  : value       lower 90%   higher 90%
alpha       :    (     )
beta        :     (     )
Epeak [keV] :       (   )
Norm@50keV   :     (     )
------------------------------------------------------------

Photon flux (15-150 keV)    in  sec:  (    ) ph/cm2/s
Energy fluence (15-150 keV)             : 0 ( 0  0 ) ergs/cm2
S(25-50 keV) vs. S(50-100 keV) plot

S(25-50 keV)  = 1.87e-07
S(50-100 keV) = 1.45e-07
T90 vs. Hardness ratio plot

T90                                   = 8.84800004959106 sec.
Hardness ratio (energy fluence ratio) = 0.775401
Color vs. Color plot
Count Ratio  (25-50 keV) / (15-25 keV) = 1.13114
Count Ratio (50-100 keV) / (15-25 keV) = 0.350805
Mask shadow pattern

IMX = -9.205829732229645E-01, IMY = -4.167005463225783E-02
TIME vs. PHA plot around the trigger time

Blue+Cyan dotted lines: Time interval of the scaled map
From 0.000000 to 1.024000
TIME vs. DetID plot around the trigger time
Blue+Cyan dotted lines: Time interval of the scaled map
From 0.000000 to 1.024000
100 us light curve (15-350 keV)

Blue+Cyan dotted lines: Time interval of the scaled map
From 0.000000 to 1.024000
Spacecraft aspect plot
Bright source in the pre-burst/pre-slew/post-slew images
Pre-burst image of 15-350 keV band
Time interval of the image:
-239.896000 -6.544000

# RAcent  DECcent POSerr Theta    Phi  PeakCts   SNR AngSep     Name
#  [deg]    [deg]    ['] [deg]  [deg]                   [']
156.9907  42.6781    4.6  27.2   92.3   2.1664   2.6 ------	UNKNOWN
166.2179  28.7559    3.5  13.8   66.6   2.0178   3.3 ------	UNKNOWN
177.6817 -15.9416    2.1  39.9  -42.9   5.8973   5.4 ------	UNKNOWN
Pre-slew background subtracted image of 15-350 keV band
Time interval of the image:
-6.544000 4.192000

# RAcent  DECcent POSerr Theta    Phi  PeakCts   SNR AngSep     Name
#  [deg]    [deg]    ['] [deg]  [deg]                   [']
225.6007  47.4526    0.7  42.7  177.4   1.0926  15.3 ------	UNKNOWN
Post-slew image of 15-350 keV band
Time interval of the image:
108.604600 962.235100

# RAcent  DECcent POSerr Theta    Phi  PeakCts   SNR AngSep     Name
#  [deg]    [deg]    ['] [deg]  [deg]                   [']
254.3998  35.5384    0.0  24.5 -176.1   1.5570   0.7   12.1	Her X-1
256.1016  11.6805    2.8  44.0 -150.5  19.8647   4.1 ------	UNKNOWN
Plot creation:
Wed Jun 14 13:57:48 EDT 2023