Estimated redshift from machine learning (Ukwatta et al. 2016) - may take a few minute to calcaulte
Image
Pre-slew 15.0-350.0 keV image (Event data)

#   RAcent    DECcent   POSerr    Theta     Phi              Peak Cts       SNR   Name
   41.3625    43.2405   0.0152    14.9680   -25.7135         0.1851061     12.658 TRIG_01141030

Foreground time interval of the image:
 -0.604   0.272 (delta_t =   0.876 [sec])
Background time interval of the image:
-84.699  -0.604 (delta_t =  84.095 [sec])
Lightcurves
Notes:
- 1) The mask-weighted light curves are using the flight position.
- 2) Multiple plots of different time binning/intervals are shown to cover all scenarios of short/long GRBs, rate/image triggers, and real/false positives.
- 3) For all the mask-weighted lightcurves, the y-axis units are counts/sec/det where a det is 0.4 x 0.4 = 0.16 sq cm.
- 4) The verticle lines correspond to following: green dotted lines are T50 interval, black dotted lines are T90 interval, blue solid line(s) is a spacecraft slew start time, and orange solid line(s) is a spacecraft slew end time.
- 5) Time of each bin is in the middle of the bin.
1 s binning
From T0-310 s to T0+310 s

From T100_start - 20 s to T100_end + 30 s

Full time interval

64 ms binning
Full time interval

From T100_start to T100_end

From T0-5 sec to T0+5 sec

16 ms binning
From T100_start-5 s to T100_start+5 s

Blue+Cyan dotted lines: Time interval of the scaled map
From 0.000000 to 0.256000
8 ms binning
From T100_start-3 s to T100_start+3 s

Blue+Cyan dotted lines: Time interval of the scaled map
From 0.000000 to 0.256000
2 ms binning
From T100_start-1 s to T100_start+1 s

Blue+Cyan dotted lines: Time interval of the scaled map
From 0.000000 to 0.256000
SN=5 or 10 sec. binning (whichever binning is satisfied first)

SN=5 or 10 sec. binning (T < 200 sec)

Quad-rate summed light curves (from T0-300s to T0+1000s)

Spectral Evolution

Spectra
Notes:
- 1) The fitting includes the systematic errors.
- 2) When the burst includes telescope slew time periods, the fitting uses an average response file made from multiple 5-s response files through out the slew time plus single time preiod for the non-slew times, and weighted by the total counts in the corresponding time period using addrmf. An average response file is needed becuase a spectral fit using the pre-slew DRM will introduce some errors in both a spectral shape and a normalization if the PHA file contains a lot of the slew/post-slew time interval.
- 3) For fits to more complicated models (e.g. a power-law over a cutoff power-law), the BAT team has decided to require a chi-square improvement of more than 6 for each extra dof.
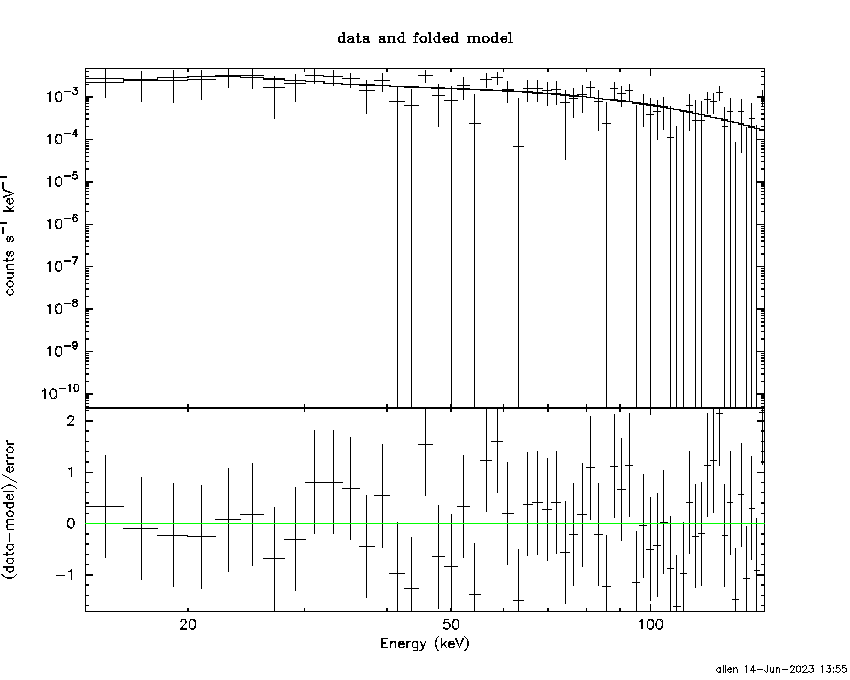
Time averaged spectrum fit using the average DRM
Power-law model

Time interval is from   -0.604 sec. to    0.272 sec.

Spectral model in power-law:
------------------------------------------------------------
Parameters  : value       lower 90%   higher 90%
Photon index: 0.846208     ( -0.274296   0.26011 )
Norm@50keV  : 1.15558E-02    ( -0.00170997   0.00169276 )
------------------------------------------------------------
#Fit statistic  : Chi-Squared                   54.83     using 59 bins.
 Reduced chi-squared = 0.96193
# Null hypothesis probability of 5.57e-01 with 57 degrees of freedom

Photon flux (15-150 keV)    in 0.876 sec: 1.32657 ( -0.19364  0.19414 ) ph/cm2/s
Energy fluence (15-150 keV)             : 1.16071e-07 ( -1.84586e-08  1.86249e-08 ) ergs/cm2
Cutoff power-law model

Time interval is from   -0.604 sec. to    0.272 sec.
Spectral model in the cutoff power-law:
------------------------------------------------------------
Parameters  : value       lower 90%   higher 90%
Photon index: 0.839452     ( -0.993253   0.328542 )
Epeak [keV] : 9999.31      ( -9999.32 -9999.32 )
Norm@50keV  : 1.16358E-02    ( -0.0116358   0.0201885 )
------------------------------------------------------------
#Fit statistic  : Chi-Squared                   54.83     using 59 bins.
 Reduced chi-squared = 0.979107
# Null hypothesis probability of 5.19e-01 with 56 degrees of freedom

Photon flux (15-150 keV)    in 0.876 sec: 1.32835 ( -0.20203  0.1945 ) ph/cm2/s
Energy fluence (15-150 keV)             : 9.60429e-09 ( -9.60429e-09  1.11135e-08 ) ergs/cm2
Band function

Time interval is from   -0.604 sec. to    0.272 sec.


Spectral model in the Band function:
------------------------------------------------------------
Parameters  : value       lower 90%   higher 90%
alpha       :    (     )
beta        :     (     )
Epeak [keV] :       (   )
Norm@50keV   :     (     )
------------------------------------------------------------

Photon flux (15-150 keV)    in  sec:  (    ) ph/cm2/s
Energy fluence (15-150 keV)             : 0 ( 0  0 ) ergs/cm2
Single BB

Spectral model blackbody:
------------------------------------------------------------
Parameters  : value    Lower 90%  Upper 90%
kT [keV]    : 24.8006  (-4.85159  6.91021)
R^2/D10^2   : 3.37344E-02  (-0.0172286   0.031395)
(R is the radius in km and D10 is the distance to the source in units of 10 kpc)
------------------------------------------------------------
#Fit statistic  : Chi-Squared                   63.33     using 59 bins.
 Reduced chi-squared =
# Null hypothesis probability of 2.63e-01 with 57 degrees of freedom

Energy  Fluence     90% Error
[keV]   [erg/cm2]   [erg/cm2]
15- 25  3.171e-09   9.785e-10
25- 50  1.792e-08   4.726e-09
50-150  8.180e-08   2.285e-08
15-150  1.029e-07   2.385e-08
Thermal bremsstrahlung (OTTB)

Spectral model: thermal bremsstrahlung
------------------------------------------------------------
Parameters  : value         Lower 90%    Upper 90%
kT [keV]    : 200.000       (-34.3158      -200)
Norm        : 5.15154       (-0.794542     0.794542)
------------------------------------------------------------
#Fit statistic  : Chi-Squared                   73.82     using 59 bins.
 Reduced chi-squared =
# Null hypothesis probability of 6.63e-02 with 57 degrees of freedom

Energy  Fluence     90% Error
[keV]   [erg/cm2]   [erg/cm2]
15- 25  1.123e-08   6.544e-09
25- 50  2.161e-08   1.220e-08
50-150  4.739e-08   2.682e-08
15-150  8.024e-08   4.555e-08
Double BB

Spectral model: bbodyrad<1> + bbodyrad<2>
------------------------------------------------------------
Parameters  : value         Lower 90%    Upper 90%
kT1 [keV]   : 9.00248        (-4.42016      7.27531)
R1^2/D10^2  : 0.407388        (-0.325784      3.31518)
kT2 [keV]   : 43.8886        (-39.3849      -43.9698)
R2^2/D10^2  : 5.69975E-03    (-0.00470565   0.0128858)
------------------------------------------------------------
#Fit statistic  : Chi-Squared                   54.64     using 59 bins.
 Reduced chi-squared =
# Null hypothesis probability of 4.88e-01 with 55 degrees of freedom

Energy  Fluence     90% Error
[keV]   [erg/cm2]   [erg/cm2]
15- 25  6.791e-09   3.922e-09
25- 50  2.009e-08   1.108e-08
50-150  9.110e-08   4.936e-08
15-150  1.180e-07   6.119e-08
Peak spectrum fit
Power-law model

Time interval is from   -0.666 sec. to    0.334 sec.

Spectral model in power-law:
------------------------------------------------------------
Parameters  : value       lower 90%   higher 90%
Photon index: 0.863431     ( -0.291511   0.275387 )
Norm@50keV  : 1.02227E-02    ( -0.00156715   0.00155015 )
------------------------------------------------------------
#Fit statistic  : Chi-Squared                   47.77     using 59 bins.
 Reduced chi-squared = 0.83807
# Null hypothesis probability of 8.03e-01 with 57 degrees of freedom

Photon flux (15-150 keV)    in 1 sec: 1.17330 ( -0.177839  0.17834 ) ph/cm2/s
Energy fluence (15-150 keV)             : 1.16405e-07 ( -1.92668e-08  1.94545e-08 ) ergs/cm2
Cutoff power-law model

Time interval is from   -0.666 sec. to    0.334 sec.
Spectral model in the cutoff power-law:
------------------------------------------------------------
Parameters  : value       lower 90%   higher 90%
Photon index: 0.856949     ( -0.80803   0.347812 )
Epeak [keV] : 1.00000E+04      ( -10000 -10000 )
Norm@50keV  : 1.02916E-02    ( -0.00157424   -0.0102921 )
------------------------------------------------------------
#Fit statistic  : Chi-Squared                   47.78     using 59 bins.
 Reduced chi-squared = 0.853214
# Null hypothesis probability of 7.75e-01 with 56 degrees of freedom

Photon flux (15-150 keV)    in 1 sec: 1.17873 ( -0.201992  0.18892 ) ph/cm2/s
Energy fluence (15-150 keV)             : 1.23914e-08 ( -1.23914e-08  9.96851e-09 ) ergs/cm2
Band function

Time interval is from   -0.666 sec. to    0.334 sec.


Spectral model in the Band function:
------------------------------------------------------------
Parameters  : value       lower 90%   higher 90%
alpha       :    (     )
beta        :     (     )
Epeak [keV] :       (   )
Norm@50keV   :     (     )
------------------------------------------------------------

Photon flux (15-150 keV)    in  sec:  (    ) ph/cm2/s
Energy fluence (15-150 keV)             : 0 ( 0  0 ) ergs/cm2
Single BB

Spectral model blackbody:
------------------------------------------------------------
Parameters  : value    Lower 90%  Upper 90%
kT [keV]    : 24.9161  (-5.22093  7.70057)
R^2/D10^2   : 2.90465E-02  (-0.015693   0.0300996)
(R is the radius in km and D10 is the distance to the source in units of 10 kpc)
------------------------------------------------------------
#Fit statistic  : Chi-Squared                   57.71     using 59 bins.
 Reduced chi-squared =
# Null hypothesis probability of 4.49e-01 with 57 degrees of freedom

Energy  Fluence     90% Error
[keV]   [erg/cm2]   [erg/cm2]
15- 25  3.138e-09   9.825e-10
25- 50  1.777e-08   5.272e-09
50-150  8.186e-08   2.643e-08
15-150  1.028e-07   2.759e-08
Thermal bremsstrahlung (OTTB)

Spectral model: thermal bremsstrahlung
------------------------------------------------------------
Parameters  : value         Lower 90%    Upper 90%
kT [keV]    : 200.000       (-37.3783      -200)
Norm        : 4.59141       (-0.730374     0.730374)
------------------------------------------------------------
#Fit statistic  : Chi-Squared                   64.32     using 59 bins.
 Reduced chi-squared =
# Null hypothesis probability of 2.36e-01 with 57 degrees of freedom

Energy  Fluence     90% Error
[keV]   [erg/cm2]   [erg/cm2]
15- 25  1.143e-08   6.595e-09
25- 50  2.199e-08   1.238e-08
50-150  4.823e-08   2.778e-08
15-150  8.165e-08   4.587e-08
Double BB
Spectral model: bbodyrad<1> + bbodyrad<2>
------------------------------------------------------------
Parameters  : value         Lower 90%    Upper 90%
kT1 [keV]   : 8.49025        (-3.74729      7.09461)
R1^2/D10^2  : 0.467758        (-0.368637      2.68304)
kT2 [keV]   : 46.7357        (-20.1346      -48.0497)
R2^2/D10^2  : 4.24177E-03    (-0.00331   0.0101297)
------------------------------------------------------------
#Fit statistic  : Chi-Squared                   47.39     using 59 bins.
 Reduced chi-squared =
# Null hypothesis probability of 7.57e-01 with 55 degrees of freedom

Energy  Fluence     90% Error
[keV]   [erg/cm2]   [erg/cm2]
15- 25  7.415e-09   4.545e-09
25- 50  1.987e-08   1.074e-08
50-150  9.039e-08   4.961e-08
15-150  1.177e-07   6.180e-08
Pre-slew spectrum (Pre-slew PHA with pre-slew DRM)
Power-law model

Spectral model in power-law:
------------------------------------------------------------
Parameters  : value       lower 90%   higher 90%
Photon index: 0.846208     ( -0.274296   0.26011 )
Norm@50keV  : 1.15558E-02    ( -0.00170997   0.00169276 )
------------------------------------------------------------
#Fit statistic  : Chi-Squared                   54.83     using 59 bins.
 Reduced chi-squared =
# Null hypothesis probability of 5.57e-01 with 57 degrees of freedom

Photon flux (15-150 keV)    in 0.876 sec: 1.32657 ( -0.193632  0.194148 ) ph/cm2/s
Energy fluence (15-150 keV)             : 1.16059e-07 ( -1.8454e-08  1.86316e-08 ) ergs/cm2
Cutoff power-law model

Spectral model in the cutoff power-law:
------------------------------------------------------------
Parameters  : value       lower 90%   higher 90%
Photon index: 0.843600     ( -0.279279   0.259464 )
Epeak [keV] : 9999.36      ( -9999.36 -9999.36 )
Norm@50keV  : 1.16382E-02    ( -0.00168828   0.020208 )
------------------------------------------------------------
#Fit statistic  : Chi-Squared                   54.83     using 59 bins.
 Reduced chi-squared =
# Null hypothesis probability of 5.19e-01 with 56 degrees of freedom

Photon flux (15-150 keV)    in 0.876 sec: 1.32677 ( -0.19576  0.19282 ) ph/cm2/s
Energy fluence (15-150 keV)             : 1.16034e-07 ( -1.91371e-08  1.86185e-08 ) ergs/cm2
Band function

Spectral model in the Band function:
------------------------------------------------------------
Parameters  : value       lower 90%   higher 90%
alpha       :    (     )
beta        :     (     )
Epeak [keV] :       (   )
Norm@50keV   :     (     )
------------------------------------------------------------

Photon flux (15-150 keV)    in  sec:  (    ) ph/cm2/s
Energy fluence (15-150 keV)             : 0 ( 0  0 ) ergs/cm2
S(25-50 keV) vs. S(50-100 keV) plot

S(25-50 keV)  = 1.94e-08
S(50-100 keV) = 4.30e-08
T90 vs. Hardness ratio plot

T90                                   = 0.79200005531311 sec.
Hardness ratio (energy fluence ratio) = 2.21649
Color vs. Color plot

Count Ratio  (25-50 keV) / (15-25 keV) = 1.65661
Count Ratio (50-100 keV) / (15-25 keV) = 2.05656
Mask shadow pattern

IMX = 2.408769696907946E-01, IMY = 1.159959397182839E-01
TIME vs. PHA plot around the trigger time

Blue+Cyan dotted lines: Time interval of the scaled map
From 0.000000 to 0.256000
TIME vs. DetID plot around the trigger time

Blue+Cyan dotted lines: Time interval of the scaled map
From 0.000000 to 0.256000
100 us light curve (15-350 keV)

Blue+Cyan dotted lines: Time interval of the scaled map
From 0.000000 to 0.256000
Spacecraft aspect plot

Bright source in the pre-burst/pre-slew/post-slew images
Pre-burst image of 15-350 keV band
Time interval of the image:
-84.699400 -0.604000

# RAcent  DECcent POSerr Theta    Phi  PeakCts   SNR AngSep     Name
#  [deg]    [deg]    ['] [deg]  [deg]                   [']
 83.6174  22.0027    1.2  41.9   51.6   3.3691   9.2    1.1	Crab
 91.7010  64.7874    2.6  49.3   -9.5   1.2429   4.5 ------	UNKNOWN
 86.8555  77.6171    2.1  53.8  -25.0   3.7678   5.4 ------	UNKNOWN
354.2453  11.1600    2.4  44.0 -140.9   1.5536   4.9 ------	UNKNOWN
Pre-slew background subtracted image of 15-350 keV band
Time interval of the image:
-0.604000 0.272000

# RAcent  DECcent POSerr Theta    Phi  PeakCts   SNR AngSep     Name
#  [deg]    [deg]    ['] [deg]  [deg]                   [']
 83.6845  22.0069   20.5  42.0   51.6   0.0215   0.6    2.9	Crab
 96.5151  45.8414    2.0  48.8   15.9   0.1796   5.7 ------	UNKNOWN
 27.9434  11.6500    2.0  19.2  173.2   0.0843   5.8 ------	UNKNOWN
 41.3625  43.2405    0.9  15.0  -25.7   0.1851  12.7 ------	UNKNOWN
352.3487  55.6161    2.4  41.9  -73.5   0.2717   4.7 ------	UNKNOWN
Post-slew image of 15-350 keV band
Time interval of the image:
76.300590 720.236600
720.600000 785.166500
786.600000 962.611600

# RAcent  DECcent POSerr Theta    Phi  PeakCts   SNR AngSep     Name
#  [deg]    [deg]    ['] [deg]  [deg]                   [']
 83.6357  21.9923    0.6  40.9   50.6  32.4464  19.7    1.3	Crab
 77.4759  47.6436    2.2  25.5   10.4   4.6421   5.2 ------	UNKNOWN
101.6005  63.8640    3.1  39.3  -19.7   4.5996   3.8 ------	UNKNOWN
343.9442  80.4900    3.1  42.3  -68.8  14.5374   3.7 ------	UNKNOWN
341.4734  80.4244    3.6  42.6  -69.2  13.0148   3.3 ------	UNKNOWN
338.7367  73.9356    3.4  41.4  -78.7  14.2862   3.4 ------	UNKNOWN
Plot creation:
Wed Jun 14 13:56:03 EDT 2023