Estimated redshift from machine learning (Ukwatta et al. 2016) - may take a few minute to calcaulte
Image
Pre-slew 15.0-350.0 keV image (Event data)
#   RAcent    DECcent   POSerr    Theta     Phi              Peak Cts       SNR   Name
  326.0534   -34.4140   0.0085    15.6966   -18.1638         2.9078890     22.738 TRIG_01144698

Foreground time interval of the image:
-38.296  11.741 (delta_t =  50.037 [sec])
Background time interval of the image:
-239.360 -38.296 (delta_t = 201.064 [sec])
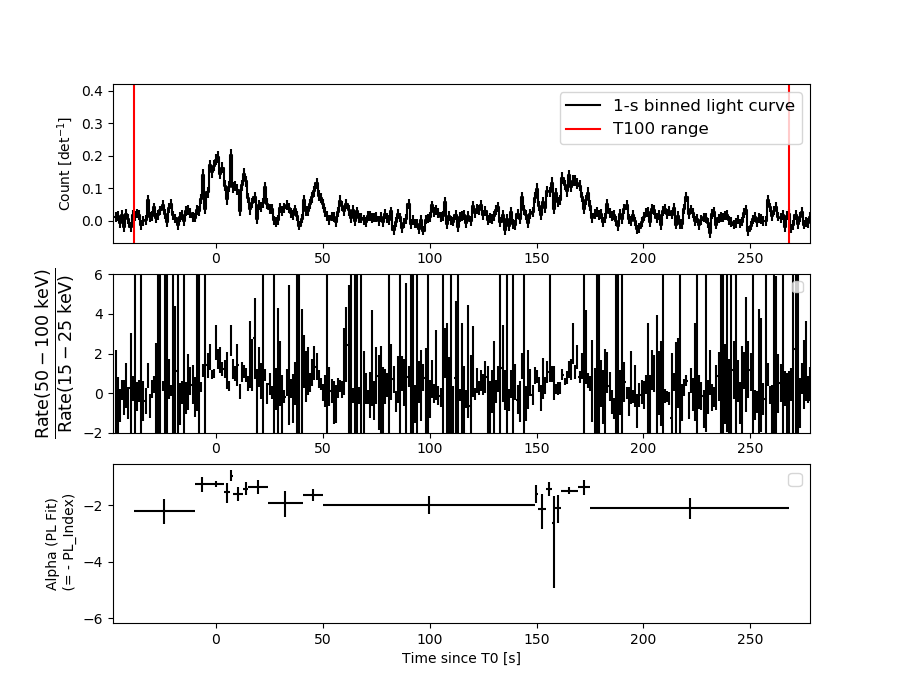
Lightcurves
Notes:
- 1) The mask-weighted light curves are using the flight position.
- 2) Multiple plots of different time binning/intervals are shown to cover all scenarios of short/long GRBs, rate/image triggers, and real/false positives.
- 3) For all the mask-weighted lightcurves, the y-axis units are counts/sec/det where a det is 0.4 x 0.4 = 0.16 sq cm.
- 4) The verticle lines correspond to following: green dotted lines are T50 interval, black dotted lines are T90 interval, blue solid line(s) is a spacecraft slew start time, and orange solid line(s) is a spacecraft slew end time.
- 5) Time of each bin is in the middle of the bin.
1 s binning
From T0-310 s to T0+310 s

From T100_start - 20 s to T100_end + 30 s

Full time interval

64 ms binning
Full time interval

From T100_start to T100_end

From T0-5 sec to T0+5 sec
16 ms binning
From T100_start-5 s to T100_start+5 s
Blue+Cyan dotted lines: Time interval of the scaled map
From 0.000000 to 1.024000
8 ms binning
From T100_start-3 s to T100_start+3 s
Blue+Cyan dotted lines: Time interval of the scaled map
From 0.000000 to 1.024000
2 ms binning
From T100_start-1 s to T100_start+1 s
Blue+Cyan dotted lines: Time interval of the scaled map
From 0.000000 to 1.024000
SN=5 or 10 sec. binning (whichever binning is satisfied first)

SN=5 or 10 sec. binning (T < 200 sec)

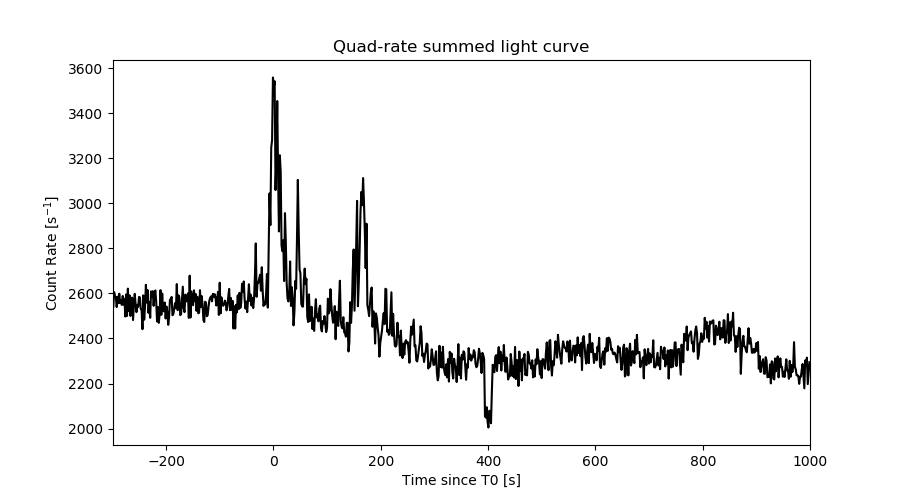
Quad-rate summed light curves (from T0-300s to T0+1000s)
Spectral Evolution
Spectra
Notes:
- 1) The fitting includes the systematic errors.
- 2) When the burst includes telescope slew time periods, the fitting uses an average response file made from multiple 5-s response files through out the slew time plus single time preiod for the non-slew times, and weighted by the total counts in the corresponding time period using addrmf. An average response file is needed becuase a spectral fit using the pre-slew DRM will introduce some errors in both a spectral shape and a normalization if the PHA file contains a lot of the slew/post-slew time interval.
- 3) For fits to more complicated models (e.g. a power-law over a cutoff power-law), the BAT team has decided to require a chi-square improvement of more than 6 for each extra dof.
Time averaged spectrum fit using the average DRM
Power-law model
Time interval is from  -38.296 sec. to  267.908 sec.

Spectral model in power-law:
------------------------------------------------------------
Parameters  : value       lower 90%   higher 90%
Photon index: 1.67658     ( -0.0884508   0.0894647 )
Norm@50keV  : 1.92691E-03    ( -9.82413e-05   9.77392e-05 )
------------------------------------------------------------
#Fit statistic  : Chi-Squared                   57.40     using 59 bins.
 Reduced chi-squared = 1.00702
# Null hypothesis probability of 4.60e-01 with 57 degrees of freedom

Photon flux (15-150 keV)    in 306.2 sec: 0.253868 ( -0.01247  0.012489 ) ph/cm2/s
Energy fluence (15-150 keV)             : 5.4744e-06 ( -2.95167e-07  2.97322e-07 ) ergs/cm2
Cutoff power-law model

Time interval is from  -38.296 sec. to  267.908 sec.
Spectral model in the cutoff power-law:
------------------------------------------------------------
Parameters  : value       lower 90%   higher 90%
Photon index: 1.11779     ( -0.406674   0.372257 )
Epeak [keV] : 76.2478      ( -14.5114 54.5881 )
Norm@50keV  : 3.72630E-03    ( -0.00129912   0.00224334 )
------------------------------------------------------------
#Fit statistic  : Chi-Squared                   50.57     using 59 bins.
 Reduced chi-squared = 0.903036
# Null hypothesis probability of 6.80e-01 with 56 degrees of freedom

Photon flux (15-150 keV)    in 306.2 sec: 0.245440 ( -0.013582  0.013597 ) ph/cm2/s
Energy fluence (15-150 keV)             : 5.20326e-06 ( -3.40693e-07  3.43706e-07 ) ergs/cm2
Band function

Time interval is from  -38.296 sec. to  267.908 sec.


Spectral model in the Band function:
------------------------------------------------------------
Parameters  : value       lower 90%   higher 90%
alpha       :    (     )
beta        :     (     )
Epeak [keV] :       (   )
Norm@50keV   :     (     )
------------------------------------------------------------

Photon flux (15-150 keV)    in  sec:  (    ) ph/cm2/s
Energy fluence (15-150 keV)             : 0 ( 0  0 ) ergs/cm2
Single BB

Spectral model blackbody:
------------------------------------------------------------
Parameters  : value    Lower 90%  Upper 90%
kT [keV]    : 13.4694  (  )
R^2/D10^2   : 3.99987E-02  (   )
(R is the radius in km and D10 is the distance to the source in units of 10 kpc)
------------------------------------------------------------
#Fit statistic  : Chi-Squared                  120.19     using 59 bins.
 Reduced chi-squared =
# Null hypothesis probability of 2.07e-06 with 57 degrees of freedom

Energy  Fluence     90% Error
[keV]   [erg/cm2]   [erg/cm2]
15- 25  4.707e-07   4.379e-08
25- 50  1.683e-06   1.001e-07
50-150  1.970e-06   2.010e-07
15-150  4.124e-06   2.266e-07
Thermal bremsstrahlung (OTTB)

Spectral model: thermal bremsstrahlung
------------------------------------------------------------
Parameters  : value         Lower 90%    Upper 90%
kT [keV]    : 140.718       (-29.3735      39.0256)
Norm        : 1.04855       (-0.0599503     0.0712782)
------------------------------------------------------------
#Fit statistic  : Chi-Squared                   51.15     using 59 bins.
 Reduced chi-squared =
# Null hypothesis probability of 6.93e-01 with 57 degrees of freedom

Energy  Fluence     90% Error
[keV]   [erg/cm2]   [erg/cm2]
15- 25  8.288e-07   6.461e-08
25- 50  1.522e-06   1.312e-07
50-150  2.923e-06   8.927e-07
15-150  5.274e-06   1.063e-06
Double BB
Spectral model: bbodyrad<1> + bbodyrad<2>
------------------------------------------------------------
Parameters  : value         Lower 90%    Upper 90%
kT1 [keV]   : 5.54375        (-1.3515      1.69753)
R1^2/D10^2  : 0.553308        (-0.329057      1.17081)
kT2 [keV]   : 19.1934        (-2.48153      4.09633)
R2^2/D10^2  : 9.19384E-03    (-0.00502511   0.00693178)
------------------------------------------------------------
#Fit statistic  : Chi-Squared                   54.23     using 59 bins.
 Reduced chi-squared =
# Null hypothesis probability of 5.04e-01 with 55 degrees of freedom

Energy  Fluence     90% Error
[keV]   [erg/cm2]   [erg/cm2]
15- 25  8.151e-07   2.235e-07
25- 50  1.495e-06   2.240e-07
50-150  2.702e-06   4.588e-07
15-150  5.012e-06   7.594e-07
Peak spectrum fit
Power-law model
Time interval is from    0.228 sec. to    1.228 sec.

Spectral model in power-law:
------------------------------------------------------------
Parameters  : value       lower 90%   higher 90%
Photon index: 1.15841     ( -0.211992   0.209287 )
Norm@50keV  : 1.50695E-02    ( -0.00189184   0.00189127 )
------------------------------------------------------------
#Fit statistic  : Chi-Squared                   43.95     using 59 bins.
 Reduced chi-squared = 0.771053
# Null hypothesis probability of 8.97e-01 with 57 degrees of freedom

Photon flux (15-150 keV)    in 1 sec: 1.75920 ( -0.22649  0.22691 ) ph/cm2/s
Energy fluence (15-150 keV)             : 1.5476e-07 ( -2.13311e-08  2.14619e-08 ) ergs/cm2
Cutoff power-law model
Time interval is from    0.228 sec. to    1.228 sec.
Spectral model in the cutoff power-law:
------------------------------------------------------------
Parameters  : value       lower 90%   higher 90%
Photon index: 0.534878     ( -1.05957   0.740117 )
Epeak [keV] : 131.194      ( -51.502 -131.194 )
Norm@50keV  : 2.92007E-02    ( -0.0135784   0.0564217 )
------------------------------------------------------------
#Fit statistic  : Chi-Squared                   42.45     using 59 bins.
 Reduced chi-squared = 0.758036
# Null hypothesis probability of 9.09e-01 with 56 degrees of freedom

Photon flux (15-150 keV)    in 1 sec: 1.72194 ( -0.23432  0.23305 ) ph/cm2/s
Energy fluence (15-150 keV)             : 1.50702e-07 ( -2.27138e-08  2.24789e-08 ) ergs/cm2
Band function

Time interval is from    0.228 sec. to    1.228 sec.


Spectral model in the Band function:
------------------------------------------------------------
Parameters  : value       lower 90%   higher 90%
alpha       :    (     )
beta        :     (     )
Epeak [keV] :       (   )
Norm@50keV   :     (     )
------------------------------------------------------------

Photon flux (15-150 keV)    in  sec:  (    ) ph/cm2/s
Energy fluence (15-150 keV)             : 0 ( 0  0 ) ergs/cm2
Single BB
Spectral model blackbody:
------------------------------------------------------------
Parameters  : value    Lower 90%  Upper 90%
kT [keV]    : 19.4989  (-2.90866  3.57113)
R^2/D10^2   : 9.14073E-02  (-0.0386581   0.0639961)
(R is the radius in km and D10 is the distance to the source in units of 10 kpc)
------------------------------------------------------------
#Fit statistic  : Chi-Squared                   50.00     using 59 bins.
 Reduced chi-squared =
# Null hypothesis probability of 7.33e-01 with 57 degrees of freedom

Energy  Fluence     90% Error
[keV]   [erg/cm2]   [erg/cm2]
15- 25  6.766e-09   1.680e-09
25- 50  3.313e-08   6.860e-09
50-150  9.302e-08   2.069e-08
15-150  1.329e-07   2.425e-08
Thermal bremsstrahlung (OTTB)

Spectral model: thermal bremsstrahlung
------------------------------------------------------------
Parameters  : value         Lower 90%    Upper 90%
kT [keV]    : 200.000       (-35.2263      -200)
Norm        : 7.23987       (-0.932426     0.932426)
------------------------------------------------------------
#Fit statistic  : Chi-Squared                   52.69     using 59 bins.
 Reduced chi-squared =
# Null hypothesis probability of 6.37e-01 with 57 degrees of freedom

Energy  Fluence     90% Error
[keV]   [erg/cm2]   [erg/cm2]
15- 25  1.802e-08   1.020e-08
25- 50  3.467e-08   1.970e-08
50-150  7.604e-08   4.169e-08
15-150  1.287e-07   7.130e-08
Double BB
Spectral model: bbodyrad<1> + bbodyrad<2>
------------------------------------------------------------
Parameters  : value         Lower 90%    Upper 90%
kT1 [keV]   : 10.0654        (-9.05142      -10.0402)
R1^2/D10^2  : 0.413613        (-0.293968      -0.416798)
kT2 [keV]   : 31.8694        (-30.7643      -31.7549)
R2^2/D10^2  : 1.38767E-02    (-0.0133345   0.0957521)
------------------------------------------------------------
#Fit statistic  : Chi-Squared                   43.17     using 59 bins.
 Reduced chi-squared =
# Null hypothesis probability of 8.76e-01 with 55 degrees of freedom

Energy  Fluence     90% Error
[keV]   [erg/cm2]   [erg/cm2]
15- 25  1.224e-08   5.090e-09
25- 50  2.972e-08   8.060e-09
50-150  9.951e-08   2.512e-08
15-150  1.415e-07   3.325e-08
Pre-slew spectrum (Pre-slew PHA with pre-slew DRM)
Power-law model
Spectral model in power-law:
------------------------------------------------------------
Parameters  : value       lower 90%   higher 90%
Photon index: 1.45963     ( -0.109108   0.109923 )
Norm@50keV  : 3.83108E-03    ( -0.000243687   0.000242956 )
------------------------------------------------------------
#Fit statistic  : Chi-Squared                   62.08     using 59 bins.
 Reduced chi-squared =
# Null hypothesis probability of 3.00e-01 with 57 degrees of freedom

Photon flux (15-150 keV)    in 50.04 sec: 0.473266 ( -0.0298477  0.0298794 ) ph/cm2/s
Energy fluence (15-150 keV)             : 1.83127e-06 ( -1.2897e-07  1.29937e-07 ) ergs/cm2
Cutoff power-law model
Spectral model in the cutoff power-law:
------------------------------------------------------------
Parameters  : value       lower 90%   higher 90%
Photon index: 0.764330     ( -0.525364   0.468599 )
Epeak [keV] : 89.5597      ( -19.4312 77.8727 )
Norm@50keV  : 8.50234E-03    ( -0.00346894   0.00679325 )
------------------------------------------------------------
#Fit statistic  : Chi-Squared                   55.36     using 59 bins.
 Reduced chi-squared =
# Null hypothesis probability of 4.99e-01 with 56 degrees of freedom

Photon flux (15-150 keV)    in 50.04 sec: 0.456749 ( -0.031808  0.031754 ) ph/cm2/s
Energy fluence (15-150 keV)             : 1.73445e-06 ( -1.44165e-07  1.45241e-07 ) ergs/cm2
Band function

Spectral model in the Band function:
------------------------------------------------------------
Parameters  : value       lower 90%   higher 90%
alpha       :    (     )
beta        :     (     )
Epeak [keV] :       (   )
Norm@50keV   :     (     )
------------------------------------------------------------

Photon flux (15-150 keV)    in  sec:  (    ) ph/cm2/s
Energy fluence (15-150 keV)             : 0 ( 0  0 ) ergs/cm2
S(25-50 keV) vs. S(50-100 keV) plot

S(25-50 keV)  = 1.47e-06
S(50-100 keV) = 1.84e-06
T90 vs. Hardness ratio plot
T90                                   = 228.531999945641 sec.
Hardness ratio (energy fluence ratio) = 1.2517
Color vs. Color plot

Count Ratio  (25-50 keV) / (15-25 keV) = 1.29502
Count Ratio (50-100 keV) / (15-25 keV) = 0.806423
Mask shadow pattern

IMX = 2.670204085641351E-01, IMY = 8.760484207718193E-02
TIME vs. PHA plot around the trigger time
Blue+Cyan dotted lines: Time interval of the scaled map
From 0.000000 to 1.024000
TIME vs. DetID plot around the trigger time
Blue+Cyan dotted lines: Time interval of the scaled map
From 0.000000 to 1.024000
100 us light curve (15-350 keV)
Blue+Cyan dotted lines: Time interval of the scaled map
From 0.000000 to 1.024000
Spacecraft aspect plot
Bright source in the pre-burst/pre-slew/post-slew images
Pre-burst image of 15-350 keV band
Time interval of the image:
-239.360000 -38.296000

# RAcent  DECcent POSerr Theta    Phi  PeakCts   SNR AngSep     Name
#  [deg]    [deg]    ['] [deg]  [deg]                   [']
306.6117  -1.8629    2.4  52.7  -26.6   7.8640   4.8 ------	UNKNOWN
252.3222 -59.7813    2.4  46.3 -126.3   6.5103   4.8 ------	UNKNOWN
Pre-slew background subtracted image of 15-350 keV band
Time interval of the image:
-38.296000 11.740590

# RAcent  DECcent POSerr Theta    Phi  PeakCts   SNR AngSep     Name
#  [deg]    [deg]    ['] [deg]  [deg]                   [']
326.0534 -34.4140    0.5  15.7  -18.2   2.9078  22.8 ------	UNKNOWN
Post-slew image of 15-350 keV band
Time interval of the image:
59.940600 327.940600

# RAcent  DECcent POSerr Theta    Phi  PeakCts   SNR AngSep     Name
#  [deg]    [deg]    ['] [deg]  [deg]                   [']
285.2359 -24.8363    0.0  36.5  -79.9   0.1075   0.1   12.0	HT1900.1-2455
 20.3348 -45.8088    2.7  42.2  128.7   8.0505   4.2 ------	UNKNOWN
 24.3125 -72.8575    3.8  48.1  166.4   5.3828   3.1 ------	UNKNOWN
325.9948 -34.4317    1.2   0.0 -142.2   4.6936   9.9 ------	UNKNOWN
322.1972 -28.9872    2.4   6.3  -26.0   2.2820   4.9 ------	UNKNOWN
301.7506 -21.8636    2.5  24.7  -59.8   2.7218   4.6 ------	UNKNOWN
282.0081 -63.3444    2.5  39.5 -144.6   3.3616   4.5 ------	UNKNOWN
Plot creation:
Wed Jun 14 13:54:13 EDT 2023