Click here for the BAT GCN circular template
Image
Pre-slew 15.0-350.0 keV image (Event data)

#   RAcent    DECcent   POSerr    Theta     Phi              Peak Cts       SNR   Name
   44.3381   -18.5418   0.0045    39.4241  -133.7721         8.0678544     43.268 TRIG_00114893

Foreground time interval of the image:
 -8.352  80.560 (delta_t =  88.912 [sec])
Background time interval of the image:
-177.811  -8.352 (delta_t = 169.459 [sec])
Lightcurves
Notes:
- 1) The mask-weighted light curves are using the flight position.
- 2) Multiple plots of different time binning/intervals are shown to cover all scenarios of short/long GRBs, rate/image triggers, and real/false positives.
- 3) For all the mask-weighted lightcurves, the y-axis units are counts/sec/det where a det is 0.4 x 0.4 = 0.16 sq cm.
- 4) The verticle lines correspond to following: green dotted lines are T50 interval, black dotted lines are T90 interval, blue solid line(s) is a spacecraft slew start time, and orange solid line(s) is a spacecraft slew end time.
- 5) Time of each bin is in the middle of the bin.
1 s binning
From T0-310 s to T0+310 s

From T100_start - 20 s to T100_end + 30 s

Full time interval

64 ms binning
Full time interval

From T100_start to T100_end

From T0-5 sec to T0+5 sec

16 ms binning
From T100_start-5 s to T100_start+5 s

8 ms binning
From T100_start-3 s to T100_start+3 s

2 ms binning
From T100_start-1 s to T100_start+1 s

SN=5 or 10 sec. binning (whichever binning is satisfied first)

SN=5 or 10 sec. binning (T < 200 sec)

Quad-rate summed light curves (from T0-300s to T0+1000s)

Spectral Evolution

Spectra
Notes:
- 1) The fitting includes the systematic errors.
- 2) When the burst includes telescope slew time periods, the fitting uses an average response file made from multiple 5-s response files through out the slew time plus single time preiod for the non-slew times, and weighted by the total counts in the corresponding time period using addrmf. An average response file is needed becuase a spectral fit using the pre-slew DRM will introduce some errors in both a spectral shape and a normalization if the PHA file contains a lot of the slew/post-slew time interval.
- 3) For fits to more complicated models (e.g. a power-law over a cutoff power-law), the BAT team has decided to require a chi-square improvement of more than 6 for each extra dof.
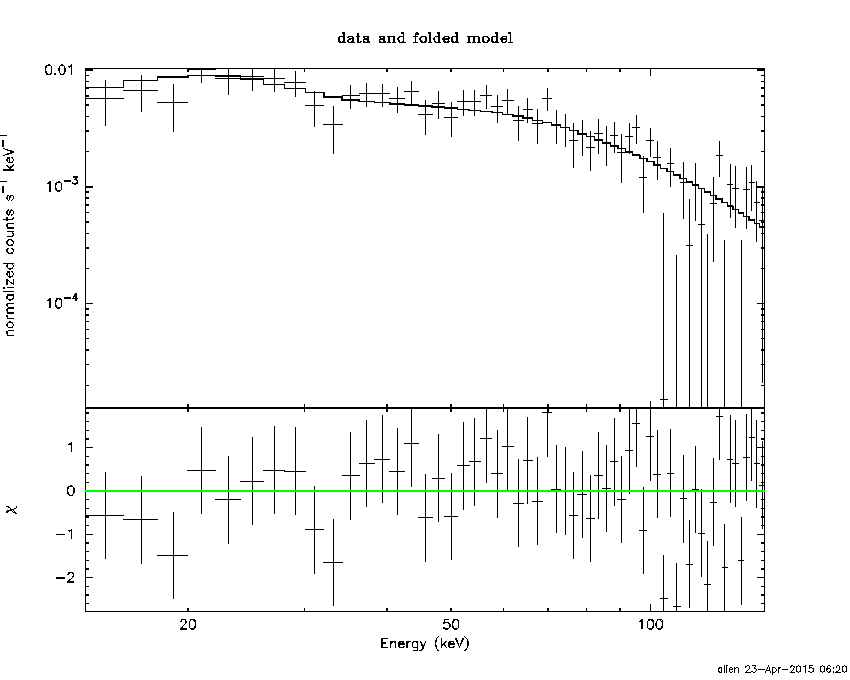
Time averaged spectrum fit using the average DRM
Power-law model

Time interval is from   -8.352 sec. to   80.560 sec.

Spectral model in power-law:
------------------------------------------------------------
Parameters  : value       lower 90%   higher 90%
Photon index: 1.66510     ( -0.0599501   0.0601248 )
Norm@50keV  : 6.33833E-03    ( -0.000209769   0.000209644 )
------------------------------------------------------------
#Fit statistic : Chi-Squared =          56.95 using 59 PHA bins.
# Reduced chi-squared =         0.9992 for     57 degrees of freedom
# Null hypothesis probability =   4.768298e-01

Photon flux (15-150 keV)    in 88.91 sec: 0.831793 ( -0.0299194  0.0300132 ) ph/cm2/s
Energy fluence (15-150 keV)             : 5.23349e-06 ( -1.79853e-07  1.80122e-07 ) ergs/cm2
Cutoff power-law model

Time interval is from   -8.352 sec. to   80.560 sec.
Spectral model in the cutoff power-law:
------------------------------------------------------------
Parameters  : value       lower 90%   higher 90%
Photon index: 1.28024     ( -0.260749   0.246239 )
Epeak [keV] : 98.1535      ( -20.2459 76.9903 )
Norm@50keV  : 9.69175E-03    ( -0.00225437   0.00314618 )
------------------------------------------------------------
#Fit statistic : Chi-Squared =          49.64 using 59 PHA bins.
# Reduced chi-squared =         0.8864 for     56 degrees of freedom
# Null hypothesis probability =   7.128029e-01

Photon flux (15-150 keV)    in 88.91 sec: 0.810327 ( -0.032523  0.032703 ) ph/cm2/s
Energy fluence (15-150 keV)             : 5.10327e-06 ( -2.00172e-07  1.99141e-07 ) ergs/cm2
Band function

Time interval is from   -8.352 sec. to   80.560 sec.

Spectral model in the Band function:
------------------------------------------------------------
Parameters  : value       lower 90%   higher 90%
alpha       : -0.885461   ( -0.59472   0.88089 )
beta        : -1.83659    ( 1.8365   0.127225 )
Epeak [keV] : 60.7951      ( -19.5588 83.8211 )
Norm@50keV   : 1.68529E-02    ( -0.00912923   0.0472015 )
------------------------------------------------------------
#Fit statistic : Chi-Squared =          48.71 using 59 PHA bins.
# Reduced chi-squared =         0.8857 for     55 degrees of freedom
# Null hypothesis probability =   7.122102e-01

Photon flux (15-150 keV)    in 88.91 sec:  (    ) ph/cm2/s
Energy fluence (15-150 keV)             : 5.102e-06 ( -5.10138e-06  -1.95344e-07 ) ergs/cm2
Single BB

Spectral model blackbody:
------------------------------------------------------------
Parameters  : value    Lower 90%  Upper 90%
kT [keV]    : 14.7797  (  )
R^2/D10^2   : 9.33993E-02  (   )
(R is the radius in km and D10 is the distance to the source in units of 10 kpc)
------------------------------------------------------------
#Fit statistic : Chi-Squared =         229.53 using 59 PHA bins.
# Reduced chi-squared =         4.0268 for     57 degrees of freedom
# Null hypothesis probability =   1.453243e-22

Energy  Fluence     90% Error
[keV]   [erg/cm2]   [erg/cm2]
15- 25  3.807e-07   2.436e-08
25- 50  1.492e-06   6.579e-08
50-150  2.203e-06   1.440e-07
15-150  4.076e-06   1.498e-07
Thermal bremsstrahlung (OTTB)

Spectral model: thermal bremsstrahlung
------------------------------------------------------------
Parameters  : value         Lower 90%    Upper 90%
kT [keV]    : 157.458       (-23.7507      29.3532)
Norm        : 3.38729       (-0.136568     0.152905)
------------------------------------------------------------
#Fit statistic : Chi-Squared =          49.54 using 59 PHA bins.
# Reduced chi-squared =         0.8691 for     57 degrees of freedom
# Null hypothesis probability =   7.481412e-01

Energy  Fluence     90% Error
[keV]   [erg/cm2]   [erg/cm2]
15- 25  7.702e-07   4.646e-08
25- 50  1.437e-06   9.469e-08
50-150  2.894e-06   7.028e-07
15-150  5.101e-06   7.815e-07
Double BB

Spectral model: bbodyrad<1> + bbodyrad<2>
------------------------------------------------------------
Parameters  : value         Lower 90%    Upper 90%
kT1 [keV]   : 7.63361        (-0.961694      1.00309)
R1^2/D10^2  : 0.654320        (-0.212737      0.37408)
kT2 [keV]   : 26.0615        (-3.22153      4.67353)
R2^2/D10^2  : 8.97052E-03    (-0.00414438   0.0061215)
------------------------------------------------------------
#Fit statistic : Chi-Squared =          56.33 using 59 PHA bins.
# Reduced chi-squared =          1.024 for     55 degrees of freedom
# Null hypothesis probability =   4.249990e-01

Energy  Fluence     90% Error
[keV]   [erg/cm2]   [erg/cm2]
15- 25  6.827e-07   7.771e-08
25- 50  1.484e-06   1.311e-07
50-150  2.879e-06   3.561e-07
15-150  5.046e-06   4.788e-07
Peak spectrum fit
Power-law model
Time interval is from    0.724 sec. to    1.724 sec.

Spectral model in power-law:
------------------------------------------------------------
Parameters  : value       lower 90%   higher 90%
Photon index: 1.10619     ( -0.119893   0.118147 )
Norm@50keV  : 3.20035E-02    ( -0.00232446   0.00232114 )
------------------------------------------------------------
#Fit statistic : Chi-Squared =          59.39 using 59 PHA bins.
# Reduced chi-squared =          1.042 for     57 degrees of freedom
# Null hypothesis probability =   3.885153e-01

Photon flux (15-150 keV)    in 1 sec: 3.71442 ( -0.279058  0.279534 ) ph/cm2/s
Energy fluence (15-150 keV)             : 3.33945e-07 ( -2.56001e-08  2.56574e-08 ) ergs/cm2
Cutoff power-law model

Time interval is from    0.724 sec. to    1.724 sec.
Spectral model in the cutoff power-law:
------------------------------------------------------------
Parameters  : value       lower 90%   higher 90%
Photon index: 0.401567     ( -0.592323   0.52004 )
Epeak [keV] : 130.668      ( -34.9486 188.9 )
Norm@50keV  : 6.60826E-02    ( -0.0268736   0.0518611 )
------------------------------------------------------------
#Fit statistic : Chi-Squared =          53.86 using 59 PHA bins.
# Reduced chi-squared =         0.9618 for     56 degrees of freedom
# Null hypothesis probability =   5.561914e-01

Photon flux (15-150 keV)    in 1 sec: 3.62920 ( -0.28655  0.28681 ) ph/cm2/s
Energy fluence (15-150 keV)             : 3.2654e-07 ( -2.6899e-08  2.6746e-08 ) ergs/cm2
Band function

Time interval is from    0.724 sec. to    1.724 sec.

Spectral model in the Band function:
------------------------------------------------------------
Parameters  : value       lower 90%   higher 90%
alpha       : -0.475860   ( -0.433677   1.62438 )
beta        : -1.73569    ( 1.75643   0.574478 )
Epeak [keV] : 138.944      ( -71.2286 160.499 )
Norm@50keV   : 6.12503E-02    ( -0.030042   0.442942 )
------------------------------------------------------------
#Fit statistic : Chi-Squared =          53.75 using 59 PHA bins.
# Reduced chi-squared =         0.9773 for     55 degrees of freedom
# Null hypothesis probability =   5.224284e-01

Photon flux (15-150 keV)    in 1 sec:  (    ) ph/cm2/s
Energy fluence (15-150 keV)             : 0 ( 0  0 ) ergs/cm2
Single BB

Spectral model blackbody:
------------------------------------------------------------
Parameters  : value    Lower 90%  Upper 90%
kT [keV]    : 20.8009  (-1.72277  1.94011)
R^2/D10^2   : 0.160182  (-0.0406772   0.0526603)
(R is the radius in km and D10 is the distance to the source in units of 10 kpc)
------------------------------------------------------------
#Fit statistic : Chi-Squared =          72.84 using 59 PHA bins.
# Reduced chi-squared =          1.278 for     57 degrees of freedom
# Null hypothesis probability =   7.688080e-02

Energy  Fluence     90% Error
[keV]   [erg/cm2]   [erg/cm2]
15- 25  1.315e-08   1.760e-09
25- 50  6.718e-08   7.520e-09
50-150  2.165e-07   2.420e-08
15-150  2.968e-07   2.720e-08
Thermal bremsstrahlung (OTTB)

Spectral model: thermal bremsstrahlung
------------------------------------------------------------
Parameters  : value         Lower 90%    Upper 90%
kT [keV]    : 200.000       (      )
Norm        : 15.4713       (-1.15189     1.15173)
------------------------------------------------------------
#Fit statistic : Chi-Squared =          95.59 using 59 PHA bins.
# Reduced chi-squared =          1.677 for     57 degrees of freedom
# Null hypothesis probability =   1.036698e-03

Energy  Fluence     90% Error
[keV]   [erg/cm2]   [erg/cm2]
15- 25  3.854e-08   3.255e-09
25- 50  7.413e-08   8.955e-09
50-150  1.626e-07   4.657e-08
15-150  2.752e-07   5.825e-08
Double BB

Spectral model: bbodyrad<1> + bbodyrad<2>
------------------------------------------------------------
Parameters  : value         Lower 90%    Upper 90%
kT1 [keV]   : 7.45669        (-2.81948      5.62056)
R1^2/D10^2  : 1.76105        (-1.3286      4.75677)
kT2 [keV]   : 26.8915        (-4.33292      18.0762)
R2^2/D10^2  : 6.04283E-02    (-0.0510767   0.0544287)
------------------------------------------------------------
#Fit statistic : Chi-Squared =          54.65 using 59 PHA bins.
# Reduced chi-squared =         0.9937 for     55 degrees of freedom
# Null hypothesis probability =   4.877685e-01

Energy  Fluence     90% Error
[keV]   [erg/cm2]   [erg/cm2]
15- 25  2.401e-08   1.076e-08
25- 50  6.868e-08   2.152e-08
50-150  2.321e-07   6.285e-08
15-150  3.248e-07   1.030e-07
Pre-slew spectrum (Pre-slew PHA with pre-slew DRM)
Power-law model
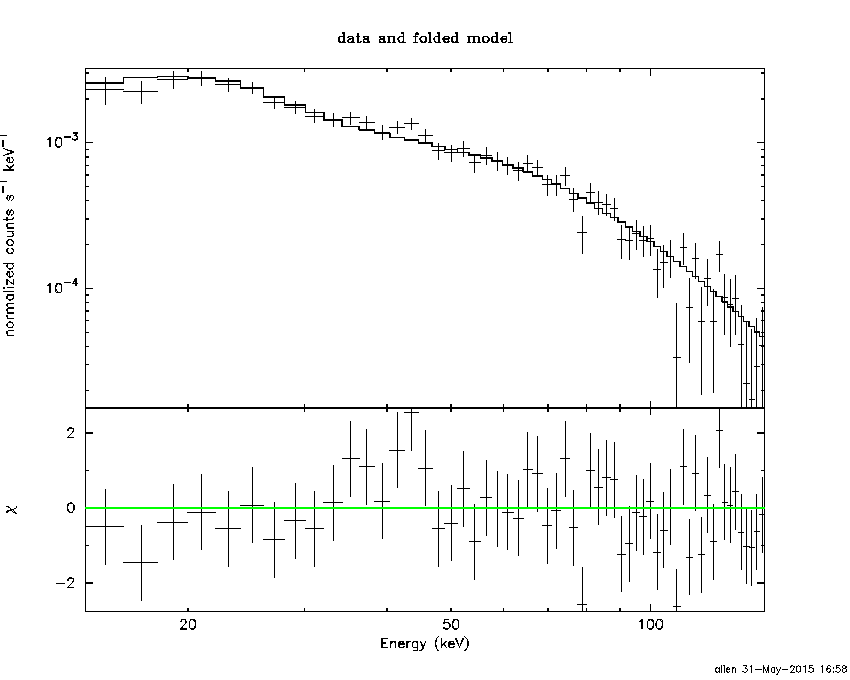
Spectral model in power-law:
------------------------------------------------------------
Parameters  : value       lower 90%   higher 90%
Photon index: 1.66510     ( -0.0599501   0.0601248 )
Norm@50keV  : 6.33833E-03    ( -0.000209769   0.000209644 )
------------------------------------------------------------
#Fit statistic : Chi-Squared =          56.95 using 59 PHA bins.
# Reduced chi-squared =         0.9992 for     57 degrees of freedom
# Null hypothesis probability =   4.768298e-01

Photon flux (15-150 keV)    in 88.91 sec: 0.831793 ( -0.0299194  0.0300132 ) ph/cm2/s
Energy fluence (15-150 keV)             : 5.23349e-06 ( -1.79853e-07  1.80122e-07 ) ergs/cm2
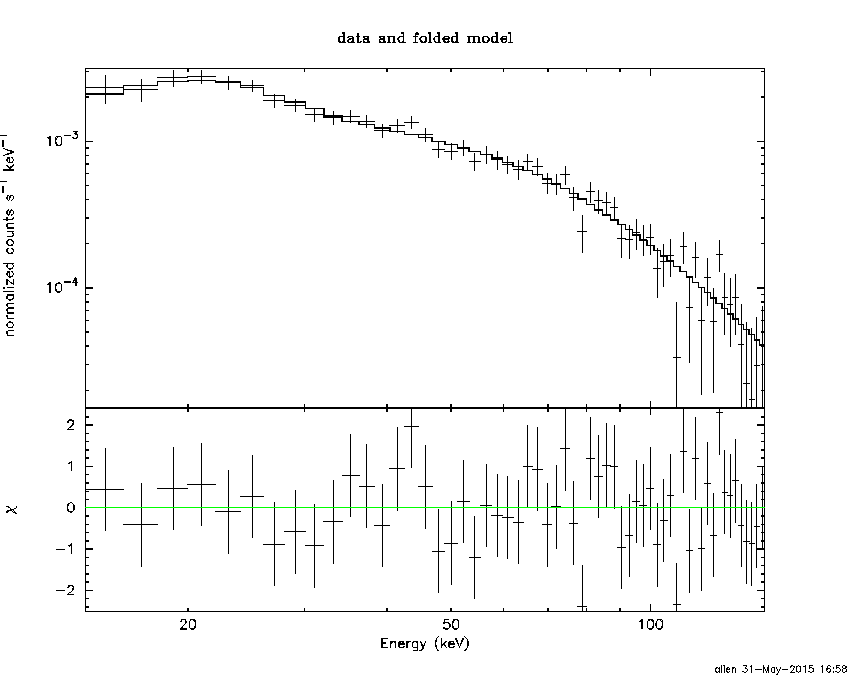
Cutoff power-law model

Spectral model in the cutoff power-law:
------------------------------------------------------------
Parameters  : value       lower 90%   higher 90%
Photon index: 1.28024     ( -0.260749   0.246239 )
Epeak [keV] : 98.1535      ( -20.2459 76.9903 )
Norm@50keV  : 9.69175E-03    ( -0.00225437   0.00314618 )
------------------------------------------------------------
#Fit statistic : Chi-Squared =          49.64 using 59 PHA bins.
# Reduced chi-squared =         0.8864 for     56 degrees of freedom
# Null hypothesis probability =   7.128029e-01

Photon flux (15-150 keV)    in 88.91 sec: 0.810327 ( -0.032523  0.032703 ) ph/cm2/s
Energy fluence (15-150 keV)             : 5.10327e-06 ( -2.00172e-07  1.99141e-07 ) ergs/cm2
Band function
Spectral model in the Band function:
------------------------------------------------------------
Parameters  : value       lower 90%   higher 90%
alpha       : -0.885461   ( -0.59472   0.88089 )
beta        : -1.83659    ( 1.8365   0.127225 )
Epeak [keV] : 60.7951      ( -19.5588 83.8211 )
Norm@50keV   : 1.68529E-02    ( -0.00912923   0.0472015 )
------------------------------------------------------------
#Fit statistic : Chi-Squared =          48.71 using 59 PHA bins.
# Reduced chi-squared =         0.8857 for     55 degrees of freedom
# Null hypothesis probability =   7.122102e-01

Photon flux (15-150 keV)    in 88.91 sec:  (    ) ph/cm2/s
Energy fluence (15-150 keV)             : 5.102e-06 ( -5.10138e-06  -1.95344e-07 ) ergs/cm2
S(25-50 keV) vs. S(50-100 keV) plot

S(25-50 keV)  = 1.40e-06
S(50-100 keV) = 1.76e-06
T90 vs. Hardness ratio plot

T90                                   = 81.7599999904633 sec.
Hardness ratio (energy fluence ratio) = 1.25714
Color vs. Color plot

Count Ratio  (25-50 keV) / (15-25 keV) = 1.38465
Count Ratio (50-100 keV) / (15-25 keV) = 0.981434
Mask shadow pattern

IMX = -5.687324730072576E-01, IMY = 5.936468677865748E-01
TIME vs. PHA plot around the trigger time

TIME vs. DetID plot around the trigger time

100 us light curve (15-350 keV)

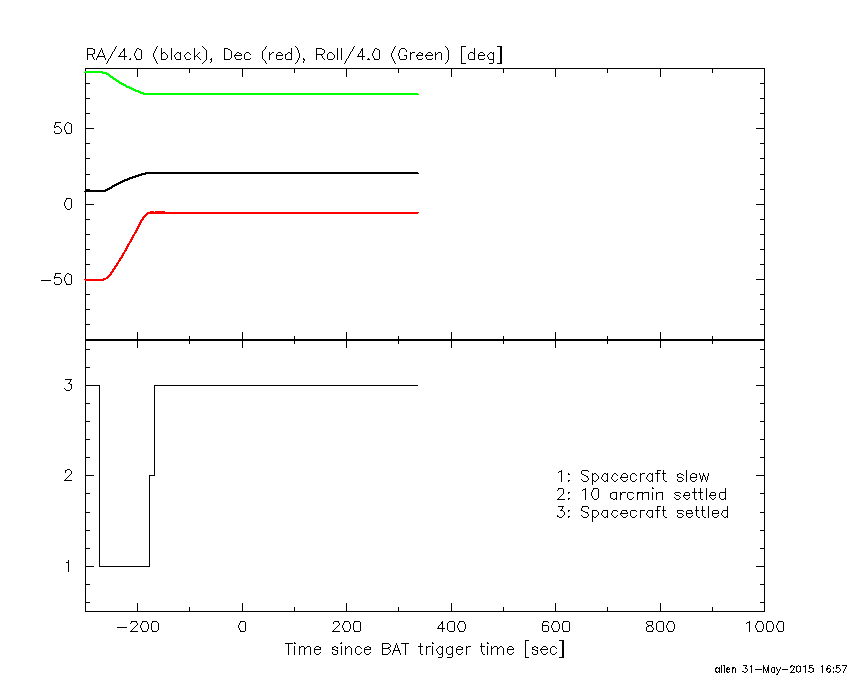
Spacecraft aspect plot
Bright source in the pre-burst/pre-slew/post-slew images
Pre-burst image of 15-350 keV band
Time interval of the image:
-177.811430 -8.352000

# RAcent  DECcent POSerr Theta    Phi  PeakCts   SNR AngSep     Name
#  [deg]    [deg]    ['] [deg]  [deg]                   [']
 83.6359  22.0191    0.2  27.5  -18.8   7.0834  53.7    0.3	Crab
122.9389  -5.5670    3.0  40.2   71.0   1.9078   3.9 ------	UNKNOWN
 95.7994 -28.4715    2.3  26.2  131.7   0.8132   5.0 ------	UNKNOWN
 50.3733 -56.4354    2.7  56.9  179.5   2.9289   4.3 ------	UNKNOWN
 88.7405  19.2148    2.6  25.5   -7.3   0.5582   4.4 ------	UNKNOWN
 45.8930  13.3891    2.6  41.0  -83.3   2.5366   4.4 ------	UNKNOWN
 42.4754   4.2922    3.7  41.2  -98.1   2.2049   3.1 ------	UNKNOWN
Pre-slew background subtracted image of 15-350 keV band
Time interval of the image:
-8.352000 80.560000

# RAcent  DECcent POSerr Theta    Phi  PeakCts   SNR AngSep     Name
#  [deg]    [deg]    ['] [deg]  [deg]                   [']
 83.4569  21.9145  846.2  27.4  -19.2   0.0015   0.0   11.5	Crab
 99.8975 -10.4741    2.9  17.9   86.1   0.4823   4.0 ------	UNKNOWN
 75.5733 -44.1616    2.2  39.1  166.8   0.8775   5.2 ------	UNKNOWN
 75.9463  -3.2078    2.4   6.9  -92.0   0.4888   4.8 ------	UNKNOWN
 44.3381 -18.5418    0.3  39.4 -133.8   8.0671  43.3 ------	UNKNOWN
Post-slew image of 15-350 keV band
Time interval of the image:
-299.112000 302.936500

# RAcent  DECcent POSerr Theta    Phi  PeakCts   SNR AngSep     Name
#  [deg]    [deg]    ['] [deg]  [deg]                   [']
 83.6329  22.0188    0.2  27.5  -18.8  20.2288  64.9    0.3	Crab
125.0067  10.2696    3.5  45.2   48.5   4.3538   3.3 ------	UNKNOWN
 84.4364 -21.6516    3.2  16.3  152.5   1.1403   3.6 ------	UNKNOWN
 34.7288 -48.5267    3.0  59.0 -166.2   9.7247   3.9 ------	UNKNOWN
 44.3339 -18.5398    0.9  39.4 -133.8   8.1115  13.2 ------	UNKNOWN
Plot creation:
Sun May 31 16:59:16 EDT 2015