Estimated redshift from machine learning (Ukwatta et al. 2016) - may take a few minute to calcaulte
Image
Pre-slew 15.0-350.0 keV image (Event data)
# RAcent DECcent POSerr Theta Phi Peak Cts SNR Name
98.5712 49.8440 0.0163 10.6025 132.3715 1.4034154 11.788 TRIG_01149293
Foreground time interval of the image:
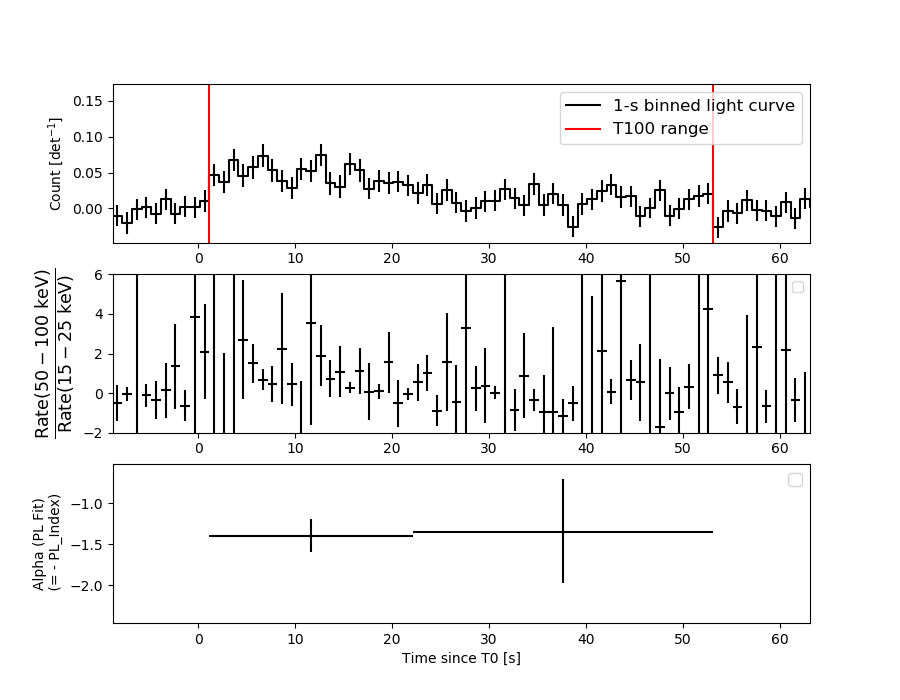
1.144 53.144 (delta_t = 52.000 [sec])
Background time interval of the image:
-239.856 1.144 (delta_t = 241.000 [sec])
Lightcurves
Notes:
- 1) The mask-weighted light curves are using the flight position.
- 2) Multiple plots of different time binning/intervals are shown to cover all scenarios of short/long GRBs, rate/image triggers, and real/false positives.
- 3) For all the mask-weighted lightcurves, the y-axis units are counts/sec/det where a det is 0.4 x 0.4 = 0.16 sq cm.
- 4) The verticle lines correspond to following: green dotted lines are T50 interval, black dotted lines are T90 interval, blue solid line(s) is a spacecraft slew start time, and orange solid line(s) is a spacecraft slew end time.
- 5) Time of each bin is in the middle of the bin.
1 s binning
From T0-310 s to T0+310 s

From T100_start - 20 s to T100_end + 30 s

Full time interval

64 ms binning
Full time interval

From T100_start to T100_end
From T0-5 sec to T0+5 sec

16 ms binning
From T100_start-5 s to T100_start+5 s

Blue+Cyan dotted lines: Time interval of the scaled map
From 0.000000 to 12.160000
8 ms binning
From T100_start-3 s to T100_start+3 s

Blue+Cyan dotted lines: Time interval of the scaled map
From 0.000000 to 12.160000
2 ms binning
From T100_start-1 s to T100_start+1 s

Blue+Cyan dotted lines: Time interval of the scaled map
From 0.000000 to 12.160000
SN=5 or 10 sec. binning (whichever binning is satisfied first)
SN=5 or 10 sec. binning (T < 200 sec)
Quad-rate summed light curves (from T0-300s to T0+1000s)

Spectral Evolution
Spectra
Notes:
- 1) The fitting includes the systematic errors.
- 2) When the burst includes telescope slew time periods, the fitting uses an average response file made from multiple 5-s response files through out the slew time plus single time preiod for the non-slew times, and weighted by the total counts in the corresponding time period using addrmf. An average response file is needed becuase a spectral fit using the pre-slew DRM will introduce some errors in both a spectral shape and a normalization if the PHA file contains a lot of the slew/post-slew time interval.
- 3) For fits to more complicated models (e.g. a power-law over a cutoff power-law), the BAT team has decided to require a chi-square improvement of more than 6 for each extra dof.
Time averaged spectrum fit using the average DRM
Power-law model

Time interval is from    1.144 sec. to   53.144 sec.

Spectral model in power-law:
------------------------------------------------------------
Parameters  : value       lower 90%   higher 90%
Photon index: 1.38497     ( -0.220555   0.219852 )
Norm@50keV  : 1.61197E-03    ( -0.000216061   0.000215091 )
------------------------------------------------------------
#Fit statistic  : Chi-Squared                   53.89     using 59 bins.
 Reduced chi-squared = 0.945439
# Null hypothesis probability of 5.92e-01 with 57 degrees of freedom

Photon flux (15-150 keV)    in 52 sec: 0.195652 ( -0.025943  0.025971 ) ph/cm2/s
Energy fluence (15-150 keV)             : 8.12594e-07 ( -1.20741e-07  1.22496e-07 ) ergs/cm2
Cutoff power-law model

Time interval is from    1.144 sec. to   53.144 sec.
Spectral model in the cutoff power-law:
------------------------------------------------------------
Parameters  : value       lower 90%   higher 90%
Photon index: 0.576979     ( -1.2597   0.508536 )
Epeak [keV] : 82.7418      ( -27.246 -82.7335 )
Norm@50keV  : 4.34290E-03    ( -0.00434374   0.0160926 )
------------------------------------------------------------
#Fit statistic  : Chi-Squared                   51.85     using 59 bins.
 Reduced chi-squared = 0.925893
# Null hypothesis probability of 6.33e-01 with 56 degrees of freedom

Photon flux (15-150 keV)    in 52 sec: 0.189779 ( -0.027107  0.026983 ) ph/cm2/s
Energy fluence (15-150 keV)             : 7.50334e-07 ( -1.42026e-07  1.43698e-07 ) ergs/cm2
Band function

Time interval is from    1.144 sec. to   53.144 sec.


Spectral model in the Band function:
------------------------------------------------------------
Parameters  : value       lower 90%   higher 90%
alpha       :    (     )
beta        :     (     )
Epeak [keV] :       (   )
Norm@50keV   :     (     )
------------------------------------------------------------

Photon flux (15-150 keV)    in  sec:  (    ) ph/cm2/s
Energy fluence (15-150 keV)             : 0 ( 0  0 ) ergs/cm2
Single BB
Spectral model blackbody:
------------------------------------------------------------
Parameters  : value    Lower 90%  Upper 90%
kT [keV]    : 14.1458  (-2.0864  2.60486)
R^2/D10^2   : 2.83254E-02  (-0.0126978   0.0214309)
(R is the radius in km and D10 is the distance to the source in units of 10 kpc)
------------------------------------------------------------
#Fit statistic  : Chi-Squared                   58.22     using 59 bins.
 Reduced chi-squared =
# Null hypothesis probability of 4.30e-01 with 57 degrees of freedom

Energy  Fluence     90% Error
[keV]   [erg/cm2]   [erg/cm2]
15- 25  6.220e-08   1.628e-08
25- 50  2.337e-07   4.391e-08
50-150  3.096e-07   9.006e-08
15-150  6.054e-07   1.098e-07
Thermal bremsstrahlung (OTTB)

Spectral model: thermal bremsstrahlung
------------------------------------------------------------
Parameters  : value         Lower 90%    Upper 90%
kT [keV]    : 200.000       (-67.9942      -200)
Norm        : 0.807429       (-0.105759     0.105759)
------------------------------------------------------------
#Fit statistic  : Chi-Squared                   53.92     using 59 bins.
 Reduced chi-squared =
# Null hypothesis probability of 5.92e-01 with 57 degrees of freedom

Energy  Fluence     90% Error
[keV]   [erg/cm2]   [erg/cm2]
15- 25  1.046e-07   5.897e-08
25- 50  2.011e-07   1.115e-07
50-150  4.411e-07   2.439e-07
15-150  7.468e-07   4.196e-07
Double BB

Spectral model: bbodyrad<1> + bbodyrad<2>
------------------------------------------------------------
Parameters  : value         Lower 90%    Upper 90%
kT1 [keV]   : 9.81685        (-3.34718      3.07792)
R1^2/D10^2  : 7.59338E-02        (-0.0363675      0.107743)
kT2 [keV]   : 39.9075        (-36.2833      -57.5723)
R2^2/D10^2  : 5.18935E-04    (-0.000155946   0.00474787)
------------------------------------------------------------
#Fit statistic  : Chi-Squared                   49.04     using 59 bins.
 Reduced chi-squared =
# Null hypothesis probability of 7.01e-01 with 55 degrees of freedom

Energy  Fluence     90% Error
[keV]   [erg/cm2]   [erg/cm2]
15- 25  8.254e-08   4.831e-08
25- 50  2.243e-07   1.257e-07
50-150  4.531e-07   2.582e-07
15-150  7.599e-07   4.046e-07
Peak spectrum fit
Power-law model

Time interval is from   12.144 sec. to   13.144 sec.

Spectral model in power-law:
------------------------------------------------------------
Parameters  : value       lower 90%   higher 90%
Photon index: 1.45137     ( -0.578574   0.620522 )
Norm@50keV  : 4.26174E-03    ( -0.00157623   0.00154214 )
------------------------------------------------------------
#Fit statistic  : Chi-Squared                   51.10     using 59 bins.
 Reduced chi-squared = 0.896491
# Null hypothesis probability of 6.95e-01 with 57 degrees of freedom

Photon flux (15-150 keV)    in 1 sec: 0.525389 ( -0.188124  0.188626 ) ph/cm2/s
Energy fluence (15-150 keV)             : 4.07774e-08 ( -1.60317e-08  1.64442e-08 ) ergs/cm2
Cutoff power-law model

Time interval is from   12.144 sec. to   13.144 sec.
Spectral model in the cutoff power-law:
------------------------------------------------------------
Parameters  : value       lower 90%   higher 90%
Photon index: -1.21474     ( 1.28643   3.49079 )
Epeak [keV] : 63.1553      ( -15.0874 -62.7842 )
Norm@50keV  : 7.83051E-02    ( -0.091093   2326.4 )
------------------------------------------------------------
#Fit statistic  : Chi-Squared                   49.63     using 59 bins.
 Reduced chi-squared = 0.88625
# Null hypothesis probability of 7.13e-01 with 56 degrees of freedom

Photon flux (15-150 keV)    in 1 sec: 0.469914 ( -0.222649  0.21179 ) ph/cm2/s
Energy fluence (15-150 keV)             : 3.61352e-08 ( -1.72179e-08  1.79004e-08 ) ergs/cm2
Band function

Time interval is from   12.144 sec. to   13.144 sec.


Spectral model in the Band function:
------------------------------------------------------------
Parameters  : value       lower 90%   higher 90%
alpha       :    (     )
beta        :     (     )
Epeak [keV] :       (   )
Norm@50keV   :     (     )
------------------------------------------------------------

Photon flux (15-150 keV)    in  sec:  (    ) ph/cm2/s
Energy fluence (15-150 keV)             : 0 ( 0  0 ) ergs/cm2
Single BB

Spectral model blackbody:
------------------------------------------------------------
Parameters  : value    Lower 90%  Upper 90%
kT [keV]    : 15.9400  (-4.45667  6.94919)
R^2/D10^2   : 5.39348E-02  (-0.0539348   0.113308)
(R is the radius in km and D10 is the distance to the source in units of 10 kpc)
------------------------------------------------------------
#Fit statistic  : Chi-Squared                   49.56     using 59 bins.
 Reduced chi-squared =
# Null hypothesis probability of 7.48e-01 with 57 degrees of freedom

Energy  Fluence     90% Error
[keV]   [erg/cm2]   [erg/cm2]
15- 25  2.836e-09   1.853e-09
25- 50  1.189e-08   7.295e-09
50-150  2.109e-08   1.500e-08
15-150  3.582e-08   2.285e-08
Thermal bremsstrahlung (OTTB)

Spectral model: thermal bremsstrahlung
------------------------------------------------------------
Parameters  : value         Lower 90%    Upper 90%
kT [keV]    : 199.362       (-199.363      -199.363)
Norm        : 2.18112       (-0.767951     0.768427)
------------------------------------------------------------
#Fit statistic  : Chi-Squared                   50.85     using 59 bins.
 Reduced chi-squared =
# Null hypothesis probability of 7.04e-01 with 57 degrees of freedom

Energy  Fluence     90% Error
[keV]   [erg/cm2]   [erg/cm2]
15- 25  5.431e-09   3.572e-09
25- 50  1.045e-08   6.735e-09
50-150  2.291e-08   1.429e-08
15-150  3.879e-08   2.434e-08
Double BB

Spectral model: bbodyrad<1> + bbodyrad<2>
------------------------------------------------------------
Parameters  : value         Lower 90%    Upper 90%
kT1 [keV]   : 1.36718        (-1.75736      16.3935)
R1^2/D10^2  : 8504.58        (-7750.74      -7750.74)
kT2 [keV]   : 17.0077        (-4.86055      8.18201)
R2^2/D10^2  : 4.12378E-02    (-0.0307731   0.0508433)
------------------------------------------------------------
#Fit statistic  : Chi-Squared                   47.18     using 59 bins.
 Reduced chi-squared =
# Null hypothesis probability of 7.64e-01 with 55 degrees of freedom

Energy  Fluence     90% Error
[keV]   [erg/cm2]   [erg/cm2]
15- 25  4.474e-09   2.158e-09
25- 50  1.053e-08   6.585e-09
50-150  2.247e-08   1.592e-08
15-150  3.748e-08   2.233e-08
Pre-slew spectrum (Pre-slew PHA with pre-slew DRM)
Power-law model
Spectral model in power-law:
------------------------------------------------------------
Parameters  : value       lower 90%   higher 90%
Photon index: 1.38497     ( -0.220555   0.219852 )
Norm@50keV  : 1.61197E-03    ( -0.000216061   0.000215091 )
------------------------------------------------------------
#Fit statistic  : Chi-Squared                   53.89     using 59 bins.
 Reduced chi-squared =
# Null hypothesis probability of 5.92e-01 with 57 degrees of freedom

Photon flux (15-150 keV)    in 52 sec: 0.195648 ( -0.0259421  0.0259709 ) ph/cm2/s
Energy fluence (15-150 keV)             : 8.1249e-07 ( -1.20697e-07  1.22547e-07 ) ergs/cm2
Cutoff power-law model

Spectral model in the cutoff power-law:
------------------------------------------------------------
Parameters  : value       lower 90%   higher 90%
Photon index: 0.576552     ( -1.25956   0.892908 )
Epeak [keV] : 82.7162      ( -27.2611 -82.7309 )
Norm@50keV  : 4.34543E-03    ( -0.00434385   0.0160922 )
------------------------------------------------------------
#Fit statistic  : Chi-Squared                   51.85     using 59 bins.
 Reduced chi-squared =
# Null hypothesis probability of 6.33e-01 with 56 degrees of freedom

Photon flux (15-150 keV)    in 52 sec: 0.189762 ( -0.027101  0.02697 ) ph/cm2/s
Energy fluence (15-150 keV)             : 7.50604e-07 ( -1.42334e-07  1.43863e-07 ) ergs/cm2
Band function
Spectral model in the Band function:
------------------------------------------------------------
Parameters  : value       lower 90%   higher 90%
alpha       :    (     )
beta        :     (     )
Epeak [keV] :       (   )
Norm@50keV   :     (     )
------------------------------------------------------------

Photon flux (15-150 keV)    in  sec:  (    ) ph/cm2/s
Energy fluence (15-150 keV)             : 0 ( 0  0 ) ergs/cm2
S(25-50 keV) vs. S(50-100 keV) plot

S(25-50 keV)  = 1.89e-07
S(50-100 keV) = 2.90e-07
T90 vs. Hardness ratio plot
T90                                   = 41 sec.
Hardness ratio (energy fluence ratio) = 1.53439
Color vs. Color plot

Count Ratio  (25-50 keV) / (15-25 keV) = 1.98035
Count Ratio (50-100 keV) / (15-25 keV) = 1.29541
Mask shadow pattern

IMX = -1.261539998935572E-01, IMY = -1.382944636345954E-01
TIME vs. PHA plot around the trigger time

Blue+Cyan dotted lines: Time interval of the scaled map
From 0.000000 to 12.160000
TIME vs. DetID plot around the trigger time
Blue+Cyan dotted lines: Time interval of the scaled map
From 0.000000 to 12.160000
100 us light curve (15-350 keV)

Blue+Cyan dotted lines: Time interval of the scaled map
From 0.000000 to 12.160000
Spacecraft aspect plot

Bright source in the pre-burst/pre-slew/post-slew images
Pre-burst image of 15-350 keV band
Time interval of the image:
-239.856000 1.144000

# RAcent  DECcent POSerr Theta    Phi  PeakCts   SNR AngSep     Name
#  [deg]    [deg]    ['] [deg]  [deg]                   [']
 83.6486  21.9700    2.2  40.8  134.3   8.2212   5.2    2.8	Crab
119.0579  22.0036    3.2  38.0   81.7   5.2599   3.7 ------	UNKNOWN
 70.3296  44.4882    1.7  26.7  172.8   3.5412   6.8 ------	UNKNOWN
 43.1979  43.1471    2.7  41.5 -163.8   3.1769   4.2 ------	UNKNOWN
206.6215  50.5283    3.3  52.3  -28.3   7.4601   3.5 ------	UNKNOWN
227.2853  86.6905    3.4  32.7  -75.4   2.5607   3.5 ------	UNKNOWN
Pre-slew background subtracted image of 15-350 keV band
Time interval of the image:
1.144000 53.144000

# RAcent  DECcent POSerr Theta    Phi  PeakCts   SNR AngSep     Name
#  [deg]    [deg]    ['] [deg]  [deg]                   [']
 83.6844  22.1701    6.0  40.6  134.3   0.6250   1.9    9.8	Crab
141.3476  19.5050    2.6  46.5   52.9   2.3579   4.5 ------	UNKNOWN
 98.5712  49.8440    1.0  10.6  132.4   1.4036  11.8 ------	UNKNOWN
Post-slew image of 15-350 keV band
Time interval of the image:
112.044600 962.214600

# RAcent  DECcent POSerr Theta    Phi  PeakCts   SNR AngSep     Name
#  [deg]    [deg]    ['] [deg]  [deg]                   [']
 83.6297  21.9929    0.6  30.3  154.3  34.4477  18.1    1.3	Crab
128.4274  16.9825    2.1  40.7   79.1  42.7499   5.6 ------	UNKNOWN
 70.2868  44.5143    1.6  19.8 -148.8   9.9904   7.3 ------	UNKNOWN
Plot creation:
Fri Jun 16 09:16:36 EDT 2023