Estimated redshift from machine learning (Ukwatta et al. 2016) - may take a few minute to calcaulte
Image
Pre-slew 15.0-350.0 keV image (Event data)

#   RAcent    DECcent   POSerr    Theta     Phi              Peak Cts       SNR   Name
  202.0571    46.6856   0.0213    11.3250   174.1393         0.2508746      9.090 TRIG_01152764

Foreground time interval of the image:
  0.316   2.872 (delta_t =   2.556 [sec])
Background time interval of the image:
-239.888   0.316 (delta_t = 240.204 [sec])
Lightcurves
Notes:
- 1) The mask-weighted light curves are using the flight position.
- 2) Multiple plots of different time binning/intervals are shown to cover all scenarios of short/long GRBs, rate/image triggers, and real/false positives.
- 3) For all the mask-weighted lightcurves, the y-axis units are counts/sec/det where a det is 0.4 x 0.4 = 0.16 sq cm.
- 4) The verticle lines correspond to following: green dotted lines are T50 interval, black dotted lines are T90 interval, blue solid line(s) is a spacecraft slew start time, and orange solid line(s) is a spacecraft slew end time.
- 5) Time of each bin is in the middle of the bin.
1 s binning
From T0-310 s to T0+310 s

From T100_start - 20 s to T100_end + 30 s
Full time interval

64 ms binning
Full time interval
From T100_start to T100_end

From T0-5 sec to T0+5 sec
16 ms binning
From T100_start-5 s to T100_start+5 s

Blue+Cyan dotted lines: Time interval of the scaled map
From 0.000000 to 3.072000
8 ms binning
From T100_start-3 s to T100_start+3 s

Blue+Cyan dotted lines: Time interval of the scaled map
From 0.000000 to 3.072000
2 ms binning
From T100_start-1 s to T100_start+1 s

Blue+Cyan dotted lines: Time interval of the scaled map
From 0.000000 to 3.072000
SN=5 or 10 sec. binning (whichever binning is satisfied first)

SN=5 or 10 sec. binning (T < 200 sec)
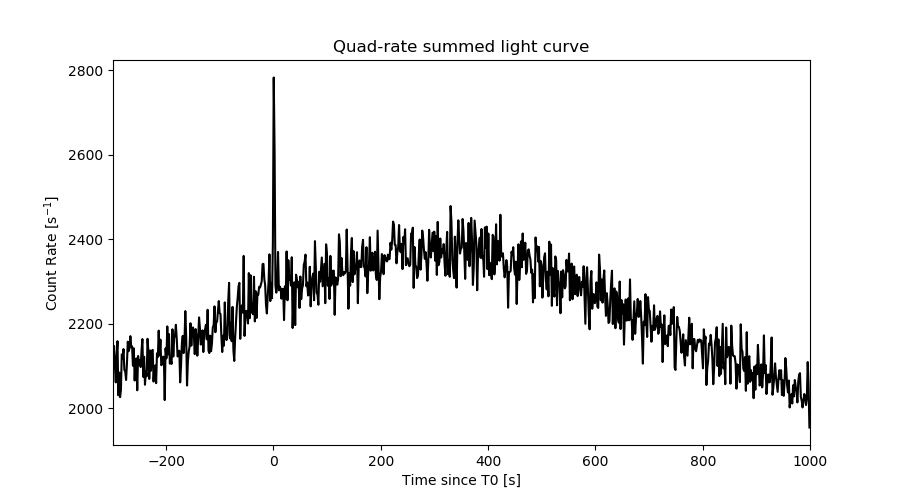
Quad-rate summed light curves (from T0-300s to T0+1000s)
Spectral Evolution

Spectra
Notes:
- 1) The fitting includes the systematic errors.
- 2) When the burst includes telescope slew time periods, the fitting uses an average response file made from multiple 5-s response files through out the slew time plus single time preiod for the non-slew times, and weighted by the total counts in the corresponding time period using addrmf. An average response file is needed becuase a spectral fit using the pre-slew DRM will introduce some errors in both a spectral shape and a normalization if the PHA file contains a lot of the slew/post-slew time interval.
- 3) For fits to more complicated models (e.g. a power-law over a cutoff power-law), the BAT team has decided to require a chi-square improvement of more than 6 for each extra dof.
Time averaged spectrum fit using the average DRM
Power-law model

Time interval is from    0.316 sec. to    2.872 sec.

Spectral model in power-law:
------------------------------------------------------------
Parameters  : value       lower 90%   higher 90%
Photon index: 1.43876     ( -0.289614   0.298135 )
Norm@50keV  : 6.51527E-03    ( -0.00116319   0.00114577 )
------------------------------------------------------------
#Fit statistic  : Chi-Squared                   37.79     using 59 bins.
 Reduced chi-squared = 0.662982
# Null hypothesis probability of 9.77e-01 with 57 degrees of freedom

Photon flux (15-150 keV)    in 2.556 sec: 0.800720 ( -0.135542  0.135599 ) ph/cm2/s
Energy fluence (15-150 keV)             : 1.59713e-07 ( -3.16274e-08  3.22514e-08 ) ergs/cm2
Cutoff power-law model
Time interval is from    0.316 sec. to    2.872 sec.
Spectral model in the cutoff power-law:
------------------------------------------------------------
Parameters  : value       lower 90%   higher 90%
Photon index: 1.00091     ( -1.51206   0.71085 )
Epeak [keV] : 112.848      ( -112.844 -112.844 )
Norm@50keV  : 1.09426E-02    ( -0.00548681   0.051557 )
------------------------------------------------------------
#Fit statistic  : Chi-Squared                   37.38     using 59 bins.
 Reduced chi-squared = 0.6675
# Null hypothesis probability of 9.74e-01 with 56 degrees of freedom

Photon flux (15-150 keV)    in 2.556 sec: 0.788264 ( -0.140834  0.139664 ) ph/cm2/s
Energy fluence (15-150 keV)             : 1.54504e-07 ( -3.43163e-08  3.49178e-08 ) ergs/cm2
Band function

Time interval is from    0.316 sec. to    2.872 sec.


Spectral model in the Band function:
------------------------------------------------------------
Parameters  : value       lower 90%   higher 90%
alpha       :    (     )
beta        :     (     )
Epeak [keV] :       (   )
Norm@50keV   :     (     )
------------------------------------------------------------

Photon flux (15-150 keV)    in  sec:  (    ) ph/cm2/s
Energy fluence (15-150 keV)             : 0 ( 0  0 ) ergs/cm2
Single BB

Spectral model blackbody:
------------------------------------------------------------
Parameters  : value    Lower 90%  Upper 90%
kT [keV]    : 15.1552  (-2.77986  3.58038)
R^2/D10^2   : 9.07011E-02  (-0.0471228   0.0911241)
(R is the radius in km and D10 is the distance to the source in units of 10 kpc)
------------------------------------------------------------
#Fit statistic  : Chi-Squared                   42.99     using 59 bins.
 Reduced chi-squared =
# Null hypothesis probability of 9.15e-01 with 57 degrees of freedom

Energy  Fluence     90% Error
[keV]   [erg/cm2]   [erg/cm2]
15- 25  1.113e-08   3.397e-09
25- 50  4.464e-08   1.163e-08
50-150  7.009e-08   2.507e-08
15-150  1.259e-07   3.270e-08
Thermal bremsstrahlung (OTTB)
Spectral model: thermal bremsstrahlung
------------------------------------------------------------
Parameters  : value         Lower 90%    Upper 90%
kT [keV]    : 199.363       (-91.7665      -199.363)
Norm        : 3.28102       (-0.553061     0.553053)
------------------------------------------------------------
#Fit statistic  : Chi-Squared                   37.85     using 59 bins.
 Reduced chi-squared =
# Null hypothesis probability of 9.76e-01 with 57 degrees of freedom

Energy  Fluence     90% Error
[keV]   [erg/cm2]   [erg/cm2]
15- 25  2.088e-08   1.198e-08
25- 50  4.017e-08   2.248e-08
50-150  8.810e-08   5.007e-08
15-150  1.492e-07   8.390e-08
Double BB

Spectral model: bbodyrad<1> + bbodyrad<2>
------------------------------------------------------------
Parameters  : value         Lower 90%    Upper 90%
kT1 [keV]   : 3.47818        (-1.8749      7.54418)
R1^2/D10^2  : 10.5965        (-10.3974      1605.92)
kT2 [keV]   : 18.2612        (-4.08235      24.8307)
R2^2/D10^2  : 4.38203E-02    (-0.042193   0.0643016)
------------------------------------------------------------
#Fit statistic  : Chi-Squared                   36.89     using 59 bins.
 Reduced chi-squared =
# Null hypothesis probability of 9.71e-01 with 55 degrees of freedom

Energy  Fluence     90% Error
[keV]   [erg/cm2]   [erg/cm2]
15- 25  1.944e-08   9.586e-09
25- 50  3.764e-08   1.768e-08
50-150  8.454e-08   4.781e-08
15-150  1.416e-07   6.202e-08
Peak spectrum fit
Power-law model

Time interval is from    1.744 sec. to    2.744 sec.

Spectral model in power-law:
------------------------------------------------------------
Parameters  : value       lower 90%   higher 90%
Photon index: 1.77574     ( -0.418079   0.487266 )
Norm@50keV  : 6.92121E-03    ( -0.00210856   0.00195745 )
------------------------------------------------------------
#Fit statistic  : Chi-Squared                   44.17     using 59 bins.
 Reduced chi-squared = 0.774912
# Null hypothesis probability of 8.93e-01 with 57 degrees of freedom

Photon flux (15-150 keV)    in 1 sec: 0.944954 ( -0.224618  0.224616 ) ph/cm2/s
Energy fluence (15-150 keV)             : 6.37911e-08 ( -1.89372e-08  1.95386e-08 ) ergs/cm2
Cutoff power-law model
Time interval is from    1.744 sec. to    2.744 sec.
Spectral model in the cutoff power-law:
------------------------------------------------------------
Parameters  : value       lower 90%   higher 90%
Photon index: 1.74610     ( -1.70918   1.88421 )
Epeak [keV] : 402.204      ( -404.416 -404.426 )
Norm@50keV  : 7.18276E-03    ( -0.00718372   0.0493428 )
------------------------------------------------------------
#Fit statistic  : Chi-Squared                   44.17     using 59 bins.
 Reduced chi-squared = 0.78875
# Null hypothesis probability of 8.74e-01 with 56 degrees of freedom

Photon flux (15-150 keV)    in 1 sec: 0.944409 ( -0.226002  0.224611 ) ph/cm2/s
Energy fluence (15-150 keV)             : 5.083e-08 ( -2.36637e-08  2.02112e-08 ) ergs/cm2
Band function

Time interval is from    1.744 sec. to    2.744 sec.


Spectral model in the Band function:
------------------------------------------------------------
Parameters  : value       lower 90%   higher 90%
alpha       :    (     )
beta        :     (     )
Epeak [keV] :       (   )
Norm@50keV   :     (     )
------------------------------------------------------------

Photon flux (15-150 keV)    in  sec:  (    ) ph/cm2/s
Energy fluence (15-150 keV)             : 0 ( 0  0 ) ergs/cm2
Single BB

Spectral model blackbody:
------------------------------------------------------------
Parameters  : value    Lower 90%  Upper 90%
kT [keV]    : 13.2814  (-4.36176  5.25891)
R^2/D10^2   : 0.160381  (-0.109378   0.476533)
(R is the radius in km and D10 is the distance to the source in units of 10 kpc)
------------------------------------------------------------
#Fit statistic  : Chi-Squared                   51.07     using 59 bins.
 Reduced chi-squared =
# Null hypothesis probability of 6.96e-01 with 57 degrees of freedom

Energy  Fluence     90% Error
[keV]   [erg/cm2]   [erg/cm2]
15- 25  5.997e-09   3.182e-09
25- 50  2.113e-08   1.037e-08
50-150  2.386e-08   1.415e-08
15-150  5.099e-08   2.732e-08
Thermal bremsstrahlung (OTTB)

Spectral model: thermal bremsstrahlung
------------------------------------------------------------
Parameters  : value         Lower 90%    Upper 90%
kT [keV]    : 120.177       (-70.7074      -118.957)
Norm        : 4.03303       (-1.06134     1.62607)
------------------------------------------------------------
#Fit statistic  : Chi-Squared                   44.45     using 59 bins.
 Reduced chi-squared =
# Null hypothesis probability of 8.87e-01 with 57 degrees of freedom

Energy  Fluence     90% Error
[keV]   [erg/cm2]   [erg/cm2]
15- 25  1.050e-08   6.220e-09
25- 50  1.880e-08   1.088e-08
50-150  3.357e-08   2.295e-08
15-150  6.287e-08   4.028e-08
Double BB

Spectral model: bbodyrad<1> + bbodyrad<2>
------------------------------------------------------------
Parameters  : value         Lower 90%    Upper 90%
kT1 [keV]   : 3.76911        (-1.82821      3.119)
R1^2/D10^2  : 13.9873        (-12.9334      666.79)
kT2 [keV]   : 19.3403        (-6.21612      13.3716)
R2^2/D10^2  : 3.57968E-02    (-0.0304294   0.0533515)
------------------------------------------------------------
#Fit statistic  : Chi-Squared                   42.75     using 59 bins.
 Reduced chi-squared =
# Null hypothesis probability of 8.85e-01 with 55 degrees of freedom

Energy  Fluence     90% Error
[keV]   [erg/cm2]   [erg/cm2]
15- 25  1.208e-08   6.575e-09
25- 50  1.561e-08   8.850e-09
50-150  3.514e-08   2.204e-08
15-150  6.283e-08   3.505e-08
Pre-slew spectrum (Pre-slew PHA with pre-slew DRM)
Power-law model

Spectral model in power-law:
------------------------------------------------------------
Parameters  : value       lower 90%   higher 90%
Photon index: 1.43876     ( -0.289614   0.298135 )
Norm@50keV  : 6.51527E-03    ( -0.00116319   0.00114577 )
------------------------------------------------------------
#Fit statistic  : Chi-Squared                   37.79     using 59 bins.
 Reduced chi-squared =
# Null hypothesis probability of 9.77e-01 with 57 degrees of freedom

Photon flux (15-150 keV)    in 2.556 sec: 0.800703 ( -0.135538  0.135594 ) ph/cm2/s
Energy fluence (15-150 keV)             : 1.59692e-07 ( -3.16154e-08  3.22751e-08 ) ergs/cm2
Cutoff power-law model

Spectral model in the cutoff power-law:
------------------------------------------------------------
Parameters  : value       lower 90%   higher 90%
Photon index: 1.00088     ( -1.51206   0.710854 )
Epeak [keV] : 112.845      ( -112.844 -112.844 )
Norm@50keV  : 1.09428E-02    ( -0.00548681   0.0515571 )
------------------------------------------------------------
#Fit statistic  : Chi-Squared                   37.38     using 59 bins.
 Reduced chi-squared =
# Null hypothesis probability of 9.74e-01 with 56 degrees of freedom

Photon flux (15-150 keV)    in 2.556 sec: 0.788184 ( -0.138306  0.139626 ) ph/cm2/s
Energy fluence (15-150 keV)             : 1.54566e-07 ( -3.46381e-08  3.49957e-08 ) ergs/cm2
Band function

Spectral model in the Band function:
------------------------------------------------------------
Parameters  : value       lower 90%   higher 90%
alpha       :    (     )
beta        :     (     )
Epeak [keV] :       (   )
Norm@50keV   :     (     )
------------------------------------------------------------

Photon flux (15-150 keV)    in  sec:  (    ) ph/cm2/s
Energy fluence (15-150 keV)             : 0 ( 0  0 ) ergs/cm2
S(25-50 keV) vs. S(50-100 keV) plot
S(25-50 keV)  = 3.83e-08
S(50-100 keV) = 5.65e-08
T90 vs. Hardness ratio plot
T90                                   = 2.29999995231628 sec.
Hardness ratio (energy fluence ratio) = 1.4752
Color vs. Color plot
Count Ratio  (25-50 keV) / (15-25 keV) = 1.29264
Count Ratio (50-100 keV) / (15-25 keV) = 0.990004
Mask shadow pattern

IMX = -1.992266900346516E-01, IMY = -2.045001260735579E-02
TIME vs. PHA plot around the trigger time

Blue+Cyan dotted lines: Time interval of the scaled map
From 0.000000 to 3.072000
TIME vs. DetID plot around the trigger time
Blue+Cyan dotted lines: Time interval of the scaled map
From 0.000000 to 3.072000
100 us light curve (15-350 keV)

Blue+Cyan dotted lines: Time interval of the scaled map
From 0.000000 to 3.072000
Spacecraft aspect plot

Bright source in the pre-burst/pre-slew/post-slew images
Pre-burst image of 15-350 keV band
Time interval of the image:
-239.888000 0.316000

# RAcent  DECcent POSerr Theta    Phi  PeakCts   SNR AngSep     Name
#  [deg]    [deg]    ['] [deg]  [deg]                   [']
254.3488  35.2554   12.7  39.3  -97.8   1.5491   0.9    7.5	Her X-1
184.3494  88.5749    2.8  53.0 -174.3   7.8484   4.2 ------	UNKNOWN
215.3942  38.9156    2.5   8.5 -109.1   2.0900   4.7 ------	UNKNOWN
249.7256  19.7552    2.7  41.8  -73.3   6.2860   4.3 ------	UNKNOWN
Pre-slew background subtracted image of 15-350 keV band
Time interval of the image:
0.316000 2.872000

# RAcent  DECcent POSerr Theta    Phi  PeakCts   SNR AngSep     Name
#  [deg]    [deg]    ['] [deg]  [deg]                   [']
254.4918  35.2705    5.7  39.4  -97.9  -0.2484  -2.0    4.6	Her X-1
205.2538 -17.8457    2.5  53.5    6.7   0.4124   4.6 ------	UNKNOWN
202.0570  46.6856    1.3  11.3  174.1   0.2508   9.1 ------	UNKNOWN
234.8250  50.2787    2.2  25.7 -127.4   0.1797   5.2 ------	UNKNOWN
Post-slew image of 15-350 keV band
Time interval of the image:
80.412640 962.198600

# RAcent  DECcent POSerr Theta    Phi  PeakCts   SNR AngSep     Name
#  [deg]    [deg]    ['] [deg]  [deg]                   [']
254.4970  35.3706    9.3  40.3  -84.6   6.2911   1.2    2.6	Her X-1
147.9890  36.2684    2.5  41.0  104.0  19.8063   4.7 ------	UNKNOWN
173.7769  60.2035    2.4  21.3  148.2   8.3633   4.8 ------	UNKNOWN
Plot creation:
Fri Jun 16 09:14:41 EDT 2023