Estimated redshift from machine learning (Ukwatta et al. 2016) - may take a few minute to calcaulte
Image
Pre-slew 15.0-350.0 keV image (Event data)

#   RAcent    DECcent   POSerr    Theta     Phi              Peak Cts       SNR   Name
  113.9660    -7.9936   0.0187    15.9063    89.7704         2.4961010     10.317 TRIG_01154815

Foreground time interval of the image:
-81.072  16.784 (delta_t =  97.856 [sec])
Background time interval of the image:
-239.600 -81.072 (delta_t = 158.528 [sec])
Lightcurves
Notes:
- 1) The mask-weighted light curves are using the flight position.
- 2) Multiple plots of different time binning/intervals are shown to cover all scenarios of short/long GRBs, rate/image triggers, and real/false positives.
- 3) For all the mask-weighted lightcurves, the y-axis units are counts/sec/det where a det is 0.4 x 0.4 = 0.16 sq cm.
- 4) The verticle lines correspond to following: green dotted lines are T50 interval, black dotted lines are T90 interval, blue solid line(s) is a spacecraft slew start time, and orange solid line(s) is a spacecraft slew end time.
- 5) Time of each bin is in the middle of the bin.
1 s binning
From T0-310 s to T0+310 s
From T100_start - 20 s to T100_end + 30 s
Full time interval

64 ms binning
Full time interval
From T100_start to T100_end

From T0-5 sec to T0+5 sec
16 ms binning
From T100_start-5 s to T100_start+5 s
Blue+Cyan dotted lines: Time interval of the scaled map
From 0.000000 to 2.048000
8 ms binning
From T100_start-3 s to T100_start+3 s
Blue+Cyan dotted lines: Time interval of the scaled map
From 0.000000 to 2.048000
2 ms binning
From T100_start-1 s to T100_start+1 s
Blue+Cyan dotted lines: Time interval of the scaled map
From 0.000000 to 2.048000
SN=5 or 10 sec. binning (whichever binning is satisfied first)
SN=5 or 10 sec. binning (T < 200 sec)
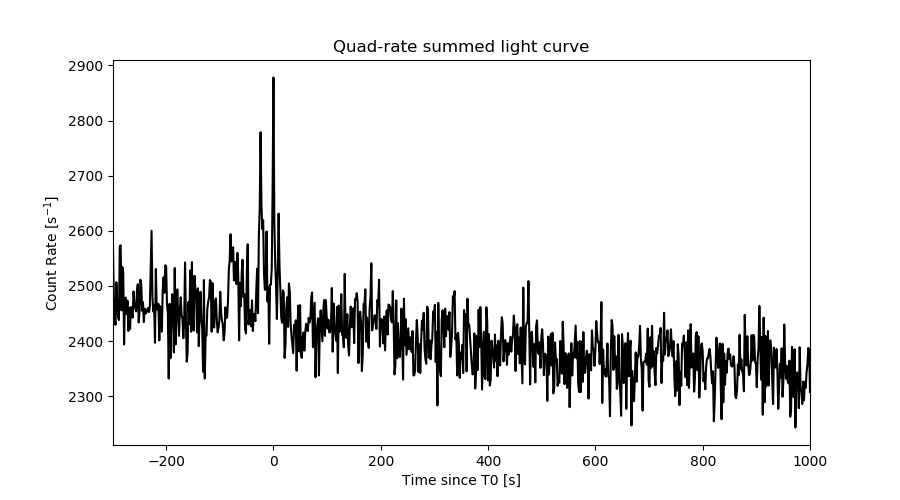
Quad-rate summed light curves (from T0-300s to T0+1000s)
Spectral Evolution

Spectra
Notes:
- 1) The fitting includes the systematic errors.
- 2) When the burst includes telescope slew time periods, the fitting uses an average response file made from multiple 5-s response files through out the slew time plus single time preiod for the non-slew times, and weighted by the total counts in the corresponding time period using addrmf. An average response file is needed becuase a spectral fit using the pre-slew DRM will introduce some errors in both a spectral shape and a normalization if the PHA file contains a lot of the slew/post-slew time interval.
- 3) For fits to more complicated models (e.g. a power-law over a cutoff power-law), the BAT team has decided to require a chi-square improvement of more than 6 for each extra dof.
Time averaged spectrum fit using the average DRM
Power-law model
Time interval is from  -81.072 sec. to   16.784 sec.

Spectral model in power-law:
------------------------------------------------------------
Parameters  : value       lower 90%   higher 90%
Photon index: 1.91784     ( -0.225357   0.239715 )
Norm@50keV  : 1.39331E-03    ( -0.000223385   0.000217549 )
------------------------------------------------------------
#Fit statistic  : Chi-Squared                   46.52     using 59 bins.
 Reduced chi-squared = 0.81614
# Null hypothesis probability of 8.38e-01 with 57 degrees of freedom

Photon flux (15-150 keV)    in 97.86 sec: 0.201498 ( -0.024838  0.024838 ) ph/cm2/s
Energy fluence (15-150 keV)             : 1.25405e-06 ( -1.9224e-07  1.97983e-07 ) ergs/cm2
Cutoff power-law model

Time interval is from  -81.072 sec. to   16.784 sec.
Spectral model in the cutoff power-law:
------------------------------------------------------------
Parameters  : value       lower 90%   higher 90%
Photon index: 1.33441     ( -1.071   0.778934 )
Epeak [keV] : 47.2292      ( -45.8543 -47.2292 )
Norm@50keV  : 3.04777E-03    ( -0.0030478   0.00968434 )
------------------------------------------------------------
#Fit statistic  : Chi-Squared                   45.26     using 59 bins.
 Reduced chi-squared = 0.808214
# Null hypothesis probability of 8.47e-01 with 56 degrees of freedom

Photon flux (15-150 keV)    in 97.86 sec: 0.197352 ( -0.025479  0.025551 ) ph/cm2/s
Energy fluence (15-150 keV)             : 1.17656e-06 ( -2.08026e-07  2.2698e-07 ) ergs/cm2
Band function

Time interval is from  -81.072 sec. to   16.784 sec.


Spectral model in the Band function:
------------------------------------------------------------
Parameters  : value       lower 90%   higher 90%
alpha       :    (     )
beta        :     (     )
Epeak [keV] :       (   )
Norm@50keV   :     (     )
------------------------------------------------------------

Photon flux (15-150 keV)    in  sec:  (    ) ph/cm2/s
Energy fluence (15-150 keV)             : 0 ( 0  0 ) ergs/cm2
Single BB

Spectral model blackbody:
------------------------------------------------------------
Parameters  : value    Lower 90%  Upper 90%
kT [keV]    : 10.5167  (-1.55821  1.78884)
R^2/D10^2   : 7.81392E-02  (-0.0347523   0.064498)
(R is the radius in km and D10 is the distance to the source in units of 10 kpc)
------------------------------------------------------------
#Fit statistic  : Chi-Squared                   59.03     using 59 bins.
 Reduced chi-squared =
# Null hypothesis probability of 4.01e-01 with 57 degrees of freedom

Energy  Fluence     90% Error
[keV]   [erg/cm2]   [erg/cm2]
15- 25  1.749e-07   4.149e-08
25- 50  4.661e-07   8.230e-08
50-150  2.810e-07   9.390e-08
15-150  9.220e-07   1.588e-07
Thermal bremsstrahlung (OTTB)
Spectral model: thermal bremsstrahlung
------------------------------------------------------------
Parameters  : value         Lower 90%    Upper 90%
kT [keV]    : 74.0484       (-24.6263      47.9942)
Norm        : 0.974159       (-0.170341     0.210096)
------------------------------------------------------------
#Fit statistic  : Chi-Squared                   45.28     using 59 bins.
 Reduced chi-squared =
# Null hypothesis probability of 8.69e-01 with 57 degrees of freedom

Energy  Fluence     90% Error
[keV]   [erg/cm2]   [erg/cm2]
15- 25  2.459e-07   4.325e-08
25- 50  3.971e-07   6.312e-08
50-150  5.314e-07   2.779e-07
15-150  1.174e-06   2.445e-07
Double BB
Spectral model: bbodyrad<1> + bbodyrad<2>
------------------------------------------------------------
Parameters  : value         Lower 90%    Upper 90%
kT1 [keV]   : 4.42956        (-1.43748      1.8134)
R1^2/D10^2  : 1.30823        (-0.976853      6.56555)
kT2 [keV]   : 15.7088        (-3.42159      6.12042)
R2^2/D10^2  : 1.38594E-02    (-0.0102368   0.0237038)
------------------------------------------------------------
#Fit statistic  : Chi-Squared                   43.76     using 59 bins.
 Reduced chi-squared =
# Null hypothesis probability of 8.62e-01 with 55 degrees of freedom

Energy  Fluence     90% Error
[keV]   [erg/cm2]   [erg/cm2]
15- 25  2.563e-07   1.317e-07
25- 50  3.771e-07   1.974e-07
50-150  4.947e-07   2.881e-07
15-150  1.128e-06   5.127e-07
Peak spectrum fit
Power-law model
Time interval is from   -0.132 sec. to    0.868 sec.

Spectral model in power-law:
------------------------------------------------------------
Parameters  : value       lower 90%   higher 90%
Photon index: 1.91109     ( -0.353413   0.389502 )
Norm@50keV  : 8.51229E-03    ( -0.00232082   0.0022499 )
------------------------------------------------------------
#Fit statistic  : Chi-Squared                   63.14     using 59 bins.
 Reduced chi-squared = 1.10772
# Null hypothesis probability of 2.68e-01 with 57 degrees of freedom

Photon flux (15-150 keV)    in 1 sec: 1.22747 ( -0.264896  0.26491 ) ph/cm2/s
Energy fluence (15-150 keV)             : 7.82871e-08 ( -2.02641e-08  2.11595e-08 ) ergs/cm2
Cutoff power-law model

Time interval is from   -0.132 sec. to    0.868 sec.
Spectral model in the cutoff power-law:
------------------------------------------------------------
Parameters  : value       lower 90%   higher 90%
Photon index: 0.550152     ( -2.90733   1.5399 )
Epeak [keV] : 41.9529      ( -41.9417 78.488 )
Norm@50keV  : 5.64273E-02    ( -0.0565738   4.20011 )
------------------------------------------------------------
#Fit statistic  : Chi-Squared                   60.95     using 59 bins.
 Reduced chi-squared = 1.08839
# Null hypothesis probability of 3.02e-01 with 56 degrees of freedom

Photon flux (15-150 keV)    in 1 sec: 1.19643 ( -0.264396  0.26582 ) ph/cm2/s
Energy fluence (15-150 keV)             : 6.90542e-08 ( -1.99193e-08  2.32093e-08 ) ergs/cm2
Band function

Time interval is from   -0.132 sec. to    0.868 sec.


Spectral model in the Band function:
------------------------------------------------------------
Parameters  : value       lower 90%   higher 90%
alpha       :    (     )
beta        :     (     )
Epeak [keV] :       (   )
Norm@50keV   :     (     )
------------------------------------------------------------

Photon flux (15-150 keV)    in  sec:  (    ) ph/cm2/s
Energy fluence (15-150 keV)             : 0 ( 0  0 ) ergs/cm2
Single BB
Spectral model blackbody:
------------------------------------------------------------
Parameters  : value    Lower 90%  Upper 90%
kT [keV]    : 9.55905  (-1.9471  2.63346)
R^2/D10^2   : 0.723005  (-0.440599   1.00011)
(R is the radius in km and D10 is the distance to the source in units of 10 kpc)
------------------------------------------------------------
#Fit statistic  : Chi-Squared                   62.81     using 59 bins.
 Reduced chi-squared =
# Null hypothesis probability of 2.78e-01 with 57 degrees of freedom

Energy  Fluence     90% Error
[keV]   [erg/cm2]   [erg/cm2]
15- 25  1.323e-08   6.074e-09
25- 50  3.081e-08   1.242e-08
50-150  1.409e-08   8.163e-09
15-150  5.813e-08   2.038e-08
Thermal bremsstrahlung (OTTB)
Spectral model: thermal bremsstrahlung
------------------------------------------------------------
Parameters  : value         Lower 90%    Upper 90%
kT [keV]    : 69.7327       (-31.5624      92.5276)
Norm        : 6.17610       (-1.70541     2.41289)
------------------------------------------------------------
#Fit statistic  : Chi-Squared                   61.47     using 59 bins.
 Reduced chi-squared =
# Null hypothesis probability of 3.19e-01 with 57 degrees of freedom

Energy  Fluence     90% Error
[keV]   [erg/cm2]   [erg/cm2]
15- 25  1.584e-08   5.063e-09
25- 50  2.517e-08   8.560e-09
50-150  3.224e-08   2.469e-08
15-150  7.326e-08   3.601e-08
Double BB
Spectral model: bbodyrad<1> + bbodyrad<2>
------------------------------------------------------------
Parameters  : value         Lower 90%    Upper 90%
kT1 [keV]   : 6.83968        (-7.12113      -7.12113)
R1^2/D10^2  : 1.78598        (-1.65147      -1.65147)
kT2 [keV]   : 18.7589        (-20.5402      -20.5402)
R2^2/D10^2  : 2.88302E-02    (-0.0213677   0.900595)
------------------------------------------------------------
#Fit statistic  : Chi-Squared                   60.39     using 59 bins.
 Reduced chi-squared =
# Null hypothesis probability of 2.87e-01 with 55 degrees of freedom

Energy  Fluence     90% Error
[keV]   [erg/cm2]   [erg/cm2]
15- 25  1.510e-08   9.290e-09
25- 50  2.669e-08   1.569e-08
50-150  2.724e-08   1.722e-08
15-150  6.902e-08   3.732e-08
Pre-slew spectrum (Pre-slew PHA with pre-slew DRM)
Power-law model

Spectral model in power-law:
------------------------------------------------------------
Parameters  : value       lower 90%   higher 90%
Photon index: 1.91784     ( -0.225357   0.239715 )
Norm@50keV  : 1.39331E-03    ( -0.000223385   0.000217549 )
------------------------------------------------------------
#Fit statistic  : Chi-Squared                   46.52     using 59 bins.
 Reduced chi-squared =
# Null hypothesis probability of 8.38e-01 with 57 degrees of freedom

Photon flux (15-150 keV)    in 97.86 sec: 0.201485 ( -0.0248366  0.0248366 ) ph/cm2/s
Energy fluence (15-150 keV)             : 1.25382e-06 ( -1.92112e-07  1.98043e-07 ) ergs/cm2
Cutoff power-law model

Spectral model in the cutoff power-law:
------------------------------------------------------------
Parameters  : value       lower 90%   higher 90%
Photon index: 1.33439     ( -1.071   0.778933 )
Epeak [keV] : 47.2292      ( -45.7521 -47.2292 )
Norm@50keV  : 3.04782E-03    ( -0.00304781   0.00968434 )
------------------------------------------------------------
#Fit statistic  : Chi-Squared                   45.26     using 59 bins.
 Reduced chi-squared =
# Null hypothesis probability of 8.47e-01 with 56 degrees of freedom

Photon flux (15-150 keV)    in 97.86 sec: 0.197313 ( -0.02547  0.025542 ) ph/cm2/s
Energy fluence (15-150 keV)             : 1.17688e-06 ( -2.08333e-07  2.27202e-07 ) ergs/cm2
Band function

Spectral model in the Band function:
------------------------------------------------------------
Parameters  : value       lower 90%   higher 90%
alpha       :    (     )
beta        :     (     )
Epeak [keV] :       (   )
Norm@50keV   :     (     )
------------------------------------------------------------

Photon flux (15-150 keV)    in  sec:  (    ) ph/cm2/s
Energy fluence (15-150 keV)             : 0 ( 0  0 ) ergs/cm2
S(25-50 keV) vs. S(50-100 keV) plot

S(25-50 keV)  = 3.68e-07
S(50-100 keV) = 3.89e-07
T90 vs. Hardness ratio plot

T90                                   = 91.1999999284744 sec.
Hardness ratio (energy fluence ratio) = 1.05707
Color vs. Color plot
Count Ratio  (25-50 keV) / (15-25 keV) = 0.9561
Count Ratio (50-100 keV) / (15-25 keV) = 0.466653
Mask shadow pattern

IMX = 1.141749730817181E-03, IMY = -2.849734827103940E-01
TIME vs. PHA plot around the trigger time

Blue+Cyan dotted lines: Time interval of the scaled map
From 0.000000 to 2.048000
TIME vs. DetID plot around the trigger time
Blue+Cyan dotted lines: Time interval of the scaled map
From 0.000000 to 2.048000
100 us light curve (15-350 keV)
Blue+Cyan dotted lines: Time interval of the scaled map
From 0.000000 to 2.048000
Spacecraft aspect plot
Bright source in the pre-burst/pre-slew/post-slew images
Pre-burst image of 15-350 keV band
Time interval of the image:
-239.600000 -81.072000

# RAcent  DECcent POSerr Theta    Phi  PeakCts   SNR AngSep     Name
#  [deg]    [deg]    ['] [deg]  [deg]                   [']
 83.6254  22.0298    0.9  43.9   14.0   6.2416  13.3    1.0	Crab
135.4708 -40.6720    4.1  36.8  173.0   1.4016   2.8    7.5	Vela X-1
138.2138   1.0800    2.0  41.0  104.0   6.4128   5.7 ------	UNKNOWN
124.0647 -69.1731    2.3  52.9 -151.8   4.7692   5.0 ------	UNKNOWN
Pre-slew background subtracted image of 15-350 keV band
Time interval of the image:
-81.072000 16.784000

# RAcent  DECcent POSerr Theta    Phi  PeakCts   SNR AngSep     Name
#  [deg]    [deg]    ['] [deg]  [deg]                   [']
 83.6275  22.1202    5.5  43.9   14.0   0.8718   2.1    6.4	Crab
135.6180 -40.5044    7.3  36.8  172.7   0.4676   1.6    5.1	Vela X-1
113.9659  -7.9936    1.1  15.9   89.8   2.4963  10.3 ------	UNKNOWN
 93.4855  10.3446    2.5  29.6   22.2   1.2078   4.6 ------	UNKNOWN
148.0983 -55.0577    2.5  51.0 -174.3   2.4570   4.5 ------	UNKNOWN
 84.2404 -11.2161    2.8  18.0  -31.4   0.9204   4.1 ------	UNKNOWN
136.4612 -57.0511    2.5  46.7 -167.3   1.8101   4.6 ------	UNKNOWN
Post-slew image of 15-350 keV band
Time interval of the image:
82.900590 962.526800

# RAcent  DECcent POSerr Theta    Phi  PeakCts   SNR AngSep     Name
#  [deg]    [deg]    ['] [deg]  [deg]                   [']
 83.6239  22.0147    0.8  42.3  -14.7  34.8150  14.2    0.5	Crab
135.5968 -40.5753    3.4  37.8 -177.7   8.3506   3.4    3.3	Vela X-1
163.5885 -29.9427    2.5  51.3  151.7  46.2118   4.6 ------	UNKNOWN
Plot creation:
Fri Jun 16 09:14:05 EDT 2023