Estimated redshift from machine learning (Ukwatta et al. 2016) - may take a few minute to calcaulte
Image
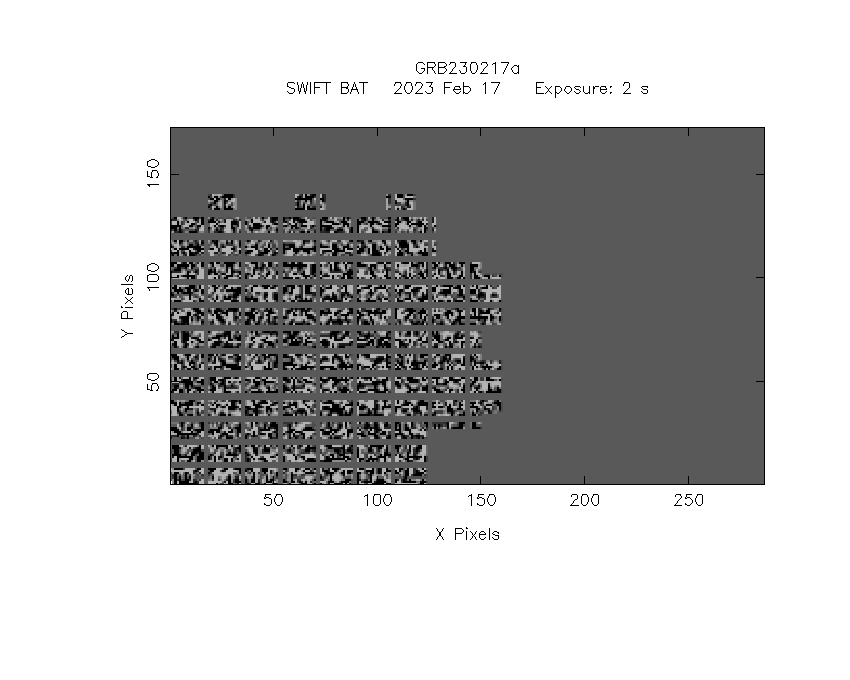
Pre-slew 15.0-350.0 keV image (Event data)
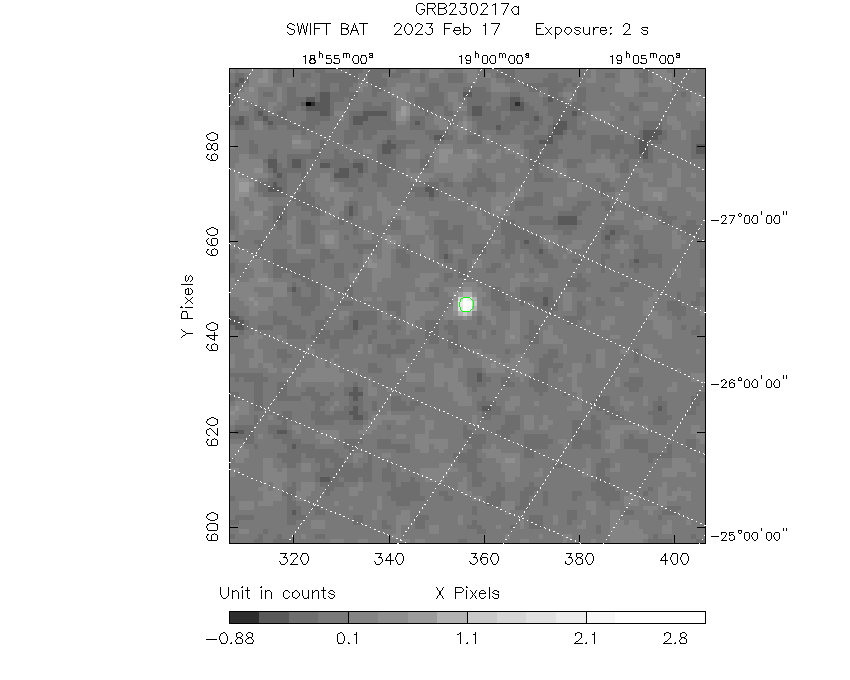
#   RAcent    DECcent   POSerr    Theta     Phi              Peak Cts       SNR   Name
  280.7594   -28.8403   0.0090    49.1442   -18.0131         3.1176393     21.380 TRIG_01154967

Foreground time interval of the image:
 -0.256   1.840 (delta_t =   2.096 [sec])
Background time interval of the image:
-239.680  -0.256 (delta_t = 239.424 [sec])
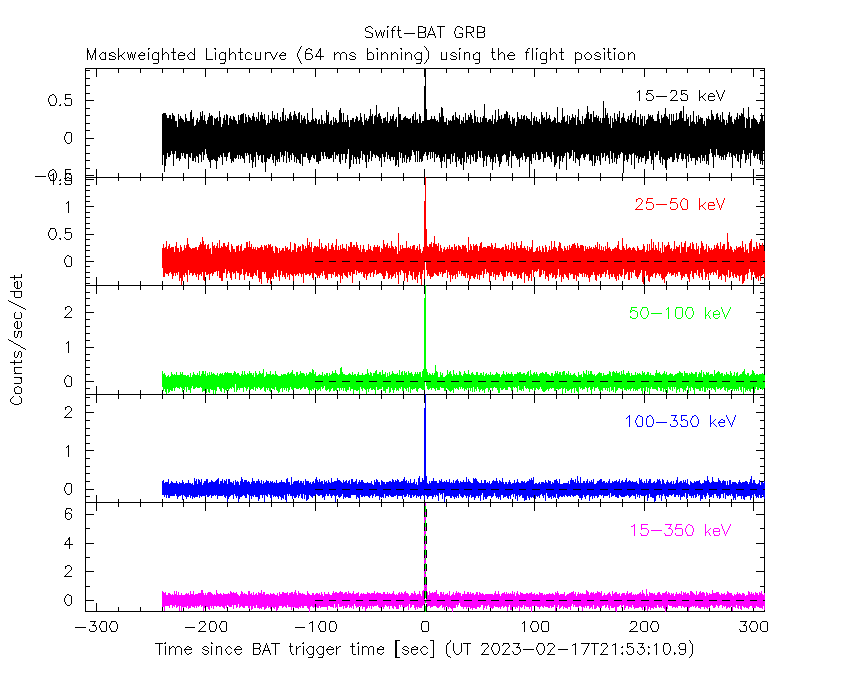
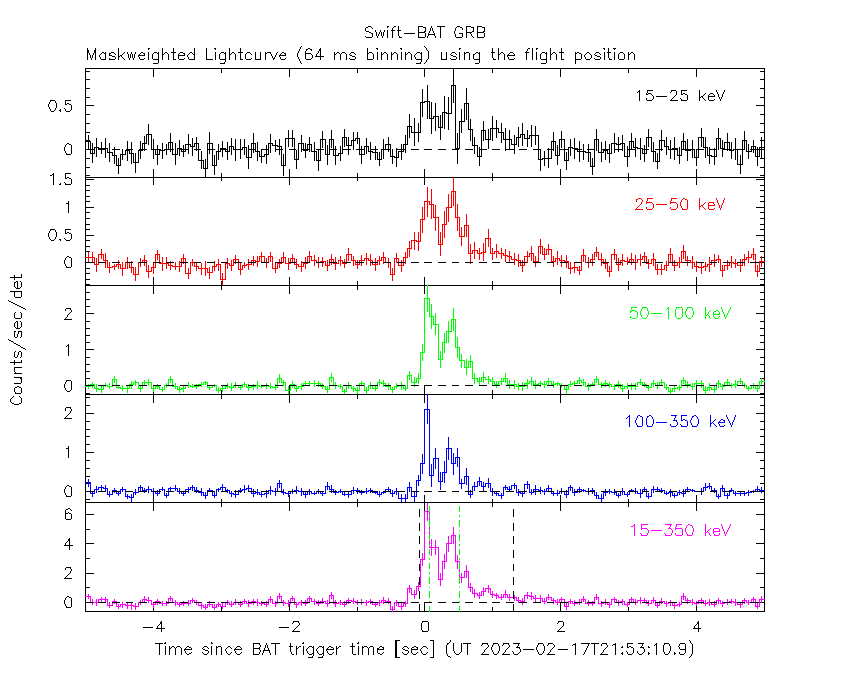
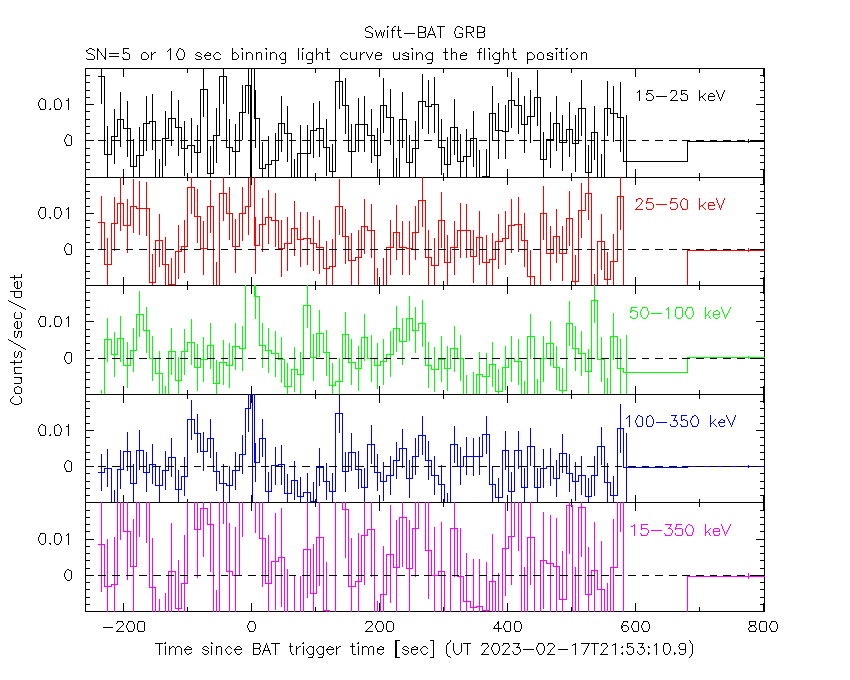
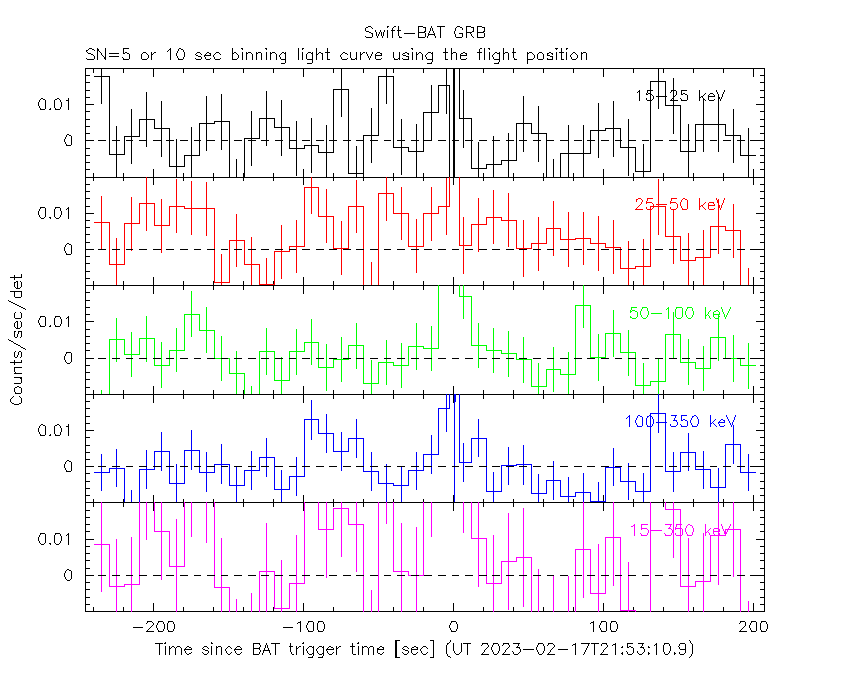
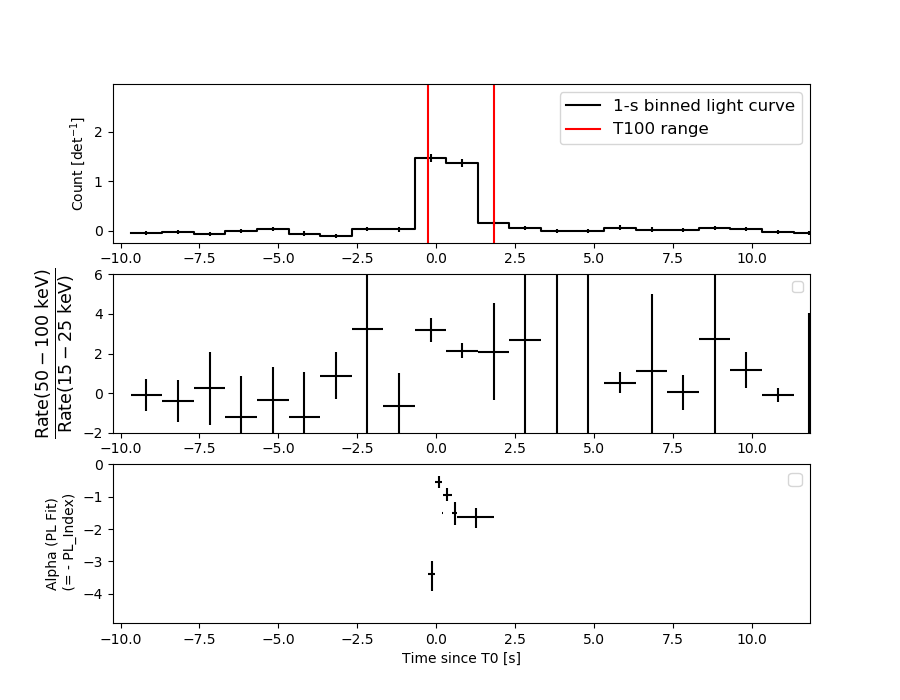
Lightcurves
Notes:
- 1) The mask-weighted light curves are using the flight position.
- 2) Multiple plots of different time binning/intervals are shown to cover all scenarios of short/long GRBs, rate/image triggers, and real/false positives.
- 3) For all the mask-weighted lightcurves, the y-axis units are counts/sec/det where a det is 0.4 x 0.4 = 0.16 sq cm.
- 4) The verticle lines correspond to following: green dotted lines are T50 interval, black dotted lines are T90 interval, blue solid line(s) is a spacecraft slew start time, and orange solid line(s) is a spacecraft slew end time.
- 5) Time of each bin is in the middle of the bin.
1 s binning
From T0-310 s to T0+310 s

From T100_start - 20 s to T100_end + 30 s

Full time interval

64 ms binning
Full time interval
From T100_start to T100_end
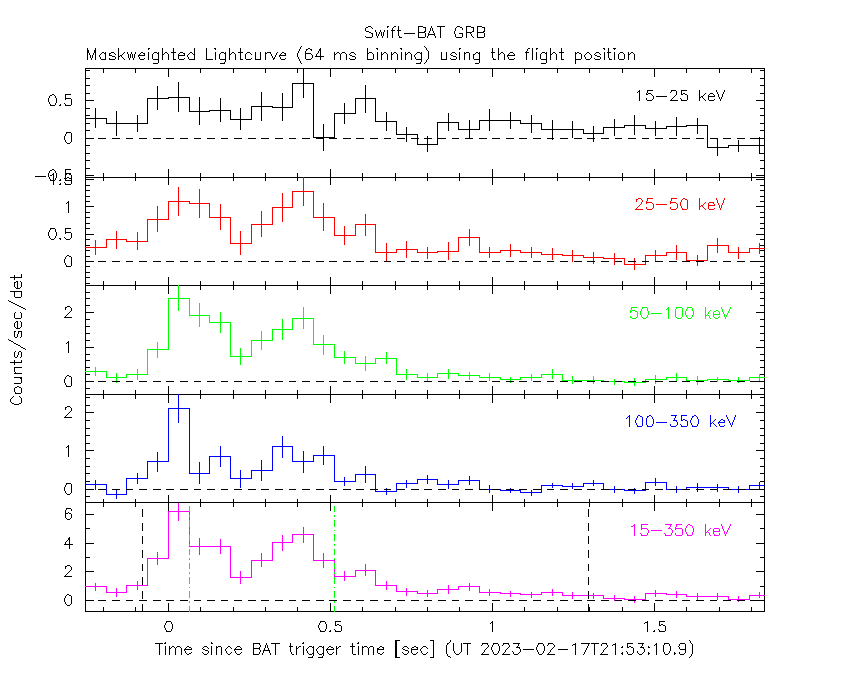
From T0-5 sec to T0+5 sec
16 ms binning
From T100_start-5 s to T100_start+5 s

Blue+Cyan dotted lines: Time interval of the scaled map
From 0.000000 to 0.064000
8 ms binning
From T100_start-3 s to T100_start+3 s

Blue+Cyan dotted lines: Time interval of the scaled map
From 0.000000 to 0.064000
2 ms binning
From T100_start-1 s to T100_start+1 s
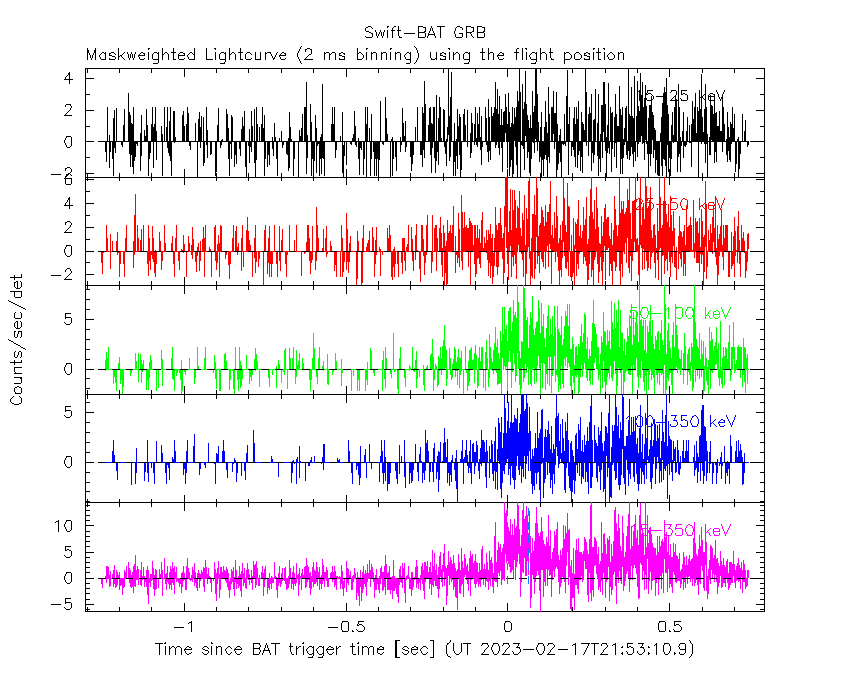
Blue+Cyan dotted lines: Time interval of the scaled map
From 0.000000 to 0.064000
SN=5 or 10 sec. binning (whichever binning is satisfied first)
SN=5 or 10 sec. binning (T < 200 sec)
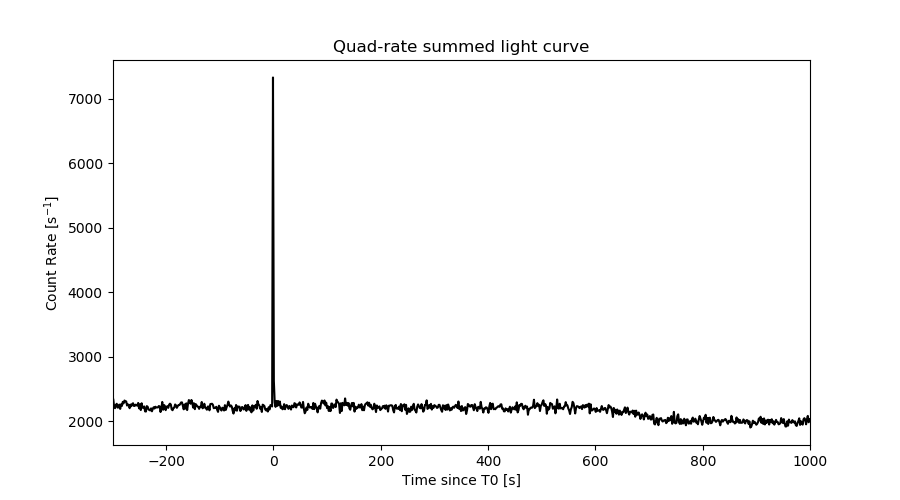
Quad-rate summed light curves (from T0-300s to T0+1000s)
Spectral Evolution
Spectra
Notes:
- 1) The fitting includes the systematic errors.
- 2) When the burst includes telescope slew time periods, the fitting uses an average response file made from multiple 5-s response files through out the slew time plus single time preiod for the non-slew times, and weighted by the total counts in the corresponding time period using addrmf. An average response file is needed becuase a spectral fit using the pre-slew DRM will introduce some errors in both a spectral shape and a normalization if the PHA file contains a lot of the slew/post-slew time interval.
- 3) For fits to more complicated models (e.g. a power-law over a cutoff power-law), the BAT team has decided to require a chi-square improvement of more than 6 for each extra dof.
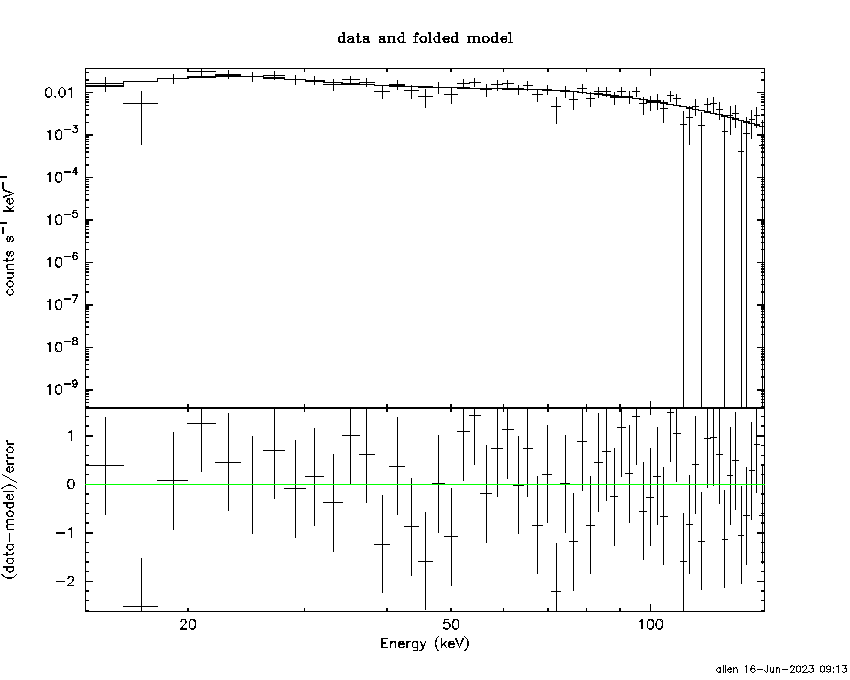
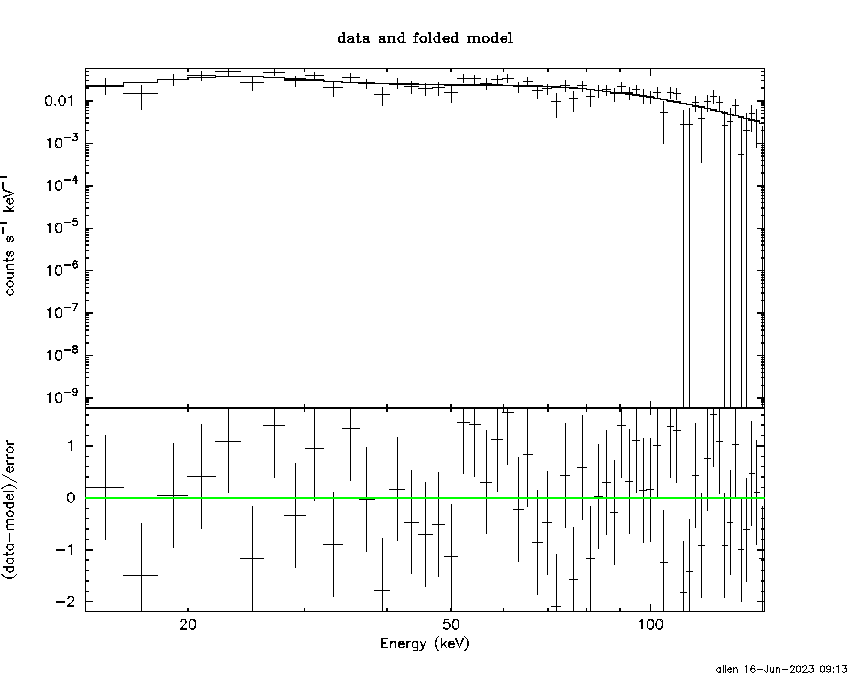
Time averaged spectrum fit using the average DRM
Power-law model
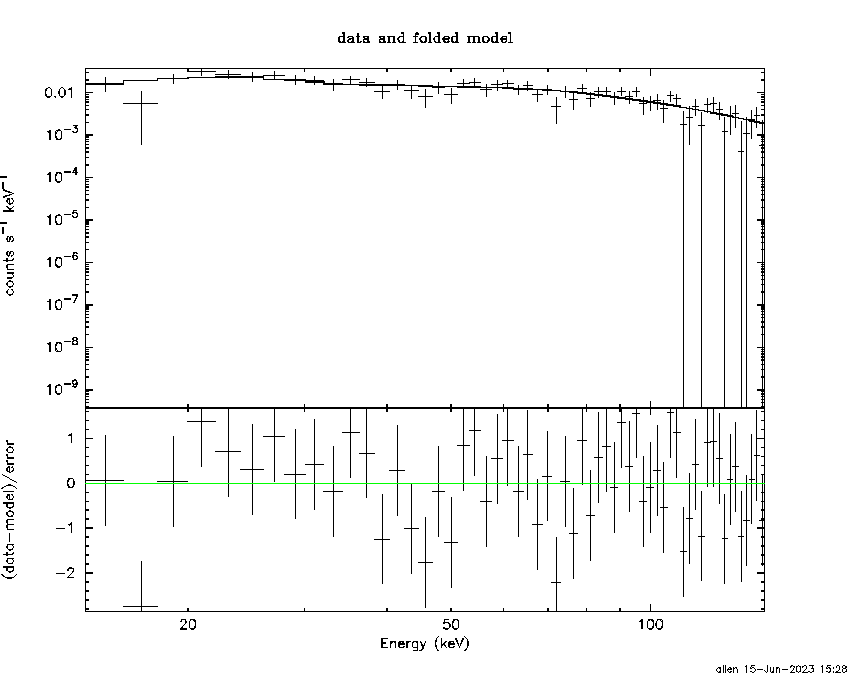
Time interval is from   -0.256 sec. to    1.840 sec.

Spectral model in power-law:
------------------------------------------------------------
Parameters  : value       lower 90%   higher 90%
Photon index: 0.974149     ( -0.119066   0.116988 )
Norm@50keV  : 0.100813    ( -0.0069036   0.00687858 )
------------------------------------------------------------
#Fit statistic  : Chi-Squared                   54.27     using 59 bins.
 Reduced chi-squared = 0.952105
# Null hypothesis probability of 5.78e-01 with 57 degrees of freedom

Photon flux (15-150 keV)    in 2.096 sec: 9.51637E-02 (    ) ph/cm2/s
Energy fluence (15-150 keV)             : 2.30648e-06 ( -1.66098e-07  1.66617e-07 ) ergs/cm2
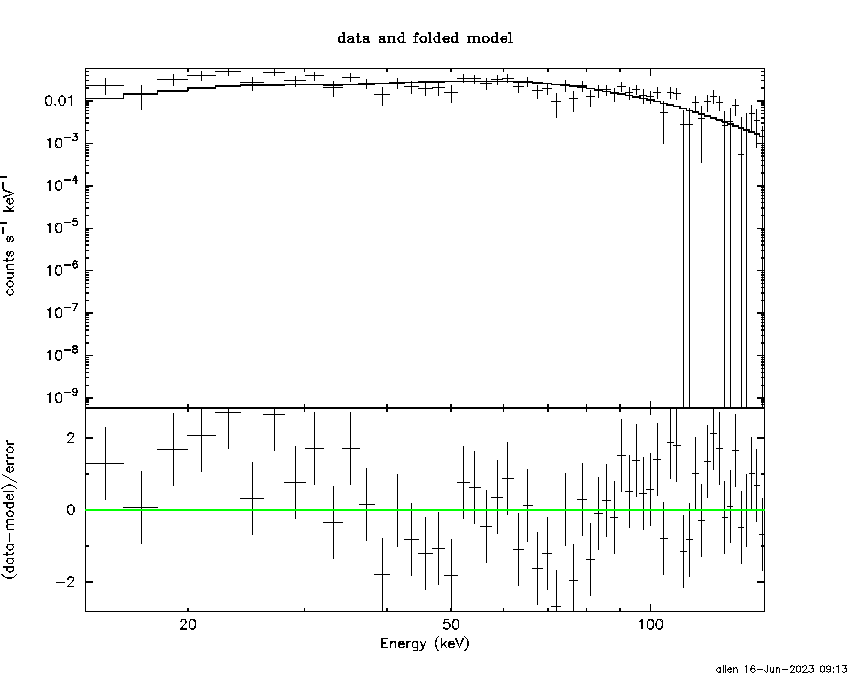
Cutoff power-law model

Time interval is from   -0.256 sec. to    1.840 sec.
Spectral model in the cutoff power-law:
------------------------------------------------------------
Parameters  : value       lower 90%   higher 90%
Photon index: 0.872096     ( -0.428322   0.128773 )
Epeak [keV] : 657.793      ( -965.017 -965.017 )
Norm@50keV  : 0.111696    ( -0.0118983   0.0556396 )
------------------------------------------------------------
#Fit statistic  : Chi-Squared                   54.26     using 59 bins.
 Reduced chi-squared = 0.968929
# Null hypothesis probability of 5.41e-01 with 56 degrees of freedom

Photon flux (15-150 keV)    in 2.096 sec: 11.5779 ( -0.8358  0.8191 ) ph/cm2/s
Energy fluence (15-150 keV)             : 2.29917e-06 ( -1.65967e-07  1.73591e-07 ) ergs/cm2
Band function

Time interval is from   -0.256 sec. to    1.840 sec.


Spectral model in the Band function:
------------------------------------------------------------
Parameters  : value       lower 90%   higher 90%
alpha       :    (     )
beta        :     (     )
Epeak [keV] :       (   )
Norm@50keV   :     (     )
------------------------------------------------------------

Photon flux (15-150 keV)    in  sec:  (    ) ph/cm2/s
Energy fluence (15-150 keV)             : 0 ( 0  0 ) ergs/cm2
Single BB
Spectral model blackbody:
------------------------------------------------------------
Parameters  : value    Lower 90%  Upper 90%
kT [keV]    : 23.9499  (-2.24484  2.58721)
R^2/D10^2   : 0.321760  (-0.0871469   0.115227)
(R is the radius in km and D10 is the distance to the source in units of 10 kpc)
------------------------------------------------------------
#Fit statistic  : Chi-Squared                   99.47     using 59 bins.
 Reduced chi-squared =
# Null hypothesis probability of 4.26e-04 with 57 degrees of freedom

Energy  Fluence     90% Error
[keV]   [erg/cm2]   [erg/cm2]
15- 25  6.871e-08   9.474e-09
25- 50  3.812e-07   4.255e-08
50-150  1.629e-06   1.636e-07
15-150  2.079e-06   1.781e-07
Thermal bremsstrahlung (OTTB)
Spectral model: thermal bremsstrahlung
------------------------------------------------------------
Parameters  : value         Lower 90%    Upper 90%
kT [keV]    : 199.363       (      )
Norm        : 47.1757       (     )
------------------------------------------------------------
#Fit statistic  : Chi-Squared                  120.57     using 59 bins.
 Reduced chi-squared =
# Null hypothesis probability of 1.86e-06 with 57 degrees of freedom

Energy  Fluence     90% Error
[keV]   [erg/cm2]   [erg/cm2]
15- 25  2.462e-07   2.012e-08
25- 50  4.736e-07   5.722e-08
50-150  1.039e-06   2.950e-07
15-150  1.759e-06   3.566e-07
Double BB
Spectral model: bbodyrad<1> + bbodyrad<2>
------------------------------------------------------------
Parameters  : value         Lower 90%    Upper 90%
kT1 [keV]   : 7.97019        (-1.596      2.08601)
R1^2/D10^2  : 5.76612        (-2.99999      6.55898)
kT2 [keV]   : 38.3837        (-6.8566      12.4066)
R2^2/D10^2  : 6.75684E-02    (-0.0368415   0.055293)
------------------------------------------------------------
#Fit statistic  : Chi-Squared                   50.01     using 59 bins.
 Reduced chi-squared =
# Null hypothesis probability of 6.65e-01 with 55 degrees of freedom

Energy  Fluence     90% Error
[keV]   [erg/cm2]   [erg/cm2]
15- 25  1.662e-07   6.083e-08
25- 50  4.275e-07   1.226e-07
50-150  1.758e-06   4.657e-07
15-150  2.351e-06   6.072e-07
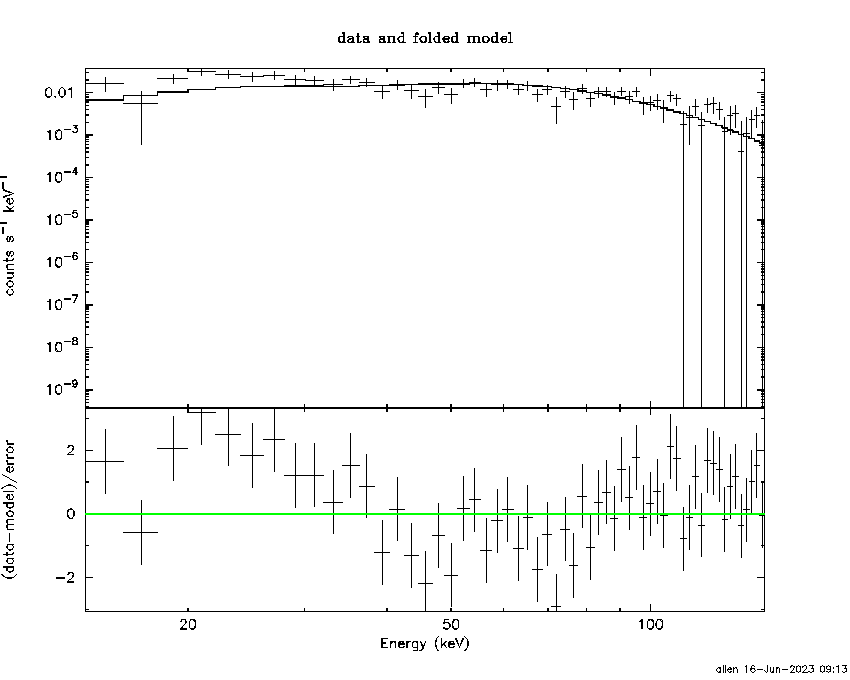
Peak spectrum fit
Power-law model
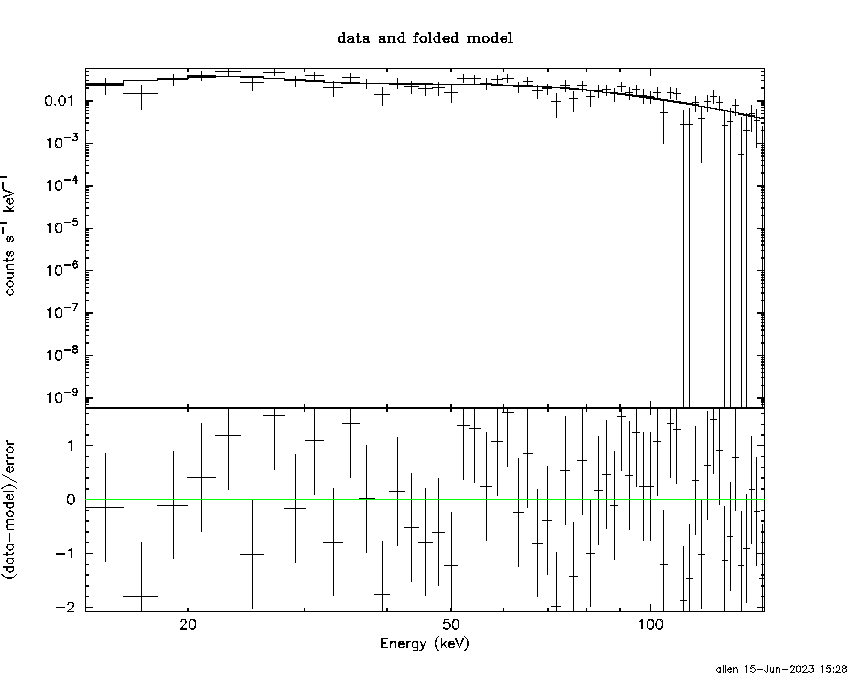
Time interval is from   -0.252 sec. to    0.748 sec.

Spectral model in power-law:
------------------------------------------------------------
Parameters  : value       lower 90%   higher 90%
Photon index: 0.845332     ( -0.122842   0.120158 )
Norm@50keV  : 0.175407    ( -0.0128031   0.0127317 )
------------------------------------------------------------
#Fit statistic  : Chi-Squared                   62.83     using 59 bins.
 Reduced chi-squared = 1.10228
# Null hypothesis probability of 2.78e-01 with 57 degrees of freedom

Photon flux (15-150 keV)    in 1 sec: 0.630385 ( 0.038211  0.615735 ) ph/cm2/s
Energy fluence (15-150 keV)             : 2.01196e-06 ( -1.52187e-07  1.52602e-07 ) ergs/cm2
Cutoff power-law model
Time interval is from   -0.252 sec. to    0.748 sec.
Spectral model in the cutoff power-law:
------------------------------------------------------------
Parameters  : value       lower 90%   higher 90%
Photon index: 0.628871     ( -0.498266   0.339746 )
Epeak [keV] : 387.179      ( -387.179 -387.179 )
Norm@50keV  : 0.216753    ( -0.0509434   0.128689 )
------------------------------------------------------------
#Fit statistic  : Chi-Squared                   62.17     using 59 bins.
 Reduced chi-squared = 1.11018
# Null hypothesis probability of 2.66e-01 with 56 degrees of freedom

Photon flux (15-150 keV)    in 1 sec: 20.0344 ( -1.4694  1.4707 ) ph/cm2/s
Energy fluence (15-150 keV)             : 3.85896e-08 ( -3.85894e-08  -3.77218e-08 ) ergs/cm2
Band function

Time interval is from   -0.252 sec. to    0.748 sec.


Spectral model in the Band function:
------------------------------------------------------------
Parameters  : value       lower 90%   higher 90%
alpha       :    (     )
beta        :     (     )
Epeak [keV] :       (   )
Norm@50keV   :     (     )
------------------------------------------------------------

Photon flux (15-150 keV)    in  sec:  (    ) ph/cm2/s
Energy fluence (15-150 keV)             : 0 ( 0  0 ) ergs/cm2
Single BB
Spectral model blackbody:
------------------------------------------------------------
Parameters  : value    Lower 90%  Upper 90%
kT [keV]    : 25.6091  (-2.44168  2.85029)
R^2/D10^2   : 0.479624  (-0.130034   0.170082)
(R is the radius in km and D10 is the distance to the source in units of 10 kpc)
------------------------------------------------------------
#Fit statistic  : Chi-Squared                   91.75     using 59 bins.
 Reduced chi-squared =
# Null hypothesis probability of 2.40e-03 with 57 degrees of freedom

Energy  Fluence     90% Error
[keV]   [erg/cm2]   [erg/cm2]
15- 25  5.394e-08   8.085e-09
25- 50  3.097e-07   3.705e-08
50-150  1.501e-06   1.515e-07
15-150  1.864e-06   1.830e-07
Thermal bremsstrahlung (OTTB)

Spectral model: thermal bremsstrahlung
------------------------------------------------------------
Parameters  : value         Lower 90%    Upper 90%
kT [keV]    : 199.363       (      )
Norm        : 78.2966       (     )
------------------------------------------------------------
#Fit statistic  : Chi-Squared                  151.37     using 59 bins.
 Reduced chi-squared =
# Null hypothesis probability of 1.72e-10 with 57 degrees of freedom

Energy  Fluence     90% Error
[keV]   [erg/cm2]   [erg/cm2]
15- 25  1.950e-07   1.735e-08
25- 50  3.750e-07   5.130e-08
50-150  8.225e-07   2.502e-07
15-150  1.393e-06   4.282e-07
Double BB
Spectral model: bbodyrad<1> + bbodyrad<2>
------------------------------------------------------------
Parameters  : value         Lower 90%    Upper 90%
kT1 [keV]   : 8.14499        (-2.16773      3.11342)
R1^2/D10^2  : 7.54501        (-4.619      13.5347)
kT2 [keV]   : 37.6243        (-6.79766      13.6869)
R2^2/D10^2  : 0.135954    (-0.0803578   0.114368)
------------------------------------------------------------
#Fit statistic  : Chi-Squared                   60.12     using 59 bins.
 Reduced chi-squared =
# Null hypothesis probability of 2.96e-01 with 55 degrees of freedom

Energy  Fluence     90% Error
[keV]   [erg/cm2]   [erg/cm2]
15- 25  1.176e-07   5.409e-08
25- 50  3.392e-07   1.186e-07
50-150  1.582e-06   4.331e-07
15-150  2.038e-06   6.171e-07
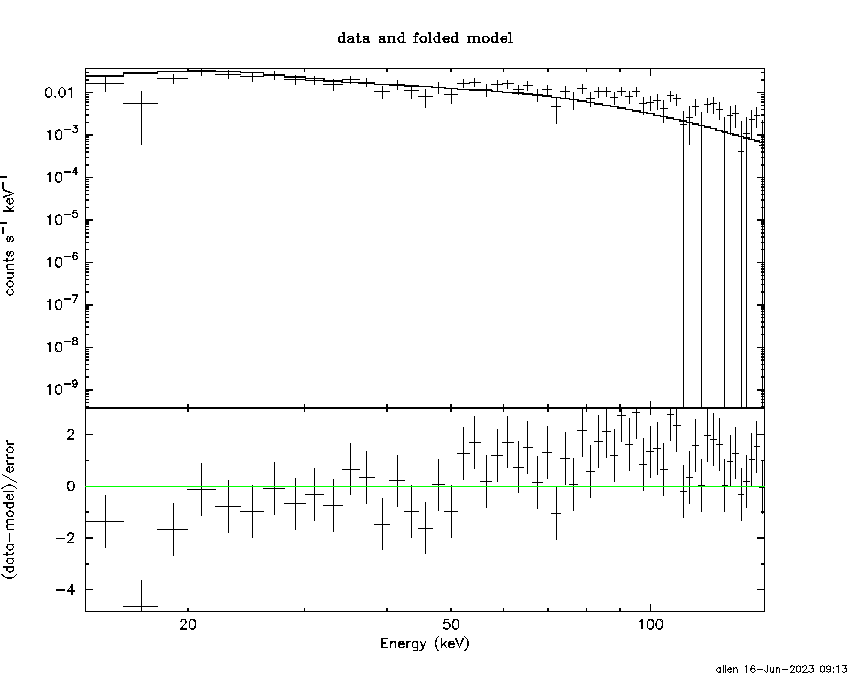
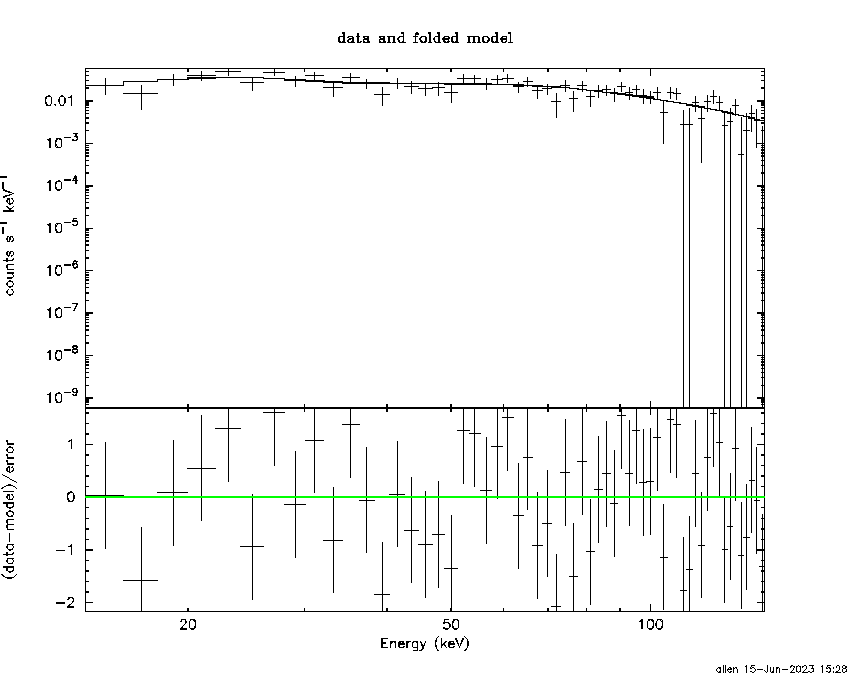
Pre-slew spectrum (Pre-slew PHA with pre-slew DRM)
Power-law model

Spectral model in power-law:
------------------------------------------------------------
Parameters  : value       lower 90%   higher 90%
Photon index: 0.974149     ( -0.119066   0.116988 )
Norm@50keV  : 0.100813    ( -0.0069036   0.00687858 )
------------------------------------------------------------
#Fit statistic  : Chi-Squared                   54.27     using 59 bins.
 Reduced chi-squared =
# Null hypothesis probability of 5.78e-01 with 57 degrees of freedom

Photon flux (15-150 keV)    in 2.096 sec: 11.5925 ( -0.80579  0.806879 ) ph/cm2/s
Energy fluence (15-150 keV)             : 2.30625e-06 ( -1.66237e-07  1.66568e-07 ) ergs/cm2
Cutoff power-law model

Spectral model in the cutoff power-law:
------------------------------------------------------------
Parameters  : value       lower 90%   higher 90%
Photon index: 0.920922     ( -0.448852   0.159064 )
Epeak [keV] : 998.182      ( -998.918 -998.918 )
Norm@50keV  : 0.107718    ( -0.01208   0.0559881 )
------------------------------------------------------------
#Fit statistic  : Chi-Squared                   54.25     using 59 bins.
 Reduced chi-squared =
# Null hypothesis probability of 5.41e-01 with 56 degrees of freedom

Photon flux (15-150 keV)    in 2.096 sec: 11.5964 ( -0.8062  0.7998 ) ph/cm2/s
Energy fluence (15-150 keV)             : 2.30403e-06 ( 0  0 ) ergs/cm2
Band function

Spectral model in the Band function:
------------------------------------------------------------
Parameters  : value       lower 90%   higher 90%
alpha       :    (     )
beta        :     (     )
Epeak [keV] :       (   )
Norm@50keV   :     (     )
------------------------------------------------------------

Photon flux (15-150 keV)    in  sec:  (    ) ph/cm2/s
Energy fluence (15-150 keV)             : 0 ( 0  0 ) ergs/cm2
S(25-50 keV) vs. S(50-100 keV) plot
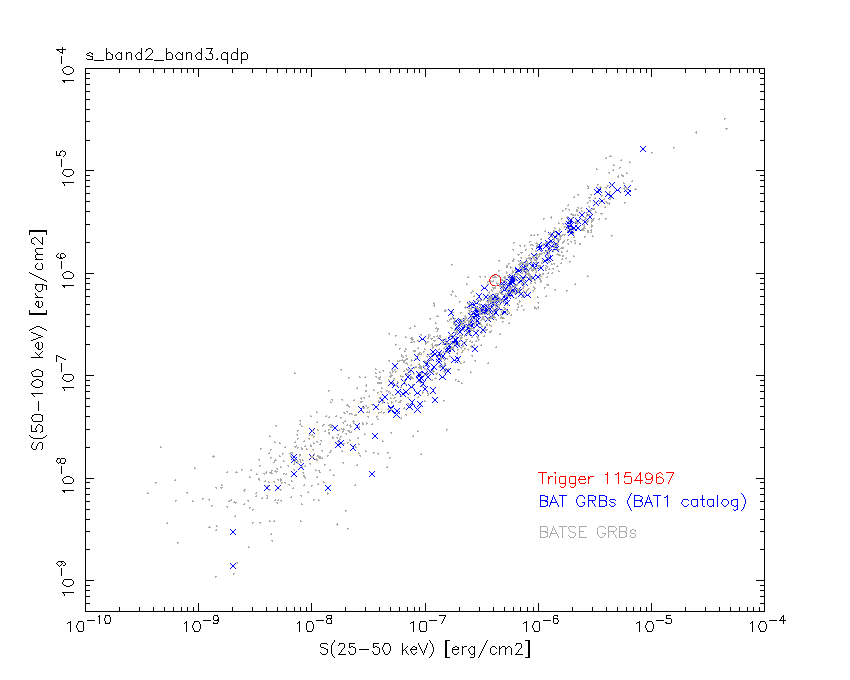
S(25-50 keV)  = 4.19e-07
S(50-100 keV) = 8.55e-07
T90 vs. Hardness ratio plot
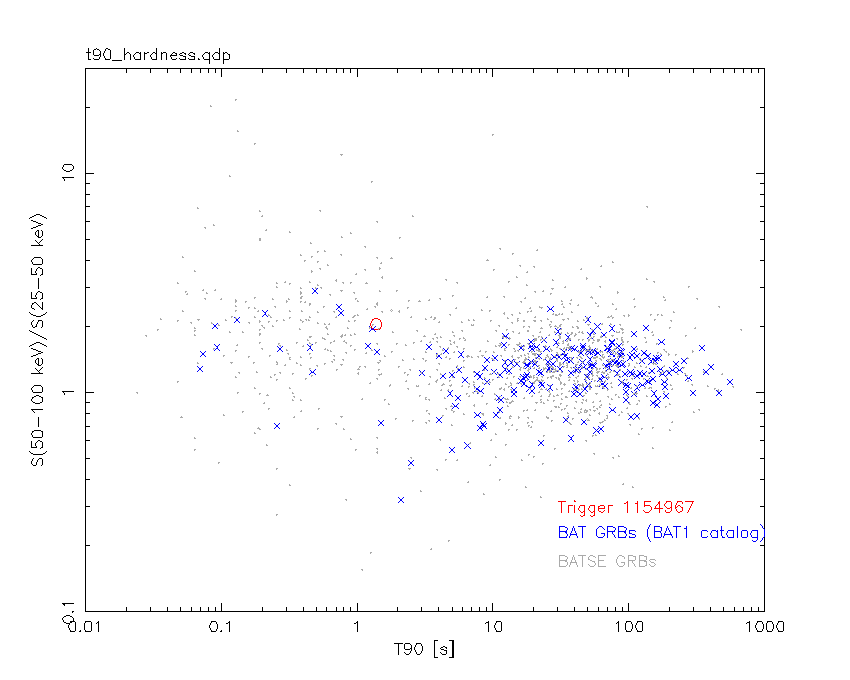
T90                                   = 1.37600004673004 sec.
Hardness ratio (energy fluence ratio) = 2.04057
Color vs. Color plot
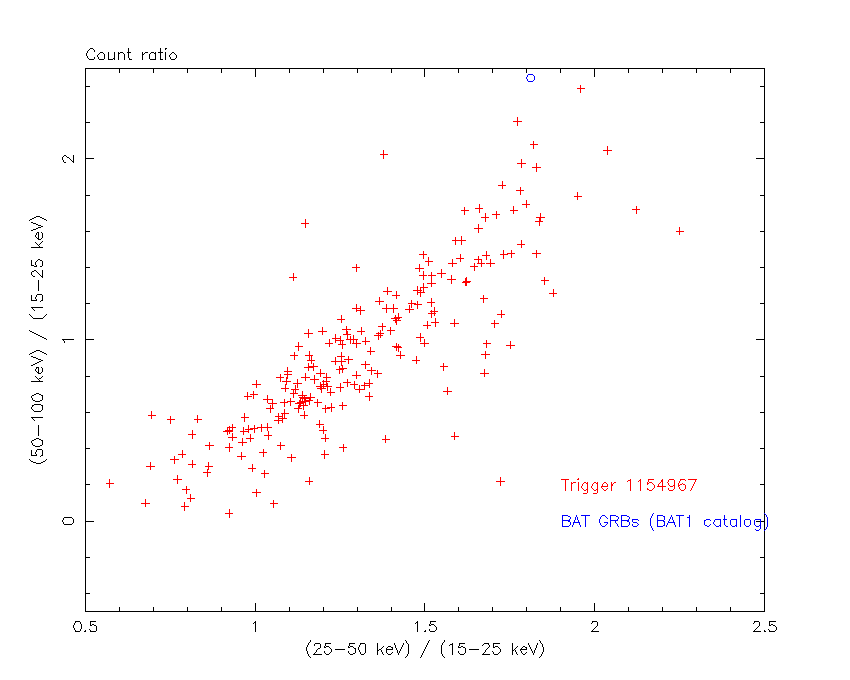
Count Ratio  (25-50 keV) / (15-25 keV) = 1.81062
Count Ratio (50-100 keV) / (15-25 keV) = 2.44664
Mask shadow pattern
IMX = 1.099561992504283E+00, IMY = 3.575473926437373E-01
TIME vs. PHA plot around the trigger time
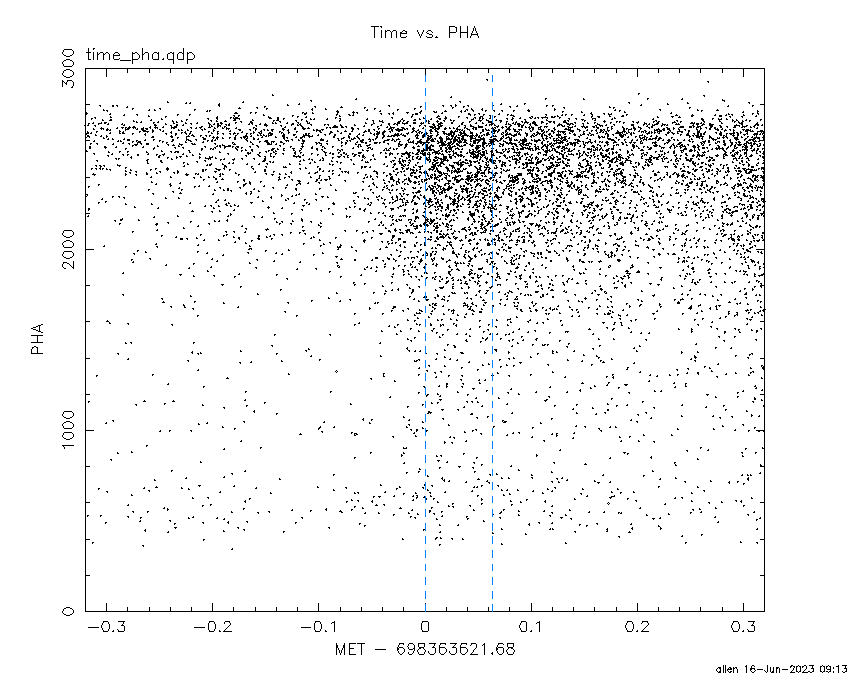
Blue+Cyan dotted lines: Time interval of the scaled map
From 0.000000 to 0.064000
TIME vs. DetID plot around the trigger time

Blue+Cyan dotted lines: Time interval of the scaled map
From 0.000000 to 0.064000
100 us light curve (15-350 keV)

Blue+Cyan dotted lines: Time interval of the scaled map
From 0.000000 to 0.064000
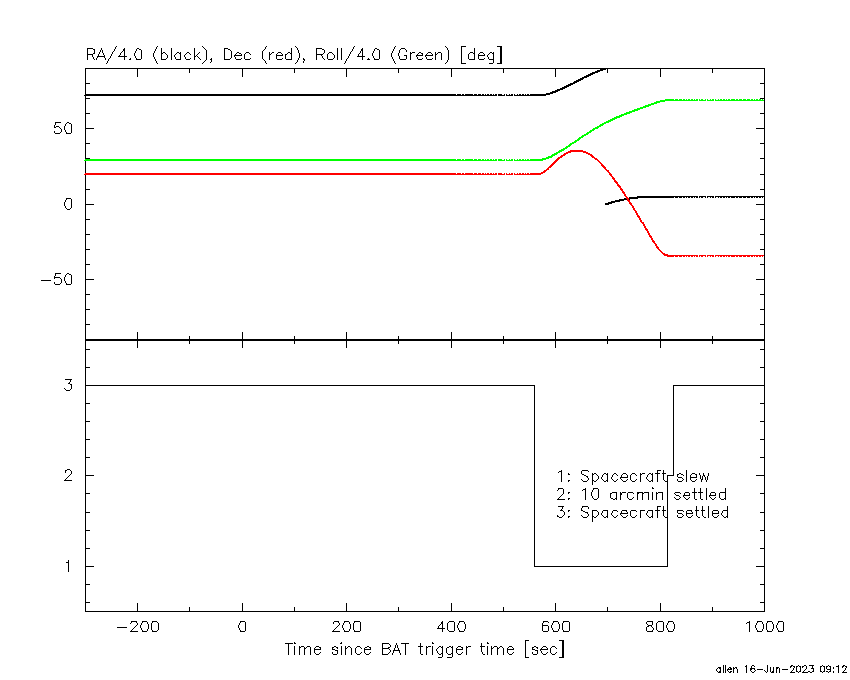
Spacecraft aspect plot
Bright source in the pre-burst/pre-slew/post-slew images
Pre-burst image of 15-350 keV band
Time interval of the image:
-239.680000 -0.256000

# RAcent  DECcent POSerr Theta    Phi  PeakCts   SNR AngSep     Name
#  [deg]    [deg]    ['] [deg]  [deg]                   [']
254.2903  35.2370    3.4  33.6   97.8  -3.2392  -3.4   10.4	Her X-1
262.8961 -24.7392   10.4  50.9    3.4   0.8577   1.1    6.2	GX 1+4
268.3610  -1.4714   55.1  28.9   18.1   0.1332   0.2    1.2	SW J1753.5-0127
270.2218 -24.9758    5.8  48.1   -4.5   1.2404   2.0    7.1	GX 5-1
270.3430 -25.7330    3.5  48.7   -5.1   2.2274   3.3    2.3	GRS 1758-258
273.9333 -13.9080    6.3  36.5   -2.9   1.1931   1.8    8.8	GX 17+2
275.8401 -30.3026    5.6  51.5  -13.0  -1.8478  -2.1    5.9	H1820-303
285.0945 -25.0438    6.5  44.9  -22.6   1.2833   1.8    8.1	HT1900.1-2455
288.9006  10.8157    3.8   9.0  -30.7  -1.5433  -3.0    9.8	GRS 1915+105
299.5662  35.1991    1.5  18.4 -176.2   3.9324   7.6    1.2	Cyg X-1
308.1518  40.9575    3.0  27.1 -172.4   1.9376   3.8    1.9	Cyg X-3
326.1533  38.1109    0.0  37.5 -154.2  -1.4600  -1.9   12.7	Cyg X-2
311.9838  65.3486    3.5  48.2  166.3   7.5846   3.3 ------	UNKNOWN
286.1854  14.6247    2.6   5.5   -5.2   2.2386   4.5 ------	UNKNOWN
Pre-slew background subtracted image of 15-350 keV band
Time interval of the image:
-0.256000 1.840000

# RAcent  DECcent POSerr Theta    Phi  PeakCts   SNR AngSep     Name
#  [deg]    [deg]    ['] [deg]  [deg]                   [']
254.3077  35.4885    0.0  33.7   98.2   0.0467   0.5   11.4	Her X-1
262.8866 -24.7569    6.6  50.9    3.4  -0.2341  -1.7    6.7	GX 1+4
268.5182  -1.3636    3.7  28.7   18.0  -0.1873  -3.1   10.5	SW J1753.5-0127
270.2733 -24.9871    5.1  48.1   -4.6  -0.2569  -2.2    5.6	GX 5-1
270.3624 -25.8475   23.0  48.8   -5.1   0.0542   0.5    7.1	GRS 1758-258
274.1562 -13.9396   14.3  36.5   -3.2  -0.0536  -0.8   10.5	GX 17+2
275.8102 -30.3539   39.0  51.5  -13.0   0.0501   0.3    6.0	H1820-303
285.1577 -24.9613   10.1  44.8  -22.7   0.1225   1.1    7.1	HT1900.1-2455
288.6315  10.9519  281.7   8.8  -29.0   0.0020   0.0    9.8	GRS 1915+105
299.4395  35.2732   19.2  18.4 -176.6  -0.0289  -0.6    8.5	Cyg X-1
308.0008  41.0600    8.5  27.1 -172.8   0.0736   1.4    8.1	Cyg X-3
326.1872  38.3129   58.5  37.6 -154.5   0.0150   0.2    0.9	Cyg X-2
277.6204  68.5266    2.5  49.2  148.2   0.8253   4.6 ------	UNKNOWN
276.8460 -23.2320    3.2  44.4  -11.6   0.3337   3.6 ------	UNKNOWN
346.2560  55.8439    2.3  55.9 -171.7   1.0632   5.1 ------	UNKNOWN
280.7594 -28.8403    0.5  49.1  -18.0   3.1180  21.4 ------	UNKNOWN
Post-slew image of 15-350 keV band
Time interval of the image:
814.520600 962.453200

# RAcent  DECcent POSerr Theta    Phi  PeakCts   SNR AngSep     Name
#  [deg]    [deg]    ['] [deg]  [deg]                   [']
 57.4508 -79.9327    3.7  48.2  166.3   3.9944   3.1 ------	UNKNOWN
 19.8508 -28.5809    2.6   5.5   -4.9   1.3091   4.5 ------	UNKNOWN
347.4193 -18.6688    2.4  32.7  -75.6   2.3913   4.8 ------	UNKNOWN
Plot creation:
Fri Jun 16 09:13:30 EDT 2023