Estimated redshift from machine learning (Ukwatta et al. 2016) - may take a few minute to calcaulte
Image
Pre-slew 15.0-350.0 keV image (Event data)

#   RAcent    DECcent   POSerr    Theta     Phi              Peak Cts       SNR   Name
   16.5535   -47.7114   0.0136    25.1025   -17.1819         0.8424297     14.143 TRIG_01161127

Foreground time interval of the image:
 -3.072  11.320 (delta_t =  14.392 [sec])
Background time interval of the image:
-239.864  -3.072 (delta_t = 236.792 [sec])
Lightcurves
Notes:
- 1) The mask-weighted light curves are using the flight position.
- 2) Multiple plots of different time binning/intervals are shown to cover all scenarios of short/long GRBs, rate/image triggers, and real/false positives.
- 3) For all the mask-weighted lightcurves, the y-axis units are counts/sec/det where a det is 0.4 x 0.4 = 0.16 sq cm.
- 4) The verticle lines correspond to following: green dotted lines are T50 interval, black dotted lines are T90 interval, blue solid line(s) is a spacecraft slew start time, and orange solid line(s) is a spacecraft slew end time.
- 5) Time of each bin is in the middle of the bin.
1 s binning
From T0-310 s to T0+310 s

From T100_start - 20 s to T100_end + 30 s

Full time interval

64 ms binning
Full time interval

From T100_start to T100_end

From T0-5 sec to T0+5 sec

16 ms binning
From T100_start-5 s to T100_start+5 s

Blue+Cyan dotted lines: Time interval of the scaled map
From 0.000000 to 1.024000
8 ms binning
From T100_start-3 s to T100_start+3 s

Blue+Cyan dotted lines: Time interval of the scaled map
From 0.000000 to 1.024000
2 ms binning
From T100_start-1 s to T100_start+1 s

Blue+Cyan dotted lines: Time interval of the scaled map
From 0.000000 to 1.024000
SN=5 or 10 sec. binning (whichever binning is satisfied first)

SN=5 or 10 sec. binning (T < 200 sec)

Quad-rate summed light curves (from T0-300s to T0+1000s)

Spectral Evolution

Spectra
Notes:
- 1) The fitting includes the systematic errors.
- 2) When the burst includes telescope slew time periods, the fitting uses an average response file made from multiple 5-s response files through out the slew time plus single time preiod for the non-slew times, and weighted by the total counts in the corresponding time period using addrmf. An average response file is needed becuase a spectral fit using the pre-slew DRM will introduce some errors in both a spectral shape and a normalization if the PHA file contains a lot of the slew/post-slew time interval.
- 3) For fits to more complicated models (e.g. a power-law over a cutoff power-law), the BAT team has decided to require a chi-square improvement of more than 6 for each extra dof.
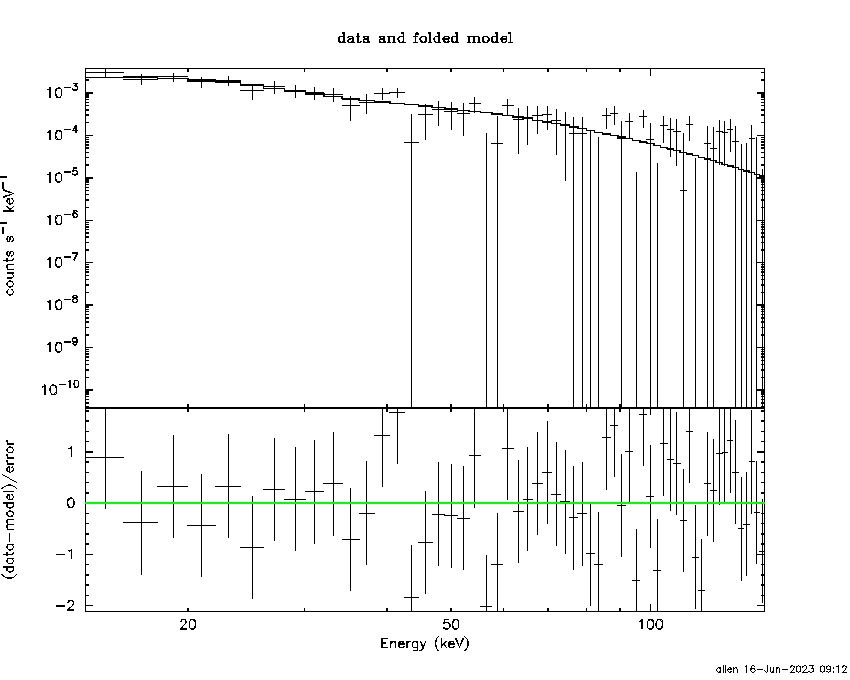
Time averaged spectrum fit using the average DRM
Power-law model

Time interval is from   -3.072 sec. to   11.320 sec.

Spectral model in power-law:
------------------------------------------------------------
Parameters  : value       lower 90%   higher 90%
Photon index: 2.10335     ( -0.251012   0.272778 )
Norm@50keV  : 2.82832E-03    ( -0.000495423   0.000475503 )
------------------------------------------------------------
#Fit statistic  : Chi-Squared                   49.32     using 59 bins.
 Reduced chi-squared = 0.865263
# Null hypothesis probability of 7.55e-01 with 57 degrees of freedom

Photon flux (15-150 keV)    in 14.39 sec: 0.445744 ( -0.054118  0.054129 ) ph/cm2/s
Energy fluence (15-150 keV)             : 3.7833e-07 ( -5.75256e-08  5.92429e-08 ) ergs/cm2
Cutoff power-law model

Time interval is from   -3.072 sec. to   11.320 sec.
Spectral model in the cutoff power-law:
------------------------------------------------------------
Parameters  : value       lower 90%   higher 90%
Photon index: 2.22170     ( -0.512639   0.0260408 )
Epeak [keV] : 94.7499      (   )
Norm@50keV  : 2.35289E-03    (     )
------------------------------------------------------------
#Fit statistic  : Chi-Squared                   48.76     using 59 bins.
 Reduced chi-squared = 0.870714
# Null hypothesis probability of 7.43e-01 with 56 degrees of freedom

Photon flux (15-150 keV)    in 14.39 sec: 0.392704 ( -0.11046  0.097471 ) ph/cm2/s
Energy fluence (15-150 keV)             : 3.8295e-07 ( -6.19454e-08  6.39818e-08 ) ergs/cm2
Band function

Time interval is from   -3.072 sec. to   11.320 sec.


Spectral model in the Band function:
------------------------------------------------------------
Parameters  : value       lower 90%   higher 90%
alpha       :    (     )
beta        :     (     )
Epeak [keV] :       (   )
Norm@50keV   :     (     )
------------------------------------------------------------

Photon flux (15-150 keV)    in  sec:  (    ) ph/cm2/s
Energy fluence (15-150 keV)             : 0 ( 0  0 ) ergs/cm2
Single BB

Spectral model blackbody:
------------------------------------------------------------
Parameters  : value    Lower 90%  Upper 90%
kT [keV]    : 8.44933  (-1.28353  1.54658)
R^2/D10^2   : 0.377296  (-0.181944   0.349717)
(R is the radius in km and D10 is the distance to the source in units of 10 kpc)
------------------------------------------------------------
#Fit statistic  : Chi-Squared                   71.98     using 59 bins.
 Reduced chi-squared =
# Null hypothesis probability of 8.74e-02 with 57 degrees of freedom

Energy  Fluence     90% Error
[keV]   [erg/cm2]   [erg/cm2]
15- 25  7.277e-08   1.531e-08
25- 50  1.397e-07   2.748e-08
50-150  4.378e-08   1.651e-08
15-150  2.563e-07   4.605e-08
Thermal bremsstrahlung (OTTB)

Spectral model: thermal bremsstrahlung
------------------------------------------------------------
Parameters  : value         Lower 90%    Upper 90%
kT [keV]    : 58.0613       (-19.6805      37.1719)
Norm        : 2.33061       (-0.489128     0.655323)
------------------------------------------------------------
#Fit statistic  : Chi-Squared                   53.37     using 59 bins.
 Reduced chi-squared =
# Null hypothesis probability of 6.12e-01 with 57 degrees of freedom

Energy  Fluence     90% Error
[keV]   [erg/cm2]   [erg/cm2]
15- 25  8.382e-08   1.276e-08
25- 50  1.263e-07   1.883e-08
50-150  1.398e-07   5.057e-08
15-150  3.499e-07   6.404e-08
Double BB

Spectral model: bbodyrad<1> + bbodyrad<2>
------------------------------------------------------------
Parameters  : value         Lower 90%    Upper 90%
kT1 [keV]   : 5.81375        (-1.66628      1.59072)
R1^2/D10^2  : 1.39657        (-0.842044      1.65839)
kT2 [keV]   : 29.0863        (-12.4984      52.0038)
R2^2/D10^2  : 2.69270E-03    (-0.0024913   0.0177987)
------------------------------------------------------------
#Fit statistic  : Chi-Squared                   50.54     using 59 bins.
 Reduced chi-squared =
# Null hypothesis probability of 6.46e-01 with 55 degrees of freedom

Energy  Fluence     90% Error
[keV]   [erg/cm2]   [erg/cm2]
15- 25  9.136e-08   3.870e-08
25- 50  1.120e-07   3.949e-08
50-150  1.988e-07   1.149e-07
15-150  4.021e-07   1.703e-07
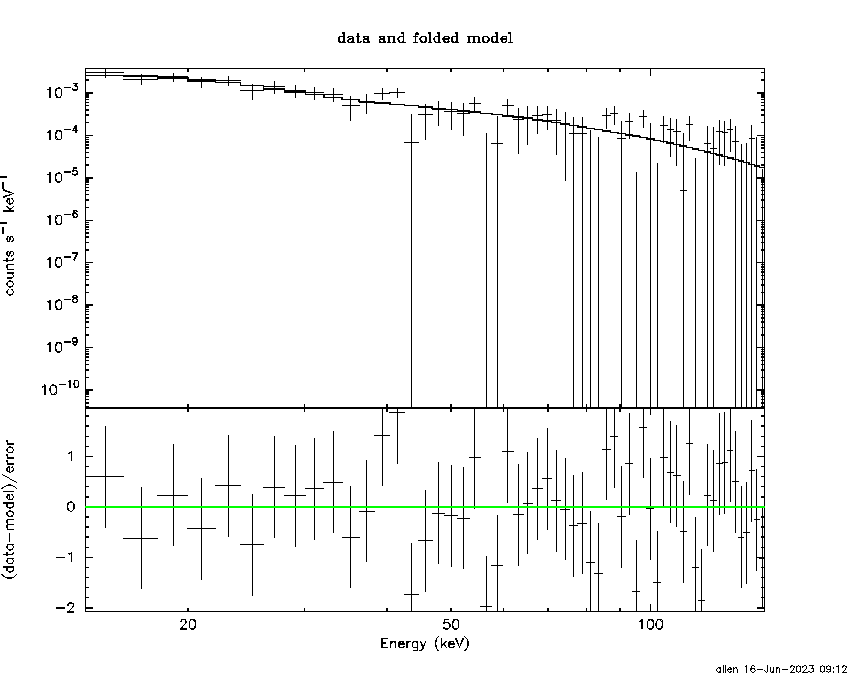
Peak spectrum fit
Power-law model

Time interval is from    0.020 sec. to    1.020 sec.

Spectral model in power-law:
------------------------------------------------------------
Parameters  : value       lower 90%   higher 90%
Photon index: 2.14401     ( -0.339978   0.388553 )
Norm@50keV  : 6.63864E-03    ( -0.00179891   0.00174122 )
------------------------------------------------------------
#Fit statistic  : Chi-Squared                   73.46     using 59 bins.
 Reduced chi-squared = 1.28877
# Null hypothesis probability of 7.01e-02 with 57 degrees of freedom

Photon flux (15-150 keV)    in 1 sec: 1.06780 ( -0.208043  0.20804 ) ph/cm2/s
Energy fluence (15-150 keV)             : 6.19812e-08 ( -1.45461e-08  1.51464e-08 ) ergs/cm2
Cutoff power-law model

Time interval is from    0.020 sec. to    1.020 sec.
Spectral model in the cutoff power-law:
------------------------------------------------------------
Parameters  : value       lower 90%   higher 90%
Photon index: 0.457600     ( -2.24824   1.54763 )
Epeak [keV] : 36.7594      ( -32.4586 16.3248 )
Norm@50keV  : 6.58539E-02    ( -0.0658794   1.31726 )
------------------------------------------------------------
#Fit statistic  : Chi-Squared                   70.38     using 59 bins.
 Reduced chi-squared = 1.25679
# Null hypothesis probability of 9.36e-02 with 56 degrees of freedom

Photon flux (15-150 keV)    in 1 sec: 1.03042 ( -0.208087  0.20947 ) ph/cm2/s
Energy fluence (15-150 keV)             : 5.57905e-08 ( -1.30066e-08  1.52474e-08 ) ergs/cm2
Band function

Time interval is from    0.020 sec. to    1.020 sec.


Spectral model in the Band function:
------------------------------------------------------------
Parameters  : value       lower 90%   higher 90%
alpha       :    (     )
beta        :     (     )
Epeak [keV] :       (   )
Norm@50keV   :     (     )
------------------------------------------------------------

Photon flux (15-150 keV)    in  sec:  (    ) ph/cm2/s
Energy fluence (15-150 keV)             : 0 ( 0  0 ) ergs/cm2
Single BB

Spectral model blackbody:
------------------------------------------------------------
Parameters  : value    Lower 90%  Upper 90%
kT [keV]    : 9.88548  (-1.85853  2.12843)
R^2/D10^2   : 0.544995  (-0.290709   0.661963)
(R is the radius in km and D10 is the distance to the source in units of 10 kpc)
------------------------------------------------------------
#Fit statistic  : Chi-Squared                   72.58     using 59 bins.
 Reduced chi-squared =
# Null hypothesis probability of 8.00e-02 with 57 degrees of freedom

Energy  Fluence     90% Error
[keV]   [erg/cm2]   [erg/cm2]
15- 25  1.080e-08   3.722e-09
25- 50  2.642e-08   1.000e-08
50-150  1.334e-08   6.722e-09
15-150  5.056e-08   1.644e-08
Thermal bremsstrahlung (OTTB)

Spectral model: thermal bremsstrahlung
------------------------------------------------------------
Parameters  : value         Lower 90%    Upper 90%
kT [keV]    : 50.9835       (-19.2916      40.1648)
Norm        : 6.11119       (-1.67773     2.44436)
------------------------------------------------------------
#Fit statistic  : Chi-Squared                   71.05     using 59 bins.
 Reduced chi-squared =
# Null hypothesis probability of 9.99e-02 with 57 degrees of freedom

Energy  Fluence     90% Error
[keV]   [erg/cm2]   [erg/cm2]
15- 25  1.501e-08   3.903e-09
25- 50  2.170e-08   6.375e-09
50-150  2.146e-08   1.168e-08
15-150  5.817e-08   1.762e-08
Double BB

Spectral model: bbodyrad<1> + bbodyrad<2>
------------------------------------------------------------
Parameters  : value         Lower 90%    Upper 90%
kT1 [keV]   : 0.230837        (-0.351128      1.84256)
R1^2/D10^2  : 5.81763E+22        (-6.62217e+22      -6.62359e+22)
kT2 [keV]   : 10.3486        (-1.8978      2.22987)
R2^2/D10^2  : 0.444633    (-0.237614   0.520137)
------------------------------------------------------------
#Fit statistic  : Chi-Squared                   67.91     using 59 bins.
 Reduced chi-squared =
# Null hypothesis probability of 1.13e-01 with 55 degrees of freedom

Energy  Fluence     90% Error
[keV]   [erg/cm2]   [erg/cm2]
15- 25  1.426e-08   7.200e-09
25- 50  2.305e-08   1.278e-08
50-150  1.794e-08   1.187e-08
15-150  5.525e-08   2.947e-08
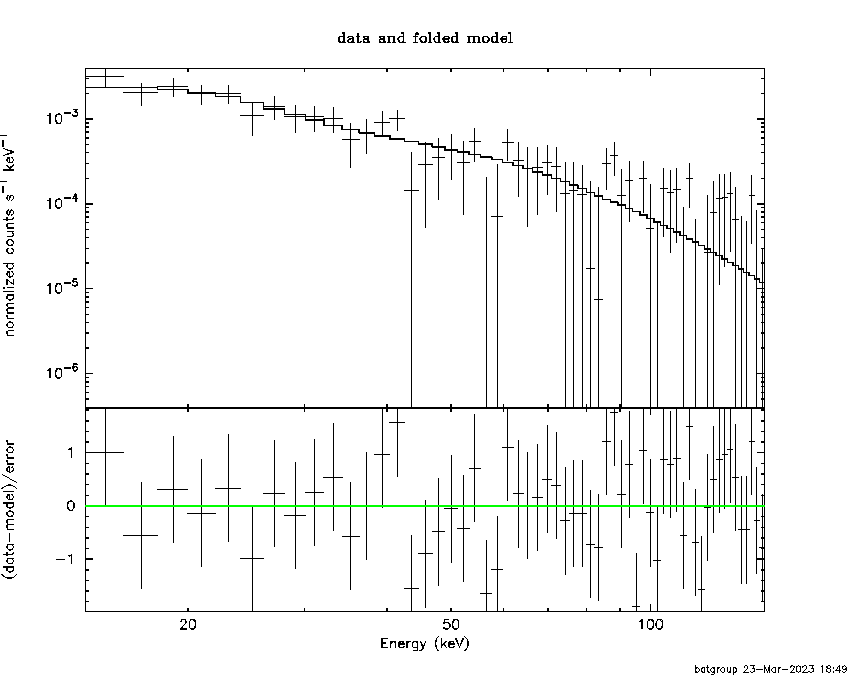
Pre-slew spectrum (Pre-slew PHA with pre-slew DRM)
Power-law model
Spectral model in power-law:
------------------------------------------------------------
Parameters  : value       lower 90%   higher 90%
Photon index: 2.10335     ( -0.251012   0.272778 )
Norm@50keV  : 2.82832E-03    ( -0.000495423   0.000475503 )
------------------------------------------------------------
#Fit statistic  : Chi-Squared                   49.32     using 59 bins.
 Reduced chi-squared =
# Null hypothesis probability of 7.55e-01 with 57 degrees of freedom

Photon flux (15-150 keV)    in 14.39 sec: 0.445705 ( -0.0541127  0.0541241 ) ph/cm2/s
Energy fluence (15-150 keV)             : 3.78258e-07 ( -5.75157e-08  5.92441e-08 ) ergs/cm2
Cutoff power-law model
Spectral model in the cutoff power-law:
------------------------------------------------------------
Parameters  : value       lower 90%   higher 90%
Photon index: 2.49882     ( -0.749111   0.238376 )
Epeak [keV] : 180.594      (   )
Norm@50keV  : 1.78319E-03    (     )
------------------------------------------------------------
#Fit statistic  : Chi-Squared                   48.11     using 59 bins.
 Reduced chi-squared =
# Null hypothesis probability of 7.64e-01 with 56 degrees of freedom

Photon flux (15-150 keV)    in 14.39 sec: 0.445796 (    ) ph/cm2/s
Energy fluence (15-150 keV)             : 3.77468e-07 ( -5.68707e-08  5.9989e-08 ) ergs/cm2
Band function
Spectral model in the Band function:
------------------------------------------------------------
Parameters  : value       lower 90%   higher 90%
alpha       :    (     )
beta        :     (     )
Epeak [keV] :       (   )
Norm@50keV   :     (     )
------------------------------------------------------------

Photon flux (15-150 keV)    in  sec:  (    ) ph/cm2/s
Energy fluence (15-150 keV)             : 0 ( 0  0 ) ergs/cm2
S(25-50 keV) vs. S(50-100 keV) plot

S(25-50 keV)  = 1.17e-07
S(50-100 keV) = 1.09e-07
T90 vs. Hardness ratio plot

T90                                   = 11.7999999523163 sec.
Hardness ratio (energy fluence ratio) = 0.931624
Color vs. Color plot

Count Ratio  (25-50 keV) / (15-25 keV) = 0.890497
Count Ratio (50-100 keV) / (15-25 keV) = 0.440829
Mask shadow pattern

IMX = 4.475793670390039E-01, IMY = 1.383939603464624E-01
TIME vs. PHA plot around the trigger time

Blue+Cyan dotted lines: Time interval of the scaled map
From 0.000000 to 1.024000
TIME vs. DetID plot around the trigger time

Blue+Cyan dotted lines: Time interval of the scaled map
From 0.000000 to 1.024000
100 us light curve (15-350 keV)

Blue+Cyan dotted lines: Time interval of the scaled map
From 0.000000 to 1.024000
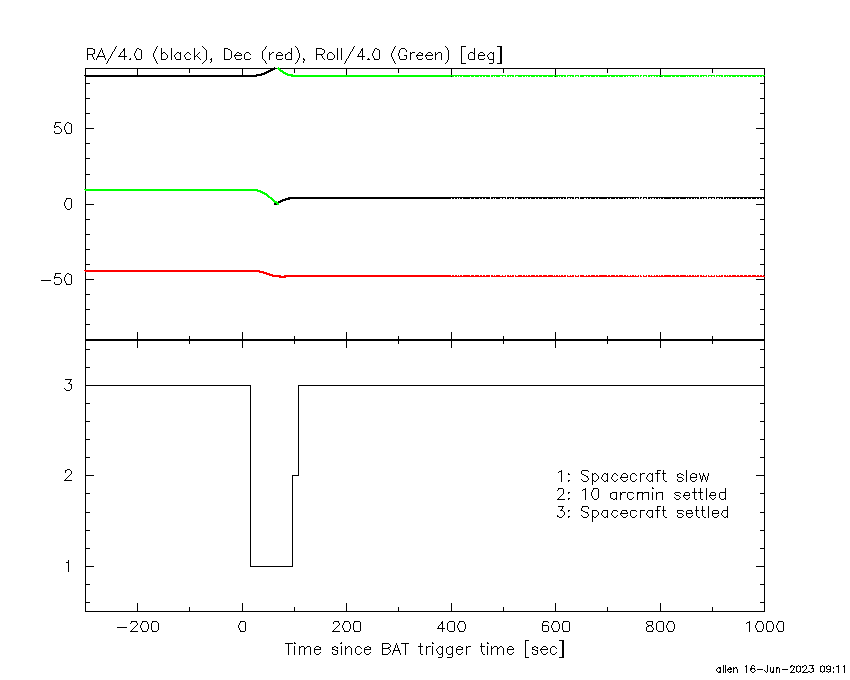
Spacecraft aspect plot
Bright source in the pre-burst/pre-slew/post-slew images
Pre-burst image of 15-350 keV band
Time interval of the image:
-239.864000 -3.072000

# RAcent  DECcent POSerr Theta    Phi  PeakCts   SNR AngSep     Name
#  [deg]    [deg]    ['] [deg]  [deg]                   [']
285.0974 -24.8729    6.0  48.5  146.1   4.4416   1.9    4.4	HT1900.1-2455
297.5562 -65.3667    2.2  31.6   84.6   3.3533   5.3 ------	UNKNOWN
352.8010  -5.6289    3.4  40.0 -109.0   3.9520   3.4  547.8	UNKNOWN
Pre-slew background subtracted image of 15-350 keV band
Time interval of the image:
-3.072000 11.320000

# RAcent  DECcent POSerr Theta    Phi  PeakCts   SNR AngSep     Name
#  [deg]    [deg]    ['] [deg]  [deg]                   [']
284.9192 -25.0299    3.7  48.5  145.8   0.7853   3.1    9.1	HT1900.1-2455
 16.5535 -47.7115    0.8  25.1  -17.2   0.8425  14.2 ------	UNKNOWN
Post-slew image of 15-350 keV band
Time interval of the image:
96.036590 962.270700

# RAcent  DECcent POSerr Theta    Phi  PeakCts   SNR AngSep     Name
#  [deg]    [deg]    ['] [deg]  [deg]                   [']
 61.5099 -71.7626    2.6  31.6   84.6   9.2889   4.4 ------	UNKNOWN
 54.7385  -5.6128    3.6  53.2  -20.3  10.0316   3.2 ------	UNKNOWN
Plot creation:
Fri Jun 16 09:12:25 EDT 2023