Estimated redshift from machine learning (Ukwatta et al. 2016) - may take a few minute to calcaulte
Image
Pre-slew 15.0-350.0 keV image (Event data)
#   RAcent    DECcent   POSerr    Theta     Phi              Peak Cts       SNR   Name
  122.6176   -21.9010   0.0211     4.9926   -62.4655         0.7312292      9.145 TRIG_01165354

Foreground time interval of the image:
 -2.252  24.492 (delta_t =  26.744 [sec])
Background time interval of the image:
-239.624  -2.252 (delta_t = 237.372 [sec])
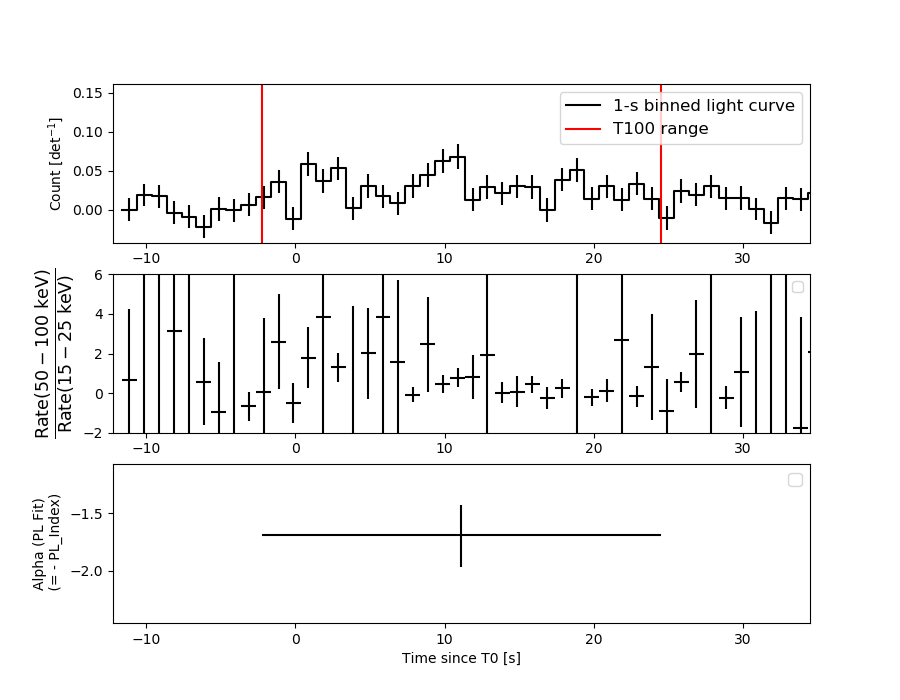
Lightcurves
Notes:
- 1) The mask-weighted light curves are using the flight position.
- 2) Multiple plots of different time binning/intervals are shown to cover all scenarios of short/long GRBs, rate/image triggers, and real/false positives.
- 3) For all the mask-weighted lightcurves, the y-axis units are counts/sec/det where a det is 0.4 x 0.4 = 0.16 sq cm.
- 4) The verticle lines correspond to following: green dotted lines are T50 interval, black dotted lines are T90 interval, blue solid line(s) is a spacecraft slew start time, and orange solid line(s) is a spacecraft slew end time.
- 5) Time of each bin is in the middle of the bin.
1 s binning
From T0-310 s to T0+310 s

From T100_start - 20 s to T100_end + 30 s
Full time interval
64 ms binning
Full time interval
From T100_start to T100_end
From T0-5 sec to T0+5 sec
16 ms binning
From T100_start-5 s to T100_start+5 s
8 ms binning
From T100_start-3 s to T100_start+3 s
2 ms binning
From T100_start-1 s to T100_start+1 s
SN=5 or 10 sec. binning (whichever binning is satisfied first)
SN=5 or 10 sec. binning (T < 200 sec)
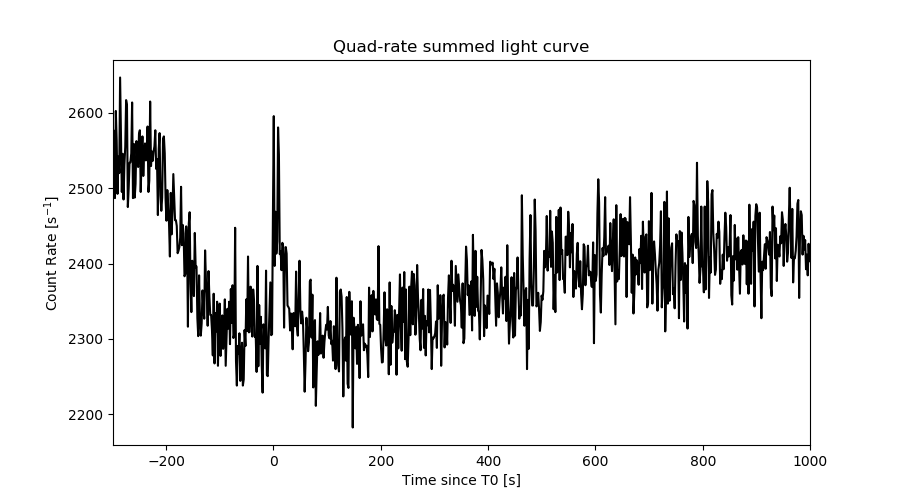
Quad-rate summed light curves (from T0-300s to T0+1000s)
Spectral Evolution
Spectra
Notes:
- 1) The fitting includes the systematic errors.
- 2) When the burst includes telescope slew time periods, the fitting uses an average response file made from multiple 5-s response files through out the slew time plus single time preiod for the non-slew times, and weighted by the total counts in the corresponding time period using addrmf. An average response file is needed becuase a spectral fit using the pre-slew DRM will introduce some errors in both a spectral shape and a normalization if the PHA file contains a lot of the slew/post-slew time interval.
- 3) For fits to more complicated models (e.g. a power-law over a cutoff power-law), the BAT team has decided to require a chi-square improvement of more than 6 for each extra dof.
Time averaged spectrum fit using the average DRM
Power-law model

Time interval is from   -2.252 sec. to   24.492 sec.

Spectral model in power-law:
------------------------------------------------------------
Parameters  : value       lower 90%   higher 90%
Photon index: 1.69125     ( -0.260047   0.27396 )
Norm@50keV  : 1.86039E-03    ( -0.000318406   0.000310013 )
------------------------------------------------------------
#Fit statistic  : Chi-Squared                   43.53     using 59 bins.
 Reduced chi-squared = 0.763684
# Null hypothesis probability of 9.05e-01 with 57 degrees of freedom

Photon flux (15-150 keV)    in 26.74 sec: 0.246340 ( -0.036356  0.036363 ) ph/cm2/s
Energy fluence (15-150 keV)             : 4.6099e-07 ( -8.18656e-08  8.39663e-08 ) ergs/cm2
Cutoff power-law model
Time interval is from   -2.252 sec. to   24.492 sec.
Spectral model in the cutoff power-law:
------------------------------------------------------------
Parameters  : value       lower 90%   higher 90%
Photon index: 1.25654     ( -1.29018   0.761451 )
Epeak [keV] : 76.7188      ( -54.4419 -76.7188 )
Norm@50keV  : 3.23539E-03    ( -0.00323539   0.0137951 )
------------------------------------------------------------
#Fit statistic  : Chi-Squared                   43.01     using 59 bins.
 Reduced chi-squared = 0.768036
# Null hypothesis probability of 8.99e-01 with 56 degrees of freedom

Photon flux (15-150 keV)    in 26.74 sec: 0.242321 ( -0.037623  0.037526 ) ph/cm2/s
Energy fluence (15-150 keV)             : 4.41255e-07 ( -9.27966e-08  9.48513e-08 ) ergs/cm2
Band function

Time interval is from   -2.252 sec. to   24.492 sec.


Spectral model in the Band function:
------------------------------------------------------------
Parameters  : value       lower 90%   higher 90%
alpha       :    (     )
beta        :     (     )
Epeak [keV] :       (   )
Norm@50keV   :     (     )
------------------------------------------------------------

Photon flux (15-150 keV)    in  sec:  (    ) ph/cm2/s
Energy fluence (15-150 keV)             : 0 ( 0  0 ) ergs/cm2
Single BB

Spectral model blackbody:
------------------------------------------------------------
Parameters  : value    Lower 90%  Upper 90%
kT [keV]    : 11.5390  (-1.94576  2.47198)
R^2/D10^2   : 6.95278E-02  (-0.0352786   0.0669079)
(R is the radius in km and D10 is the distance to the source in units of 10 kpc)
------------------------------------------------------------
#Fit statistic  : Chi-Squared                   51.66     using 59 bins.
 Reduced chi-squared =
# Null hypothesis probability of 6.75e-01 with 57 degrees of freedom

Energy  Fluence     90% Error
[keV]   [erg/cm2]   [erg/cm2]
15- 25  5.213e-08   1.364e-08
25- 50  1.565e-07   3.560e-08
50-150  1.220e-07   4.040e-08
15-150  3.307e-07   7.387e-08
Thermal bremsstrahlung (OTTB)
Spectral model: thermal bremsstrahlung
------------------------------------------------------------
Parameters  : value         Lower 90%    Upper 90%
kT [keV]    : 122.150       (-54.1171      -123.017)
Norm        : 1.05263       (-0.179427     0.227803)
------------------------------------------------------------
#Fit statistic  : Chi-Squared                   43.01     using 59 bins.
 Reduced chi-squared =
# Null hypothesis probability of 9.15e-01 with 57 degrees of freedom

Energy  Fluence     90% Error
[keV]   [erg/cm2]   [erg/cm2]
15- 25  7.326e-08   2.776e-08
25- 50  1.315e-07   4.853e-08
50-150  2.367e-07   1.493e-07
15-150  4.414e-07   2.100e-07
Double BB
Spectral model: bbodyrad<1> + bbodyrad<2>
------------------------------------------------------------
Parameters  : value         Lower 90%    Upper 90%
kT1 [keV]   : 7.68030        (-2.92344      2.73533)
R1^2/D10^2  : 0.224679        (-0.140252      0.251555)
kT2 [keV]   : 28.4939        (-12.6573      117.237)
R2^2/D10^2  : 1.79348E-03    (-0.00171571   0.0156739)
------------------------------------------------------------
#Fit statistic  : Chi-Squared                   42.61     using 59 bins.
 Reduced chi-squared =
# Null hypothesis probability of 8.89e-01 with 55 degrees of freedom

Energy  Fluence     90% Error
[keV]   [erg/cm2]   [erg/cm2]
15- 25  6.835e-08   3.828e-08
25- 50  1.390e-07   7.351e-08
50-150  2.447e-07   1.411e-07
15-150  4.520e-07   2.296e-07
Peak spectrum fit
Power-law model
Time interval is from   10.624 sec. to   11.624 sec.

Spectral model in power-law:
------------------------------------------------------------
Parameters  : value       lower 90%   higher 90%
Photon index: 2.01489     ( -0.54831   0.697753 )
Norm@50keV  : 3.87879E-03    ( -0.00175077   0.0016511 )
------------------------------------------------------------
#Fit statistic  : Chi-Squared                   57.98     using 59 bins.
 Reduced chi-squared = 1.01719
# Null hypothesis probability of 4.39e-01 with 57 degrees of freedom

Photon flux (15-150 keV)    in 1 sec: 0.585885 ( -0.189457  0.189584 ) ph/cm2/s
Energy fluence (15-150 keV)             : 3.58088e-08 ( -1.41856e-08  1.53335e-08 ) ergs/cm2
Cutoff power-law model
Time interval is from   10.624 sec. to   11.624 sec.
Spectral model in the cutoff power-law:
------------------------------------------------------------
Parameters  : value       lower 90%   higher 90%
Photon index: -0.688297     ( 0.739872   2.96243 )
Epeak [keV] : 40.4502      ( -40.4248 -40.4248 )
Norm@50keV  : 0.145444    ( -0.174985   45727.6 )
------------------------------------------------------------
#Fit statistic  : Chi-Squared                   56.06     using 59 bins.
 Reduced chi-squared = 1.00107
# Null hypothesis probability of 4.73e-01 with 56 degrees of freedom

Photon flux (15-150 keV)    in 1 sec: 0.548718 ( -0.199061  0.19465 ) ph/cm2/s
Energy fluence (15-150 keV)             : 0 ( 0  0 ) ergs/cm2
Band function

Time interval is from   10.624 sec. to   11.624 sec.


Spectral model in the Band function:
------------------------------------------------------------
Parameters  : value       lower 90%   higher 90%
alpha       :    (     )
beta        :     (     )
Epeak [keV] :       (   )
Norm@50keV   :     (     )
------------------------------------------------------------

Photon flux (15-150 keV)    in  sec:  (    ) ph/cm2/s
Energy fluence (15-150 keV)             : 0 ( 0  0 ) ergs/cm2
Single BB
Spectral model blackbody:
------------------------------------------------------------
Parameters  : value    Lower 90%  Upper 90%
kT [keV]    : 10.3348  (-2.62634  3.42031)
R^2/D10^2   : 0.268651  (-0.268651   0.519702)
(R is the radius in km and D10 is the distance to the source in units of 10 kpc)
------------------------------------------------------------
#Fit statistic  : Chi-Squared                   55.95     using 59 bins.
 Reduced chi-squared =
# Null hypothesis probability of 5.14e-01 with 57 degrees of freedom

Energy  Fluence     90% Error
[keV]   [erg/cm2]   [erg/cm2]
15- 25  5.905e-09   3.587e-09
25- 50  1.537e-08   9.245e-09
50-150  8.817e-09   6.937e-09
15-150  3.009e-08   1.906e-08
Thermal bremsstrahlung (OTTB)

Spectral model: thermal bremsstrahlung
------------------------------------------------------------
Parameters  : value         Lower 90%    Upper 90%
kT [keV]    : 60.5133       (-33.5324      -60.4744)
Norm        : 3.13138       (-1.23846     2.0842)
------------------------------------------------------------
#Fit statistic  : Chi-Squared                   57.04     using 59 bins.
 Reduced chi-squared =
# Null hypothesis probability of 4.74e-01 with 57 degrees of freedom

Energy  Fluence     90% Error
[keV]   [erg/cm2]   [erg/cm2]
15- 25  7.881e-09   5.060e-09
25- 50  1.203e-08   7.608e-09
50-150  1.378e-08   1.128e-08
15-150  3.369e-08   2.183e-08
Double BB
Spectral model: bbodyrad<1> + bbodyrad<2>
------------------------------------------------------------
Parameters  : value         Lower 90%    Upper 90%
kT1 [keV]   : 1.05506        (-1.04464      2.49192)
R1^2/D10^2  : 2.30839E+05        (-290006      -290021)
kT2 [keV]   : 11.1043        (-2.83246      3.99772)
R2^2/D10^2  : 0.192942    (-0.136896   0.153029)
------------------------------------------------------------
#Fit statistic  : Chi-Squared                   52.94     using 59 bins.
 Reduced chi-squared =
# Null hypothesis probability of 5.54e-01 with 55 degrees of freedom

Energy  Fluence     90% Error
[keV]   [erg/cm2]   [erg/cm2]
15- 25  6.126e-09   3.323e-09
25- 50  1.425e-08   8.915e-09
50-150  9.999e-09   7.125e-09
15-150  3.038e-08   1.855e-08
Pre-slew spectrum (Pre-slew PHA with pre-slew DRM)
Power-law model
Spectral model in power-law:
------------------------------------------------------------
Parameters  : value       lower 90%   higher 90%
Photon index: 1.69125     ( -0.260047   0.27396 )
Norm@50keV  : 1.86039E-03    ( -0.000318406   0.000310013 )
------------------------------------------------------------
#Fit statistic  : Chi-Squared                   43.53     using 59 bins.
 Reduced chi-squared =
# Null hypothesis probability of 9.05e-01 with 57 degrees of freedom

Photon flux (15-150 keV)    in 26.74 sec: 0.246330 ( -0.0363541  0.0363605 ) ph/cm2/s
Energy fluence (15-150 keV)             : 4.6092e-07 ( -8.18263e-08  8.39935e-08 ) ergs/cm2
Cutoff power-law model

Spectral model in the cutoff power-law:
------------------------------------------------------------
Parameters  : value       lower 90%   higher 90%
Photon index: 1.25654     ( -1.29018   0.761454 )
Epeak [keV] : 76.7186      ( -59.8645 -76.7188 )
Norm@50keV  : 3.23539E-03    ( -0.00323539   0.0137951 )
------------------------------------------------------------
#Fit statistic  : Chi-Squared                   43.01     using 59 bins.
 Reduced chi-squared =
# Null hypothesis probability of 8.99e-01 with 56 degrees of freedom

Photon flux (15-150 keV)    in 26.74 sec: 0.242284 ( -0.037614  0.03693 ) ph/cm2/s
Energy fluence (15-150 keV)             : 4.41397e-07 ( -9.27958e-08  9.49618e-08 ) ergs/cm2
Band function

Spectral model in the Band function:
------------------------------------------------------------
Parameters  : value       lower 90%   higher 90%
alpha       :    (     )
beta        :     (     )
Epeak [keV] :       (   )
Norm@50keV   :     (     )
------------------------------------------------------------

Photon flux (15-150 keV)    in  sec:  (    ) ph/cm2/s
Energy fluence (15-150 keV)             : 0 ( 0  0 ) ergs/cm2
S(25-50 keV) vs. S(50-100 keV) plot
S(25-50 keV)  = 1.24e-07
S(50-100 keV) = 1.54e-07
T90 vs. Hardness ratio plot
T90                                   = 23.6039999723434 sec.
Hardness ratio (energy fluence ratio) = 1.24194
Color vs. Color plot
Count Ratio  (25-50 keV) / (15-25 keV) = 1.61504
Count Ratio (50-100 keV) / (15-25 keV) = 0.877064
Mask shadow pattern
IMX = 4.038392364169518E-02, IMY = 7.746302932783052E-02
TIME vs. PHA plot around the trigger time
TIME vs. DetID plot around the trigger time
100 us light curve (15-350 keV)
Spacecraft aspect plot
Bright source in the pre-burst/pre-slew/post-slew images
Pre-burst image of 15-350 keV band
Time interval of the image:
-239.624000 -2.252000

# RAcent  DECcent POSerr Theta    Phi  PeakCts   SNR AngSep     Name
#  [deg]    [deg]    ['] [deg]  [deg]                   [']
135.4070 -40.5572    2.8  17.1  147.7   1.9949   4.1    5.5	Vela X-1
170.3692 -60.6447    9.1  46.3  142.4   2.8849   1.3    2.0	Cen X-3
161.6209 -23.3903    2.4  31.6   84.7   3.6284   4.7 ------	UNKNOWN
152.1359   7.9970    2.5  41.1   30.1   2.5551   4.6 ------	UNKNOWN
129.1225  -7.0557    3.4  18.1   -2.7   1.4507   3.4 ------	UNKNOWN
 85.0104 -21.4931    2.9  38.5 -103.5   5.7511   3.9 ------	UNKNOWN
Pre-slew background subtracted image of 15-350 keV band
Time interval of the image:
-2.252000 24.492000

# RAcent  DECcent POSerr Theta    Phi  PeakCts   SNR AngSep     Name
#  [deg]    [deg]    ['] [deg]  [deg]                   [']
135.5361 -40.7035    6.3  17.3  147.6  -0.1606  -1.8    8.9	Vela X-1
170.4839 -60.6453    4.0  46.4  142.3   0.8873   2.9    5.1	Cen X-3
142.7112  18.9957    2.2  46.6   11.0   0.8653   5.2 ------	UNKNOWN
135.8760  -2.2596    2.2  24.3   12.4   0.4567   5.2 ------	UNKNOWN
129.0046 -33.2827    2.3   8.5  158.1   0.4140   5.1 ------	UNKNOWN
122.6176 -21.9011    1.3   5.0  -62.5   0.7311   9.1 ------	UNKNOWN
112.3730  12.8078    2.9  40.4  -32.0   0.5808   4.0 ------	UNKNOWN
Post-slew image of 15-350 keV band
Time interval of the image:
84.076600 306.639000
307.376000 549.507900
550.376000 962.464300

# RAcent  DECcent POSerr Theta    Phi  PeakCts   SNR AngSep     Name
#  [deg]    [deg]    ['] [deg]  [deg]                   [']
135.4393 -40.5494    2.7  21.6  141.7   6.7782   4.2    4.1	Vela X-1
156.7231 -21.4300    2.7  31.6   84.6  11.1352   4.3 ------	UNKNOWN
141.5280  24.8094    2.3  50.2   11.5   9.2425   5.1 ------	UNKNOWN
Plot creation:
Fri Jun 16 09:08:07 EDT 2023