Estimated redshift from machine learning (Ukwatta et al. 2016) - may take a few minute to calcaulte
Image
Pre-slew 15.0-350.0 keV image (Event data)

#   RAcent    DECcent   POSerr    Theta     Phi              Peak Cts       SNR   Name
  326.9859    44.5141   0.0083    16.6532   -87.6777         2.1131267     23.010 TRIG_01167266

Foreground time interval of the image:
  0.024  14.749 (delta_t =  14.725 [sec])
Background time interval of the image:
-239.952   0.024 (delta_t = 239.976 [sec])
Lightcurves
Notes:
- 1) The mask-weighted light curves are using the flight position.
- 2) Multiple plots of different time binning/intervals are shown to cover all scenarios of short/long GRBs, rate/image triggers, and real/false positives.
- 3) For all the mask-weighted lightcurves, the y-axis units are counts/sec/det where a det is 0.4 x 0.4 = 0.16 sq cm.
- 4) The verticle lines correspond to following: green dotted lines are T50 interval, black dotted lines are T90 interval, blue solid line(s) is a spacecraft slew start time, and orange solid line(s) is a spacecraft slew end time.
- 5) Time of each bin is in the middle of the bin.
1 s binning
From T0-310 s to T0+310 s

From T100_start - 20 s to T100_end + 30 s

Full time interval

64 ms binning
Full time interval

From T100_start to T100_end

From T0-5 sec to T0+5 sec

16 ms binning
From T100_start-5 s to T100_start+5 s

8 ms binning
From T100_start-3 s to T100_start+3 s

2 ms binning
From T100_start-1 s to T100_start+1 s

SN=5 or 10 sec. binning (whichever binning is satisfied first)

SN=5 or 10 sec. binning (T < 200 sec)
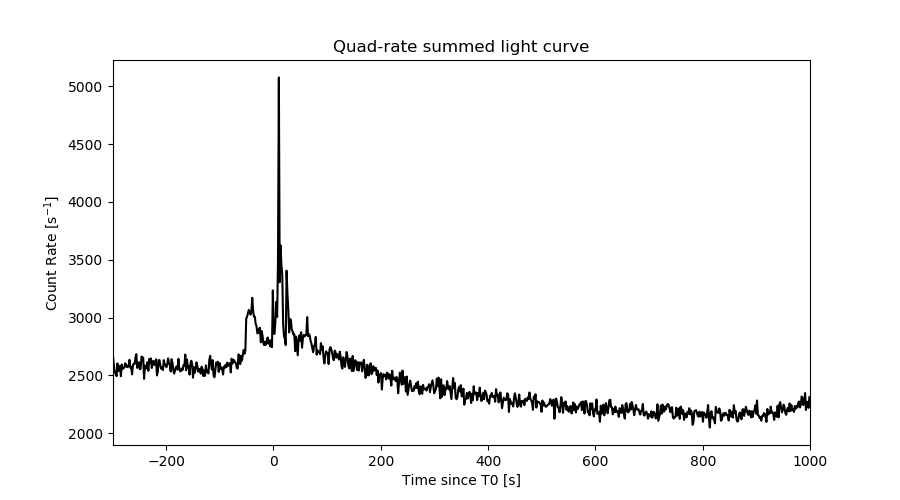
Quad-rate summed light curves (from T0-300s to T0+1000s)
Spectral Evolution

Spectra
Notes:
- 1) The fitting includes the systematic errors.
- 2) When the burst includes telescope slew time periods, the fitting uses an average response file made from multiple 5-s response files through out the slew time plus single time preiod for the non-slew times, and weighted by the total counts in the corresponding time period using addrmf. An average response file is needed becuase a spectral fit using the pre-slew DRM will introduce some errors in both a spectral shape and a normalization if the PHA file contains a lot of the slew/post-slew time interval.
- 3) For fits to more complicated models (e.g. a power-law over a cutoff power-law), the BAT team has decided to require a chi-square improvement of more than 6 for each extra dof.
Time averaged spectrum fit using the average DRM
Power-law model

Time interval is from    0.024 sec. to   76.296 sec.

Spectral model in power-law:
------------------------------------------------------------
Parameters  : value       lower 90%   higher 90%
Photon index: 1.41004     ( -0.112865   0.11228 )
Norm@50keV  : 3.95849E-03    ( -0.000236793   0.000236557 )
------------------------------------------------------------
#Fit statistic  : Chi-Squared                   39.43     using 59 bins.
 Reduced chi-squared = 0.691754
# Null hypothesis probability of 9.63e-01 with 57 degrees of freedom

Photon flux (15-150 keV)    in 76.27 sec: 0.483189 ( -0.030355  0.030507 ) ph/cm2/s
Energy fluence (15-150 keV)             : 2.91174e-06 ( -1.90775e-07  1.91841e-07 ) ergs/cm2
Cutoff power-law model

Time interval is from    0.024 sec. to   76.296 sec.
Spectral model in the cutoff power-law:
------------------------------------------------------------
Parameters  : value       lower 90%   higher 90%
Photon index: 1.41050     ( -0.200775   0.109761 )
Epeak [keV] : 9999.36      ( -9999.36 -9999.36 )
Norm@50keV  : 3.96641E-03    ( -0.000236863   0.00127824 )
------------------------------------------------------------
#Fit statistic  : Chi-Squared                   39.46     using 59 bins.
 Reduced chi-squared = 0.704643
# Null hypothesis probability of 9.54e-01 with 56 degrees of freedom

Photon flux (15-150 keV)    in 76.27 sec: 0.485381 ( -0.032675  0.028199 ) ph/cm2/s
Energy fluence (15-150 keV)             : 2.92465e-06 ( -2.50943e-07  2.25156e-07 ) ergs/cm2
Band function

Time interval is from    0.024 sec. to   76.296 sec.


Spectral model in the Band function:
------------------------------------------------------------
Parameters  : value       lower 90%   higher 90%
alpha       :    (     )
beta        :     (     )
Epeak [keV] :       (   )
Norm@50keV   :     (     )
------------------------------------------------------------

Photon flux (15-150 keV)    in  sec:  (    ) ph/cm2/s
Energy fluence (15-150 keV)             : 0 ( 0  0 ) ergs/cm2
Single BB

Spectral model blackbody:
------------------------------------------------------------
Parameters  : value    Lower 90%  Upper 90%
kT [keV]    : 16.7338  (  )
R^2/D10^2   : 3.65821E-02  (   )
(R is the radius in km and D10 is the distance to the source in units of 10 kpc)
------------------------------------------------------------
#Fit statistic  : Chi-Squared                  121.34     using 59 bins.
 Reduced chi-squared =
# Null hypothesis probability of 1.50e-06 with 57 degrees of freedom

Energy  Fluence     90% Error
[keV]   [erg/cm2]   [erg/cm2]
15- 25  1.598e-07   1.880e-08
25- 50  6.981e-07   5.991e-08
50-150  1.388e-06   1.537e-07
15-150  2.246e-06   1.747e-07
Thermal bremsstrahlung (OTTB)

Spectral model: thermal bremsstrahlung
------------------------------------------------------------
Parameters  : value         Lower 90%    Upper 90%
kT [keV]    : 200.000       (-21.5273      -200)
Norm        : 1.99662       (-0.119523     0.119523)
------------------------------------------------------------
#Fit statistic  : Chi-Squared                   47.74     using 59 bins.
 Reduced chi-squared =
# Null hypothesis probability of 8.04e-01 with 57 degrees of freedom

Energy  Fluence     90% Error
[keV]   [erg/cm2]   [erg/cm2]
15- 25  3.793e-07   2.746e-08
25- 50  7.296e-07   5.312e-08
50-150  1.600e-06   3.150e-07
15-150  2.709e-06   4.248e-07
Double BB

Spectral model: bbodyrad<1> + bbodyrad<2>
------------------------------------------------------------
Parameters  : value         Lower 90%    Upper 90%
kT1 [keV]   : 7.41807        (-1.46136      1.6327)
R1^2/D10^2  : 0.420879        (-0.202677      0.48986)
kT2 [keV]   : 33.3554        (-7.07716      14.2305)
R2^2/D10^2  : 3.06541E-03    (-0.00199319   0.00371712)
------------------------------------------------------------
#Fit statistic  : Chi-Squared                   42.38     using 59 bins.
 Reduced chi-squared =
# Null hypothesis probability of 8.94e-01 with 55 degrees of freedom

Energy  Fluence     90% Error
[keV]   [erg/cm2]   [erg/cm2]
15- 25  3.382e-07   7.738e-08
25- 50  7.033e-07   1.322e-07
50-150  1.923e-06   5.350e-07
15-150  2.964e-06   7.196e-07
Peak spectrum fit
Power-law model
Time interval is from   10.604 sec. to   11.604 sec.

Spectral model in power-law:
------------------------------------------------------------
Parameters  : value       lower 90%   higher 90%
Photon index: 1.27607     ( -0.139841   0.139969 )
Norm@50keV  : 3.89356E-02    ( -0.00322736   0.00321635 )
------------------------------------------------------------
#Fit statistic  : Chi-Squared                   47.76     using 59 bins.
 Reduced chi-squared = 0.837895
# Null hypothesis probability of 8.03e-01 with 57 degrees of freedom

Photon flux (15-150 keV)    in 1 sec: 4.62530 ( -0.38142  0.38161 ) ph/cm2/s
Energy fluence (15-150 keV)             : 3.87097e-07 ( -3.64582e-08  3.68289e-08 ) ergs/cm2
Cutoff power-law model
Time interval is from   10.604 sec. to   11.604 sec.
Spectral model in the cutoff power-law:
------------------------------------------------------------
Parameters  : value       lower 90%   higher 90%
Photon index: 0.789672     ( -0.647067   0.537227 )
Epeak [keV] : 126.449      ( -46.2396 -126.447 )
Norm@50keV  : 6.82252E-02    ( -0.0306082   0.0729005 )
------------------------------------------------------------
#Fit statistic  : Chi-Squared                   45.61     using 59 bins.
 Reduced chi-squared = 0.814464
# Null hypothesis probability of 8.38e-01 with 56 degrees of freedom

Photon flux (15-150 keV)    in 1 sec: 4.53750 ( -0.39706  0.39498 ) ph/cm2/s
Energy fluence (15-150 keV)             : 3.72538e-07 ( -4.09109e-08  4.07093e-08 ) ergs/cm2
Band function

Time interval is from   10.604 sec. to   11.604 sec.


Spectral model in the Band function:
------------------------------------------------------------
Parameters  : value       lower 90%   higher 90%
alpha       :    (     )
beta        :     (     )
Epeak [keV] :       (   )
Norm@50keV   :     (     )
------------------------------------------------------------

Photon flux (15-150 keV)    in  sec:  (    ) ph/cm2/s
Energy fluence (15-150 keV)             : 0 ( 0  0 ) ergs/cm2
Single BB
Spectral model blackbody:
------------------------------------------------------------
Parameters  : value    Lower 90%  Upper 90%
kT [keV]    : 16.5178  (-1.65999  1.90525)
R^2/D10^2   : 0.398173  (-0.122234   0.170655)
(R is the radius in km and D10 is the distance to the source in units of 10 kpc)
------------------------------------------------------------
#Fit statistic  : Chi-Squared                   68.25     using 59 bins.
 Reduced chi-squared =
# Null hypothesis probability of 1.46e-01 with 57 degrees of freedom

Energy  Fluence     90% Error
[keV]   [erg/cm2]   [erg/cm2]
15- 25  2.229e-08   3.535e-09
25- 50  9.636e-08   1.115e-08
50-150  1.859e-07   3.135e-08
15-150  3.046e-07   3.420e-08
Thermal bremsstrahlung (OTTB)

Spectral model: thermal bremsstrahlung
------------------------------------------------------------
Parameters  : value         Lower 90%    Upper 90%
kT [keV]    : 200.000       (-25.0946      -200)
Norm        : 18.9117       (-1.56043     1.56043)
------------------------------------------------------------
#Fit statistic  : Chi-Squared                   55.87     using 59 bins.
 Reduced chi-squared =
# Null hypothesis probability of 5.18e-01 with 57 degrees of freedom

Energy  Fluence     90% Error
[keV]   [erg/cm2]   [erg/cm2]
15- 25  4.708e-08   4.775e-09
25- 50  9.057e-08   1.330e-08
50-150  1.986e-07   9.054e-08
15-150  3.363e-07   1.073e-07
Double BB
Spectral model: bbodyrad<1> + bbodyrad<2>
------------------------------------------------------------
Parameters  : value         Lower 90%    Upper 90%
kT1 [keV]   : 8.49725        (-2.88224      3.5894)
R1^2/D10^2  : 2.12251        (-1.25626      5.22811)
kT2 [keV]   : 29.4361        (-8.24295      46.7016)
R2^2/D10^2  : 4.41179E-02    (-0.0411381   0.103912)
------------------------------------------------------------
#Fit statistic  : Chi-Squared                   46.13     using 59 bins.
 Reduced chi-squared =
# Null hypothesis probability of 7.97e-01 with 55 degrees of freedom

Energy  Fluence     90% Error
[keV]   [erg/cm2]   [erg/cm2]
15- 25  3.493e-08   1.457e-08
25- 50  9.300e-08   3.797e-08
50-150  2.461e-07   1.216e-07
15-150  3.740e-07   1.678e-07
Pre-slew spectrum (Pre-slew PHA with pre-slew DRM)
Power-law model
Spectral model in power-law:
------------------------------------------------------------
Parameters  : value       lower 90%   higher 90%
Photon index: 1.27911     ( -0.123314   0.122258 )
Norm@50keV  : 9.26906E-03    ( -0.000632028   0.000632026 )
------------------------------------------------------------
#Fit statistic  : Chi-Squared                   63.94     using 59 bins.
 Reduced chi-squared =
# Null hypothesis probability of 2.46e-01 with 57 degrees of freedom

Photon flux (15-150 keV)    in 14.72 sec: 1.10169 ( -0.0785812  0.0787797 ) ph/cm2/s
Energy fluence (15-150 keV)             : 1.35527e-06 ( -1.01271e-07  1.01817e-07 ) ergs/cm2
Cutoff power-law model

Spectral model in the cutoff power-law:
------------------------------------------------------------
Parameters  : value       lower 90%   higher 90%
Photon index: 0.894765     ( -0.546417   0.433839 )
Epeak [keV] : 155.172      ( -61.4172 -155.172 )
Norm@50keV  : 1.40438E-02    ( -0.00509446   0.0107908 )
------------------------------------------------------------
#Fit statistic  : Chi-Squared                   62.15     using 59 bins.
 Reduced chi-squared =
# Null hypothesis probability of 2.66e-01 with 56 degrees of freedom

Photon flux (15-150 keV)    in 14.72 sec: 1.07887 ( -0.082325  0.08374 ) ph/cm2/s
Energy fluence (15-150 keV)             : 1.32057e-06 ( -1.12121e-07  1.11513e-07 ) ergs/cm2
Band function

Spectral model in the Band function:
------------------------------------------------------------
Parameters  : value       lower 90%   higher 90%
alpha       :    (     )
beta        :     (     )
Epeak [keV] :       (   )
Norm@50keV   :     (     )
------------------------------------------------------------

Photon flux (15-150 keV)    in  sec:  (    ) ph/cm2/s
Energy fluence (15-150 keV)             : 0 ( 0  0 ) ergs/cm2
S(25-50 keV) vs. S(50-100 keV) plot
S(25-50 keV)  = 6.88e-07
S(50-100 keV) = 1.04e-06
T90 vs. Hardness ratio plot

T90                                   = 61.539999961853 sec.
Hardness ratio (energy fluence ratio) = 1.51163
Color vs. Color plot

Count Ratio  (25-50 keV) / (15-25 keV) = 1.41991
Count Ratio (50-100 keV) / (15-25 keV) = 1.08498
Mask shadow pattern

IMX = 1.212068208750919E-02, IMY = 2.988785134397000E-01
TIME vs. PHA plot around the trigger time

TIME vs. DetID plot around the trigger time

100 us light curve (15-350 keV)

Spacecraft aspect plot
Bright source in the pre-burst/pre-slew/post-slew images
Pre-burst image of 15-350 keV band
Time interval of the image:
-239.952000 0.024000

# RAcent  DECcent POSerr Theta    Phi  PeakCts   SNR AngSep     Name
#  [deg]    [deg]    ['] [deg]  [deg]                   [']
254.4371  35.3663   39.9  40.1  126.3  -0.5644  -0.3    1.8	Her X-1
288.8377  10.9396    9.3  32.4   57.4  -1.0890  -1.2    2.3	GRS 1915+105
299.5911  35.1774    1.3   6.5   72.6   4.7822   9.1    1.5	Cyg X-1
308.1298  41.0187    3.2   2.4  -95.5   1.8530   3.7    4.1	Cyg X-3
326.3499  38.2062    6.1  16.3  -65.3   1.2268   1.9   10.9	Cyg X-2
299.4221  31.0375    2.5  10.0   56.7   2.3356   4.6 ------	UNKNOWN
Pre-slew background subtracted image of 15-350 keV band
Time interval of the image:
0.024000 14.748600

# RAcent  DECcent POSerr Theta    Phi  PeakCts   SNR AngSep     Name
#  [deg]    [deg]    ['] [deg]  [deg]                   [']
254.5114  35.3919   35.0  40.0  126.3  -0.0632  -0.3    4.0	Her X-1
288.8190  10.8041    8.4  32.5   57.3   0.1605   1.4    8.6	GRS 1915+105
299.4056  35.1640   11.0   6.6   73.4   0.0813   1.1    9.3	Cyg X-1
307.8985  41.0451    4.8   2.3  -98.2   0.1807   2.4   11.1	Cyg X-3
326.0781  38.1546    4.2  16.1  -65.0   0.2453   2.7   11.0	Cyg X-2
326.9859  44.5141    0.5  16.7  -87.7   2.1132  23.0 ------	UNKNOWN
350.5887  58.5514    2.6  34.1 -112.7   0.7540   4.4 ------	UNKNOWN
Post-slew image of 15-350 keV band
Time interval of the image:
67.348600 962.200500

# RAcent  DECcent POSerr Theta    Phi  PeakCts   SNR AngSep     Name
#  [deg]    [deg]    ['] [deg]  [deg]                   [']
299.5943  35.2086    1.4  22.8   78.3  15.9787   8.2    0.5	Cyg X-1
308.1898  40.9253    3.6  14.2   84.8   5.9732   3.2    4.0	Cyg X-3
326.1363  38.2360    5.9   6.3    8.9  -3.3918  -2.0    5.4	Cyg X-2
288.7819  32.8946    2.6  31.6   84.6  12.9418   4.4 ------	UNKNOWN
320.4158  -9.5274    2.4  54.4   10.9  21.6330   4.9 ------	UNKNOWN
352.8039  -5.6319    3.3  55.3  -29.0  23.7850   3.6  547.7	UNKNOWN
357.6471   4.1314    3.5  48.5  -39.9  16.4013   3.3  285.2	UNKNOWN
Plot creation:
Fri Jun 16 09:06:45 EDT 2023