Estimated redshift from machine learning (Ukwatta et al. 2016) - may take a few minute to calcaulte
Image
Pre-slew 15.0-350.0 keV image (Event data)

#   RAcent    DECcent   POSerr    Theta     Phi              Peak Cts       SNR   Name
  134.3743    45.1299   0.0106    42.9200  -163.3342         3.1377838     18.098 TRIG_01167288

Foreground time interval of the image:
 -8.592  28.408 (delta_t =  37.000 [sec])
Background time interval of the image:
-239.592  -8.592 (delta_t = 231.000 [sec])
Lightcurves
Notes:
- 1) The mask-weighted light curves are using the flight position.
- 2) Multiple plots of different time binning/intervals are shown to cover all scenarios of short/long GRBs, rate/image triggers, and real/false positives.
- 3) For all the mask-weighted lightcurves, the y-axis units are counts/sec/det where a det is 0.4 x 0.4 = 0.16 sq cm.
- 4) The verticle lines correspond to following: green dotted lines are T50 interval, black dotted lines are T90 interval, blue solid line(s) is a spacecraft slew start time, and orange solid line(s) is a spacecraft slew end time.
- 5) Time of each bin is in the middle of the bin.
1 s binning
From T0-310 s to T0+310 s
From T100_start - 20 s to T100_end + 30 s
Full time interval
64 ms binning
Full time interval
From T100_start to T100_end
From T0-5 sec to T0+5 sec
16 ms binning
From T100_start-5 s to T100_start+5 s

Blue+Cyan dotted lines: Time interval of the scaled map
From 0.000000 to 1.024000
8 ms binning
From T100_start-3 s to T100_start+3 s
Blue+Cyan dotted lines: Time interval of the scaled map
From 0.000000 to 1.024000
2 ms binning
From T100_start-1 s to T100_start+1 s
Blue+Cyan dotted lines: Time interval of the scaled map
From 0.000000 to 1.024000
SN=5 or 10 sec. binning (whichever binning is satisfied first)

SN=5 or 10 sec. binning (T < 200 sec)
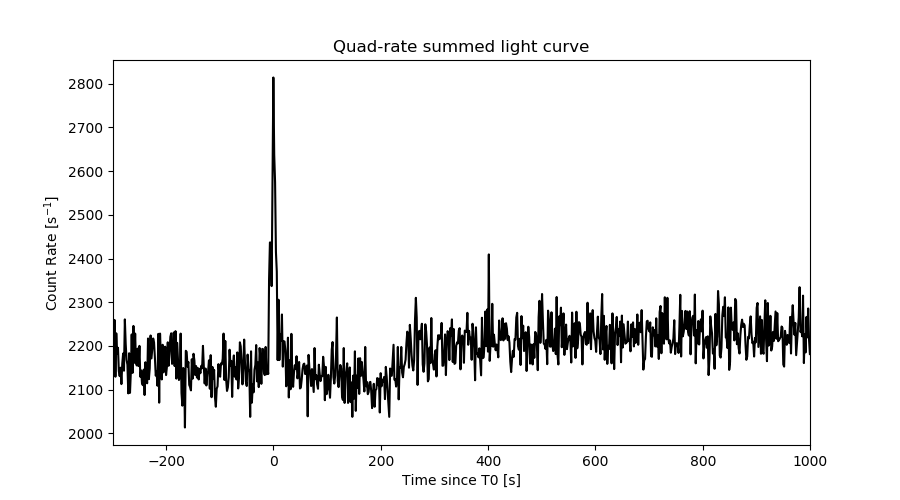
Quad-rate summed light curves (from T0-300s to T0+1000s)
Spectral Evolution

Spectra
Notes:
- 1) The fitting includes the systematic errors.
- 2) When the burst includes telescope slew time periods, the fitting uses an average response file made from multiple 5-s response files through out the slew time plus single time preiod for the non-slew times, and weighted by the total counts in the corresponding time period using addrmf. An average response file is needed becuase a spectral fit using the pre-slew DRM will introduce some errors in both a spectral shape and a normalization if the PHA file contains a lot of the slew/post-slew time interval.
- 3) For fits to more complicated models (e.g. a power-law over a cutoff power-law), the BAT team has decided to require a chi-square improvement of more than 6 for each extra dof.
Time averaged spectrum fit using the average DRM
Power-law model
Time interval is from   -8.592 sec. to   28.408 sec.

Spectral model in power-law:
------------------------------------------------------------
Parameters  : value       lower 90%   higher 90%
Photon index: 1.87835     ( -0.165757   0.171081 )
Norm@50keV  : 4.96279E-03    ( -0.00053255   0.000523641 )
------------------------------------------------------------
#Fit statistic  : Chi-Squared                   55.06     using 59 bins.
 Reduced chi-squared = 0.965965
# Null hypothesis probability of 5.48e-01 with 57 degrees of freedom

Photon flux (15-150 keV)    in 37 sec: 0.705798 ( -0.066568  0.066632 ) ph/cm2/s
Energy fluence (15-150 keV)             : 1.68831e-06 ( -1.78224e-07  1.80528e-07 ) ergs/cm2
Cutoff power-law model

Time interval is from   -8.592 sec. to   28.408 sec.
Spectral model in the cutoff power-law:
------------------------------------------------------------
Parameters  : value       lower 90%   higher 90%
Photon index: 1.63262     ( -0.740119   0.588884 )
Epeak [keV] : 65.7029      ( -65.6507 -65.7086 )
Norm@50keV  : 6.81962E-03    ( -0.00397493   0.0108563 )
------------------------------------------------------------
#Fit statistic  : Chi-Squared                   54.64     using 59 bins.
 Reduced chi-squared = 0.975714
# Null hypothesis probability of 5.26e-01 with 56 degrees of freedom

Photon flux (15-150 keV)    in 37 sec: 0.699423 ( -0.068724  0.068615 ) ph/cm2/s
Energy fluence (15-150 keV)             : 1.64881e-06 ( -2.0709e-07  2.0204e-07 ) ergs/cm2
Band function

Time interval is from   -8.592 sec. to   28.408 sec.


Spectral model in the Band function:
------------------------------------------------------------
Parameters  : value       lower 90%   higher 90%
alpha       :    (     )
beta        :     (     )
Epeak [keV] :       (   )
Norm@50keV   :     (     )
------------------------------------------------------------

Photon flux (15-150 keV)    in  sec:  (    ) ph/cm2/s
Energy fluence (15-150 keV)             : 0 ( 0  0 ) ergs/cm2
Single BB

Spectral model blackbody:
------------------------------------------------------------
Parameters  : value    Lower 90%  Upper 90%
kT [keV]    : 10.5307  (-1.20178  1.38196)
R^2/D10^2   : 0.269534  (-0.100922   0.159236)
(R is the radius in km and D10 is the distance to the source in units of 10 kpc)
------------------------------------------------------------
#Fit statistic  : Chi-Squared                   81.99     using 59 bins.
 Reduced chi-squared =
# Null hypothesis probability of 1.67e-02 with 57 degrees of freedom

Energy  Fluence     90% Error
[keV]   [erg/cm2]   [erg/cm2]
15- 25  2.288e-07   3.867e-08
25- 50  6.108e-07   6.808e-08
50-150  3.696e-07   8.863e-08
15-150  1.209e-06   1.456e-07
Thermal bremsstrahlung (OTTB)
Spectral model: thermal bremsstrahlung
------------------------------------------------------------
Parameters  : value         Lower 90%    Upper 90%
kT [keV]    : 85.1063       (-23.3242      40.0694)
Norm        : 3.24602       (-0.445293     0.538875)
------------------------------------------------------------
#Fit statistic  : Chi-Squared                   55.15     using 59 bins.
 Reduced chi-squared =
# Null hypothesis probability of 5.45e-01 with 57 degrees of freedom

Energy  Fluence     90% Error
[keV]   [erg/cm2]   [erg/cm2]
15- 25  3.127e-07   4.973e-08
25- 50  5.223e-07   5.069e-08
50-150  7.679e-07   3.090e-07
15-150  1.603e-06   3.138e-07
Double BB

Spectral model: bbodyrad<1> + bbodyrad<2>
------------------------------------------------------------
Parameters  : value         Lower 90%    Upper 90%
kT1 [keV]   : 6.98941        (-1.51993      1.61115)
R1^2/D10^2  : 1.01321        (-0.51385      1.35893)
kT2 [keV]   : 28.7464        (-10.0401      38.1932)
R2^2/D10^2  : 4.35802E-03    (-0.00389272   0.0171951)
------------------------------------------------------------
#Fit statistic  : Chi-Squared                   52.32     using 59 bins.
 Reduced chi-squared =
# Null hypothesis probability of 5.78e-01 with 55 degrees of freedom

Energy  Fluence     90% Error
[keV]   [erg/cm2]   [erg/cm2]
15- 25  3.151e-07   9.320e-08
25- 50  5.307e-07   1.544e-07
50-150  8.344e-07   4.074e-07
15-150  1.680e-06   5.400e-07
Peak spectrum fit
Power-law model

Time interval is from    0.408 sec. to    1.408 sec.

Spectral model in power-law:
------------------------------------------------------------
Parameters  : value       lower 90%   higher 90%
Photon index: 1.83750     ( -0.298571   0.318828 )
Norm@50keV  : 1.67627E-02    ( -0.00357628   0.00348882 )
------------------------------------------------------------
#Fit statistic  : Chi-Squared                   61.90     using 59 bins.
 Reduced chi-squared = 1.08596
# Null hypothesis probability of 3.05e-01 with 57 degrees of freedom

Photon flux (15-150 keV)    in 1 sec: 2.34443 ( -0.44843  0.44891 ) ph/cm2/s
Energy fluence (15-150 keV)             : 1.54188e-07 ( -3.2519e-08  3.29707e-08 ) ergs/cm2
Cutoff power-law model

Time interval is from    0.408 sec. to    1.408 sec.
Spectral model in the cutoff power-law:
------------------------------------------------------------
Parameters  : value       lower 90%   higher 90%
Photon index: 1.06921     ( -1.54544   1.09266 )
Epeak [keV] : 54.0638      ( -52.2415 -54.0641 )
Norm@50keV  : 4.52232E-02    ( -0.0452173   0.311601 )
------------------------------------------------------------
#Fit statistic  : Chi-Squared                   60.58     using 59 bins.
 Reduced chi-squared = 1.08179
# Null hypothesis probability of 3.14e-01 with 56 degrees of freedom

Photon flux (15-150 keV)    in 1 sec: 2.31630 ( -0.45035  0.45097 ) ph/cm2/s
Energy fluence (15-150 keV)             : 1.46991e-07 ( -3.49389e-08  3.50294e-08 ) ergs/cm2
Band function

Time interval is from    0.408 sec. to    1.408 sec.


Spectral model in the Band function:
------------------------------------------------------------
Parameters  : value       lower 90%   higher 90%
alpha       :    (     )
beta        :     (     )
Epeak [keV] :       (   )
Norm@50keV   :     (     )
------------------------------------------------------------

Photon flux (15-150 keV)    in  sec:  (    ) ph/cm2/s
Energy fluence (15-150 keV)             : 0 ( 0  0 ) ergs/cm2
Single BB
Spectral model blackbody:
------------------------------------------------------------
Parameters  : value    Lower 90%  Upper 90%
kT [keV]    : 10.6144  (-2.50891  3.33604)
R^2/D10^2   : 0.909499  (-0.576988   1.59326)
(R is the radius in km and D10 is the distance to the source in units of 10 kpc)
------------------------------------------------------------
#Fit statistic  : Chi-Squared                   66.71     using 59 bins.
 Reduced chi-squared =
# Null hypothesis probability of 1.78e-01 with 57 degrees of freedom

Energy  Fluence     90% Error
[keV]   [erg/cm2]   [erg/cm2]
15- 25  2.124e-08   7.195e-09
25- 50  5.731e-08   1.921e-08
50-150  3.546e-08   1.648e-08
15-150  1.140e-07   3.596e-08
Thermal bremsstrahlung (OTTB)
Spectral model: thermal bremsstrahlung
------------------------------------------------------------
Parameters  : value         Lower 90%    Upper 90%
kT [keV]    : 90.0134       (-39.3702      -90.0135)
Norm        : 10.8362       (-2.61109     3.52362)
------------------------------------------------------------
#Fit statistic  : Chi-Squared                   60.64     using 59 bins.
 Reduced chi-squared =
# Null hypothesis probability of 3.46e-01 with 57 degrees of freedom

Energy  Fluence     90% Error
[keV]   [erg/cm2]   [erg/cm2]
15- 25  2.827e-08   7.460e-09
25- 50  4.782e-08   1.308e-08
50-150  7.283e-08   4.153e-08
15-150  1.489e-07   6.119e-08
Double BB
Spectral model: bbodyrad<1> + bbodyrad<2>
------------------------------------------------------------
Parameters  : value         Lower 90%    Upper 90%
kT1 [keV]   : 6.68881        (-2.03881      2.76197)
R1^2/D10^2  : 3.87184        (-2.71164      4.34482)
kT2 [keV]   : 24.0183        (-24.0501      47.9986)
R2^2/D10^2  : 2.80220E-02    (-0.0269483   0.178145)
------------------------------------------------------------
#Fit statistic  : Chi-Squared                   58.36     using 59 bins.
 Reduced chi-squared =
# Null hypothesis probability of 3.53e-01 with 55 degrees of freedom

Energy  Fluence     90% Error
[keV]   [erg/cm2]   [erg/cm2]
15- 25  2.935e-08   1.647e-08
25- 50  4.908e-08   2.641e-08
50-150  7.311e-08   4.263e-08
15-150  1.515e-07   7.860e-08
Pre-slew spectrum (Pre-slew PHA with pre-slew DRM)
Power-law model

Spectral model in power-law:
------------------------------------------------------------
Parameters  : value       lower 90%   higher 90%
Photon index: 1.87835     ( -0.165757   0.171081 )
Norm@50keV  : 4.96279E-03    ( -0.00053255   0.000523641 )
------------------------------------------------------------
#Fit statistic  : Chi-Squared                   55.06     using 59 bins.
 Reduced chi-squared =
# Null hypothesis probability of 5.48e-01 with 57 degrees of freedom

Photon flux (15-150 keV)    in 37 sec: 0.705755 ( -0.0665607  0.0666248 ) ph/cm2/s
Energy fluence (15-150 keV)             : 1.68804e-06 ( -1.78535e-07  1.8055e-07 ) ergs/cm2
Cutoff power-law model
Spectral model in the cutoff power-law:
------------------------------------------------------------
Parameters  : value       lower 90%   higher 90%
Photon index: 1.63251     ( -0.74009   0.588913 )
Epeak [keV] : 65.6889      ( -40.8776 -65.7077 )
Norm@50keV  : 6.82070E-03    ( -0.00397589   0.0108577 )
------------------------------------------------------------
#Fit statistic  : Chi-Squared                   54.64     using 59 bins.
 Reduced chi-squared =
# Null hypothesis probability of 5.26e-01 with 56 degrees of freedom

Photon flux (15-150 keV)    in 37 sec: 0.699271 ( -0.06869  0.068589 ) ph/cm2/s
Energy fluence (15-150 keV)             : 1.64924e-06 ( -2.07466e-07  2.04995e-07 ) ergs/cm2
Band function
Spectral model in the Band function:
------------------------------------------------------------
Parameters  : value       lower 90%   higher 90%
alpha       :    (     )
beta        :     (     )
Epeak [keV] :       (   )
Norm@50keV   :     (     )
------------------------------------------------------------

Photon flux (15-150 keV)    in  sec:  (    ) ph/cm2/s
Energy fluence (15-150 keV)             : 0 ( 0  0 ) ergs/cm2
S(25-50 keV) vs. S(50-100 keV) plot

S(25-50 keV)  = 4.88e-07
S(50-100 keV) = 5.33e-07
T90 vs. Hardness ratio plot

T90                                   = 31 sec.
Hardness ratio (energy fluence ratio) = 1.09221
Color vs. Color plot
Count Ratio  (25-50 keV) / (15-25 keV) = 1.14732
Count Ratio (50-100 keV) / (15-25 keV) = 0.640958
Mask shadow pattern
IMX = -8.908462002951257E-01, IMY = 2.666875510581019E-01
TIME vs. PHA plot around the trigger time
Blue+Cyan dotted lines: Time interval of the scaled map
From 0.000000 to 1.024000
TIME vs. DetID plot around the trigger time

Blue+Cyan dotted lines: Time interval of the scaled map
From 0.000000 to 1.024000
100 us light curve (15-350 keV)
Blue+Cyan dotted lines: Time interval of the scaled map
From 0.000000 to 1.024000
Spacecraft aspect plot
Bright source in the pre-burst/pre-slew/post-slew images
Pre-burst image of 15-350 keV band
Time interval of the image:
-239.592000 -8.592000

# RAcent  DECcent POSerr Theta    Phi  PeakCts   SNR AngSep     Name
#  [deg]    [deg]    ['] [deg]  [deg]                   [']
254.3279  35.2638   13.2  42.2   39.9   0.5707   0.9    7.9	Her X-1
308.1395  40.9605    5.7  55.5  -14.4   2.3946   2.0    1.4	Cyg X-3
211.9550  31.6524    2.4  37.7   95.8   4.4975   4.8 ------	UNKNOWN
108.3925  43.5058    2.6  53.1 -142.3   8.3258   4.5 ------	UNKNOWN
Pre-slew background subtracted image of 15-350 keV band
Time interval of the image:
-8.592000 28.408000

# RAcent  DECcent POSerr Theta    Phi  PeakCts   SNR AngSep     Name
#  [deg]    [deg]    ['] [deg]  [deg]                   [']
254.4003  35.3787   21.8  42.2   39.8  -0.1240  -0.5    3.5	Her X-1
307.9941  40.7727    0.0  55.6  -14.2  -1.0483  -2.4   12.0	Cyg X-3
235.3928  83.7639    2.9  15.4  -68.2   0.5114   4.0 ------	UNKNOWN
134.3743  45.1299    0.6  42.9 -163.3   3.1376  18.1 ------	UNKNOWN
333.5411  69.7525    2.6  36.2  -50.4   0.9276   4.5 ------	UNKNOWN
 68.3795  76.1000    2.0  32.5  -95.7   1.3010   5.9 ------	UNKNOWN
336.1046  54.9102    2.2  50.2  -42.8   2.9095   5.4 ------	UNKNOWN
Post-slew image of 15-350 keV band
Time interval of the image:
299.108610 708.741400
720.408000 774.798000
780.408000 839.078100
840.408000 962.481000

# RAcent  DECcent POSerr Theta    Phi  PeakCts   SNR AngSep     Name
#  [deg]    [deg]    ['] [deg]  [deg]                   [']
299.5933  35.1744    1.4  22.9   88.5   9.8511   8.0    1.6	Cyg X-1
308.1125  40.9543  180.2  14.3   95.2   0.0744   0.1    0.1	Cyg X-3
326.1779  38.1876   16.6   6.4   19.1   0.7751   0.7    8.0	Cyg X-2
294.0081  15.2008    2.7  40.5   67.1  14.0100   4.3 ------	UNKNOWN
340.0289   4.9117    2.1  41.2   -6.9   8.6502   5.7 ------	UNKNOWN
350.7910  45.0177    3.1  16.8  -87.1   4.3515   3.7 ------	UNKNOWN
  9.1705  55.7338    2.5  28.7 -115.1   6.1802   4.7 ------	UNKNOWN
 51.8005  72.0761    2.7  46.6 -142.0  10.5776   4.3 ------	UNKNOWN
 23.9440  48.3651    4.8  38.5 -103.6   8.1264   2.4 ------	UNKNOWN
 18.4684  32.8494    3.1  41.1  -78.7  15.5938   3.8 ------	UNKNOWN
Plot creation:
Fri Jun 16 09:06:04 EDT 2023