Click here for the BAT GCN circular template
Image
Pre-slew 15.0-350.0 keV image (Event data)
#   RAcent    DECcent   POSerr    Theta     Phi              Peak Cts       SNR   Name
  141.7573    30.2669   0.0093    49.3359  -157.1464         3.6471222     20.778 TRIG_00117504

Foreground time interval of the image:
-10.064  52.508 (delta_t =  62.572 [sec])
Background time interval of the image:
-299.608 -10.064 (delta_t = 289.544 [sec])
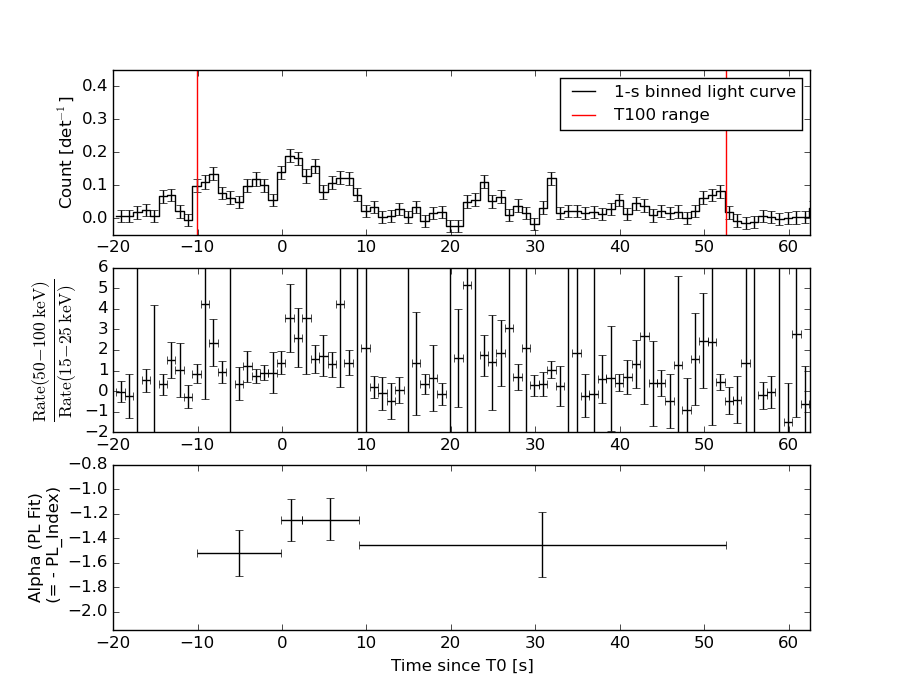
Lightcurves
Notes:
- 1) The mask-weighted light curves are using the flight position.
- 2) Multiple plots of different time binning/intervals are shown to cover all scenarios of short/long GRBs, rate/image triggers, and real/false positives.
- 3) For all the mask-weighted lightcurves, the y-axis units are counts/sec/det where a det is 0.4 x 0.4 = 0.16 sq cm.
- 4) The verticle lines correspond to following: green dotted lines are T50 interval, black dotted lines are T90 interval, blue solid line(s) is a spacecraft slew start time, and orange solid line(s) is a spacecraft slew end time.
- 5) Time of each bin is in the middle of the bin.
1 s binning
From T0-310 s to T0+310 s
From T100_start - 20 s to T100_end + 30 s
Full time interval
64 ms binning
Full time interval
From T100_start to T100_end
From T0-5 sec to T0+5 sec
16 ms binning
From T100_start-5 s to T100_start+5 s
Blue+Cyan dotted lines: Time interval of the scaled map
From 0.000000 to 2.048000
8 ms binning
From T100_start-3 s to T100_start+3 s

Blue+Cyan dotted lines: Time interval of the scaled map
From 0.000000 to 2.048000
2 ms binning
From T100_start-1 s to T100_start+1 s
Blue+Cyan dotted lines: Time interval of the scaled map
From 0.000000 to 2.048000
SN=5 or 10 sec. binning (whichever binning is satisfied first)
SN=5 or 10 sec. binning (T < 200 sec)
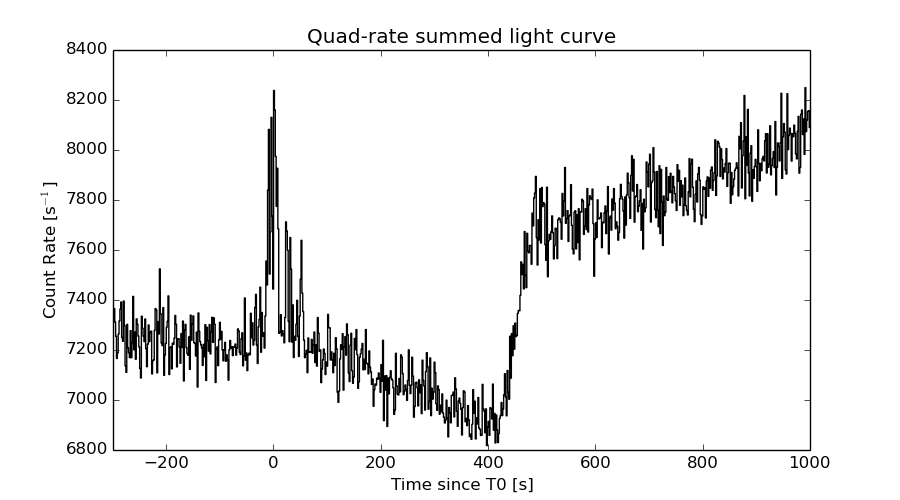
Quad-rate summed light curves (from T0-300s to T0+1000s)
Spectral Evolution
Spectra
Notes:
- 1) The fitting includes the systematic errors.
- 2) When the burst includes telescope slew time periods, the fitting uses an average response file made from multiple 5-s response files through out the slew time plus single time preiod for the non-slew times, and weighted by the total counts in the corresponding time period using addrmf. An average response file is needed becuase a spectral fit using the pre-slew DRM will introduce some errors in both a spectral shape and a normalization if the PHA file contains a lot of the slew/post-slew time interval.
- 3) For fits to more complicated models (e.g. a power-law over a cutoff power-law), the BAT team has decided to require a chi-square improvement of more than 6 for each extra dof.
Time averaged spectrum fit using the average DRM
Power-law model
Time interval is from  -10.064 sec. to   52.508 sec.

Spectral model in power-law:
------------------------------------------------------------
Parameters  : value       lower 90%   higher 90%
Photon index: 1.39540     ( -0.118879   0.117582 )
Norm@50keV  : 4.12095E-03    ( -0.000288181   0.000288095 )
------------------------------------------------------------
#Fit statistic : Chi-Squared =          42.84 using 59 PHA bins.
# Reduced chi-squared =         0.7516 for     57 degrees of freedom
# Null hypothesis probability =   9.179366e-01

Photon flux (15-150 keV)    in 62.57 sec: 0.501330 ( -0.0381736  0.0383321 ) ph/cm2/s
Energy fluence (15-150 keV)             : 2.49385e-06 ( -1.80867e-07  1.81152e-07 ) ergs/cm2
Cutoff power-law model

Time interval is from  -10.064 sec. to   52.508 sec.
Spectral model in the cutoff power-law:
------------------------------------------------------------
Parameters  : value       lower 90%   higher 90%
Photon index: 0.968115     ( -0.533436   0.464944 )
Epeak [keV] : 131.945      ( -45.5182 -131.951 )
Norm@50keV  : 6.54774E-03    ( -0.00251792   0.00491841 )
------------------------------------------------------------
#Fit statistic : Chi-Squared =          40.51 using 59 PHA bins.
# Reduced chi-squared =         0.7233 for     56 degrees of freedom
# Null hypothesis probability =   9.407968e-01

Photon flux (15-150 keV)    in 62.57 sec: 0.492288 ( -0.039413  0.039557 ) ph/cm2/s
Energy fluence (15-150 keV)             : 2.44884e-06 ( -1.91577e-07  1.89994e-07 ) ergs/cm2
Band function

Time interval is from  -10.064 sec. to   52.508 sec.

Spectral model in the Band function:
------------------------------------------------------------
Parameters  : value       lower 90%   higher 90%
alpha       : -5.58920E-02   ( -1.07147   0.120594 )
beta        : -1.62617    ( 1.62651   0.231642 )
Epeak [keV] : 60.2919      ( -29.6046 59.5152 )
Norm@50keV   : 2.27929E-02    ( -0.0233322   57.5106 )
------------------------------------------------------------
#Fit statistic : Chi-Squared =          37.84 using 59 PHA bins.
# Reduced chi-squared =         0.6880 for     55 degrees of freedom
# Null hypothesis probability =   9.625164e-01

Photon flux (15-150 keV)    in 62.57 sec:  (    ) ph/cm2/s
Energy fluence (15-150 keV)             : 2.43574e-06 ( -2.4353e-06  -1.87059e-07 ) ergs/cm2
Single BB
Spectral model blackbody:
------------------------------------------------------------
Parameters  : value    Lower 90%  Upper 90%
kT [keV]    : 17.2364  (-1.45149  1.63376)
R^2/D10^2   : 3.63559E-02  (-0.0100195   0.0133933)
(R is the radius in km and D10 is the distance to the source in units of 10 kpc)
------------------------------------------------------------
#Fit statistic : Chi-Squared =          77.63 using 59 PHA bins.
# Reduced chi-squared =          1.362 for     57 degrees of freedom
# Null hypothesis probability =   3.597606e-02

Energy  Fluence     90% Error
[keV]   [erg/cm2]   [erg/cm2]
15- 25  1.371e-07   1.996e-08
25- 50  6.133e-07   6.429e-08
50-150  1.307e-06   1.467e-07
15-150  2.057e-06   1.727e-07
Thermal bremsstrahlung (OTTB)
Spectral model: thermal bremsstrahlung
------------------------------------------------------------
Parameters  : value         Lower 90%    Upper 90%
kT [keV]    : 200.000       (      )
Norm        : 2.11842       (-0.148417     0.148392)
------------------------------------------------------------
#Fit statistic : Chi-Squared =          46.87 using 59 PHA bins.
# Reduced chi-squared =         0.8223 for     57 degrees of freedom
# Null hypothesis probability =   8.284556e-01

Energy  Fluence     90% Error
[keV]   [erg/cm2]   [erg/cm2]
15- 25  3.302e-07   2.825e-08
25- 50  6.351e-07   6.029e-08
50-150  1.393e-06   2.972e-07
15-150  2.358e-06   3.103e-07
Double BB
Spectral model: bbodyrad<1> + bbodyrad<2>
------------------------------------------------------------
Parameters  : value         Lower 90%    Upper 90%
kT1 [keV]   : 10.3060        (-2.19665      2.32406)
R1^2/D10^2  : 0.153841        (-0.0677006      0.152202)
kT2 [keV]   : 42.0951        (-14.2016      96.9569)
R2^2/D10^2  : 1.29246E-03    (-0.00116497   0.00389096)
------------------------------------------------------------
#Fit statistic : Chi-Squared =          37.62 using 59 PHA bins.
# Reduced chi-squared =         0.6839 for     55 degrees of freedom
# Null hypothesis probability =   9.647173e-01

Energy  Fluence     90% Error
[keV]   [erg/cm2]   [erg/cm2]
15- 25  2.280e-07   5.991e-08
25- 50  6.684e-07   1.893e-07
50-150  1.564e-06   6.510e-07
15-150  2.460e-06   8.131e-07
Peak spectrum fit
Power-law model
Time interval is from    1.020 sec. to    2.020 sec.

Spectral model in power-law:
------------------------------------------------------------
Parameters  : value       lower 90%   higher 90%
Photon index: 1.08262     ( -0.256801   0.240541 )
Norm@50keV  : 1.58648E-02    ( -0.00252936   0.00249335 )
------------------------------------------------------------
#Fit statistic : Chi-Squared =          62.81 using 59 PHA bins.
# Reduced chi-squared =          1.102 for     57 degrees of freedom
# Null hypothesis probability =   2.781050e-01

Photon flux (15-150 keV)    in 1 sec: 1.83725 ( -0.304378  0.307804 ) ph/cm2/s
Energy fluence (15-150 keV)             : 1.66791e-07 ( -2.51791e-08  2.52284e-08 ) ergs/cm2
Cutoff power-law model

Time interval is from    1.020 sec. to    2.020 sec.
Spectral model in the cutoff power-law:
------------------------------------------------------------
Parameters  : value       lower 90%   higher 90%
Photon index: 0.318319     ( -1.18331   0.862145 )
Epeak [keV] : 132.797      ( -47.9651 -132.804 )
Norm@50keV  : 3.36017E-02    ( -0.0190388   0.0644179 )
------------------------------------------------------------
#Fit statistic : Chi-Squared =          60.90 using 59 PHA bins.
# Reduced chi-squared =          1.088 for     56 degrees of freedom
# Null hypothesis probability =   3.040004e-01

Photon flux (15-150 keV)    in 1 sec: 1.79130 ( -0.30738  0.31202 ) ph/cm2/s
Energy fluence (15-150 keV)             : 1.64674e-07 ( -2.5798e-08  2.5663e-08 ) ergs/cm2
Band function
Time interval is from    1.020 sec. to    2.020 sec.

Spectral model in the Band function:
------------------------------------------------------------
Parameters  : value       lower 90%   higher 90%
alpha       : -0.320456   ( -0.615495   1.2734 )
beta        : -10.0000    ( 10   20 )
Epeak [keV] : 132.946      ( -38.0971 491.073 )
Norm@50keV   : 3.35425E-02    ( -0.0189874   0.0645672 )
------------------------------------------------------------
#Fit statistic : Chi-Squared =          60.90 using 59 PHA bins.
# Reduced chi-squared =          1.107 for     55 degrees of freedom
# Null hypothesis probability =   2.719768e-01

Photon flux (15-150 keV)    in 1 sec: 1.79972 (    ) ph/cm2/s
Energy fluence (15-150 keV)             : 0 ( 0  0 ) ergs/cm2
Single BB
Spectral model blackbody:
------------------------------------------------------------
Parameters  : value    Lower 90%  Upper 90%
kT [keV]    : 22.7510  (-3.83086  5.08173)
R^2/D10^2   : 5.93709E-02  (-0.0289688   0.0510907)
(R is the radius in km and D10 is the distance to the source in units of 10 kpc)
------------------------------------------------------------
#Fit statistic : Chi-Squared =          66.01 using 59 PHA bins.
# Reduced chi-squared =          1.158 for     57 degrees of freedom
# Null hypothesis probability =   1.935174e-01

Energy  Fluence     90% Error
[keV]   [erg/cm2]   [erg/cm2]
15- 25  5.598e-09   1.871e-09
25- 50  3.019e-08   8.040e-09
50-150  1.167e-07   2.937e-08
15-150  1.525e-07   3.250e-08
Thermal bremsstrahlung (OTTB)
Spectral model: thermal bremsstrahlung
------------------------------------------------------------
Parameters  : value         Lower 90%    Upper 90%
kT [keV]    : 200.000       (      )
Norm        : 8.06257       (-1.25313     1.25285)
------------------------------------------------------------
#Fit statistic : Chi-Squared =          72.92 using 59 PHA bins.
# Reduced chi-squared =          1.279 for     57 degrees of freedom
# Null hypothesis probability =   7.599595e-02

Energy  Fluence     90% Error
[keV]   [erg/cm2]   [erg/cm2]
15- 25  2.009e-08   1.128e-08
25- 50  3.864e-08   2.161e-08
50-150  8.474e-08   4.709e-08
15-150  1.435e-07   8.190e-08
Double BB
Spectral model: bbodyrad<1> + bbodyrad<2>
------------------------------------------------------------
Parameters  : value         Lower 90%    Upper 90%
kT1 [keV]   : 8.98003        (-3.35716      6.3559)
R1^2/D10^2  : 0.606732        (-0.477926      1.22346)
kT2 [keV]   : 32.8139        (-8.35434      40.5203)
R2^2/D10^2  : 1.51608E-02    (-0.0134778   0.042995)
------------------------------------------------------------
#Fit statistic : Chi-Squared =          59.27 using 59 PHA bins.
# Reduced chi-squared =          1.078 for     55 degrees of freedom
# Null hypothesis probability =   3.228067e-01

Energy  Fluence     90% Error
[keV]   [erg/cm2]   [erg/cm2]
15- 25  1.193e-08   6.815e-09
25- 50  3.557e-08   1.944e-08
50-150  1.202e-07   6.505e-08
15-150  1.677e-07   8.570e-08
Pre-slew spectrum (Pre-slew PHA with pre-slew DRM)
Power-law model

Spectral model in power-law:
------------------------------------------------------------
Parameters  : value       lower 90%   higher 90%
Photon index: 1.39540     ( -0.118879   0.117582 )
Norm@50keV  : 4.12095E-03    ( -0.000288181   0.000288095 )
------------------------------------------------------------
#Fit statistic : Chi-Squared =          42.84 using 59 PHA bins.
# Reduced chi-squared =         0.7516 for     57 degrees of freedom
# Null hypothesis probability =   9.179366e-01

Photon flux (15-150 keV)    in 62.57 sec: 0.501330 ( -0.0381736  0.0383321 ) ph/cm2/s
Energy fluence (15-150 keV)             : 2.49385e-06 ( -1.80867e-07  1.81152e-07 ) ergs/cm2
Cutoff power-law model
Spectral model in the cutoff power-law:
------------------------------------------------------------
Parameters  : value       lower 90%   higher 90%
Photon index: 0.968115     ( -0.533436   0.464944 )
Epeak [keV] : 131.945      ( -45.5182 -131.951 )
Norm@50keV  : 6.54774E-03    ( -0.00251792   0.00491841 )
------------------------------------------------------------
#Fit statistic : Chi-Squared =          40.51 using 59 PHA bins.
# Reduced chi-squared =         0.7233 for     56 degrees of freedom
# Null hypothesis probability =   9.407968e-01

Photon flux (15-150 keV)    in 62.57 sec: 0.492288 ( -0.039413  0.039557 ) ph/cm2/s
Energy fluence (15-150 keV)             : 2.44884e-06 ( -1.91577e-07  1.89994e-07 ) ergs/cm2
Band function
Spectral model in the Band function:
------------------------------------------------------------
Parameters  : value       lower 90%   higher 90%
alpha       : -5.58920E-02   ( -1.07147   0.120594 )
beta        : -1.62617    ( 1.62651   0.231642 )
Epeak [keV] : 60.2919      ( -29.6046 59.5152 )
Norm@50keV   : 2.27929E-02    ( -0.0233322   57.5109 )
------------------------------------------------------------
#Fit statistic : Chi-Squared =          37.84 using 59 PHA bins.
# Reduced chi-squared =         0.6880 for     55 degrees of freedom
# Null hypothesis probability =   9.625164e-01

Photon flux (15-150 keV)    in 62.57 sec:  (    ) ph/cm2/s
Energy fluence (15-150 keV)             : 2.43574e-06 ( -2.4353e-06  -1.87059e-07 ) ergs/cm2
S(25-50 keV) vs. S(50-100 keV) plot
S(25-50 keV)  = 5.85e-07
S(50-100 keV) = 8.89e-07
T90 vs. Hardness ratio plot
T90                                   = 58.852000027895 sec.
Hardness ratio (energy fluence ratio) = 1.51966
Color vs. Color plot
Count Ratio  (25-50 keV) / (15-25 keV) = 1.91345
Count Ratio (50-100 keV) / (15-25 keV) = 1.54644
Mask shadow pattern
IMX = -1.072701464266677E+00, IMY = 4.521030627170247E-01
TIME vs. PHA plot around the trigger time
Blue+Cyan dotted lines: Time interval of the scaled map
From 0.000000 to 2.048000
TIME vs. DetID plot around the trigger time

Blue+Cyan dotted lines: Time interval of the scaled map
From 0.000000 to 2.048000
100 us light curve (15-350 keV)
Blue+Cyan dotted lines: Time interval of the scaled map
From 0.000000 to 2.048000
Spacecraft aspect plot
Bright source in the pre-burst/pre-slew/post-slew images
Pre-burst image of 15-350 keV band
Time interval of the image:
-299.608000 -10.064000

# RAcent  DECcent POSerr Theta    Phi  PeakCts   SNR AngSep     Name
#  [deg]    [deg]    ['] [deg]  [deg]                   [']
254.4853  35.3526   67.0  40.4    8.8   0.0420   0.2    1.5	Her X-1
239.2187  10.8309    2.0  45.0   50.3   3.9238   5.9 ------	UNKNOWN
273.5117  35.9419    2.4  53.7   -1.9   2.3215   4.7 ------	UNKNOWN
232.5301  47.5448    2.7  21.6   -7.2   0.6693   4.3 ------	UNKNOWN
141.6258  71.9028    3.5  41.0  -98.0   3.1860   3.3 ------	UNKNOWN
Pre-slew background subtracted image of 15-350 keV band
Time interval of the image:
-10.064000 52.508000

# RAcent  DECcent POSerr Theta    Phi  PeakCts   SNR AngSep     Name
#  [deg]    [deg]    ['] [deg]  [deg]                   [']
254.3034  35.4339    4.2  40.2    8.8   0.3249   2.7    9.3	Her X-1
239.9916  10.8440    2.7  45.5   49.5   1.3854   4.2 ------	UNKNOWN
223.9101  10.4371    2.7  37.2   70.0   0.8383   4.3 ------	UNKNOWN
152.9402  13.8082    2.1  51.3  177.7   1.0706   5.5 ------	UNKNOWN
219.0630  42.7800    2.2  12.1   10.0   0.3556   5.2 ------	UNKNOWN
166.5135  28.4189    2.1  32.2 -177.9   0.4686   5.5 ------	UNKNOWN
141.7573  30.2669    0.6  49.3 -157.1   3.6467  20.8 ------	UNKNOWN
276.6008  67.2314    3.6  45.4  -42.1   0.5876   3.2 ------	UNKNOWN
Post-slew image of 15-350 keV band
Time interval of the image:
Plot creation:
Sun May 31 16:52:26 EDT 2015