Estimated redshift from machine learning (Ukwatta et al. 2016) - may take a few minute to calcaulte
Image
Pre-slew 15.0-350.0 keV image (Event data)
#   RAcent    DECcent   POSerr    Theta     Phi              Peak Cts       SNR   Name
  196.6422     3.2776   0.0139     5.4456    89.7705         1.9491461     13.755 TRIG_01175438

Foreground time interval of the image:
-27.784  73.301 (delta_t = 101.085 [sec])
Background time interval of the image:
-275.000 -27.784 (delta_t = 247.216 [sec])
Lightcurves
Notes:
- 1) The mask-weighted light curves are using the flight position.
- 2) Multiple plots of different time binning/intervals are shown to cover all scenarios of short/long GRBs, rate/image triggers, and real/false positives.
- 3) For all the mask-weighted lightcurves, the y-axis units are counts/sec/det where a det is 0.4 x 0.4 = 0.16 sq cm.
- 4) The verticle lines correspond to following: green dotted lines are T50 interval, black dotted lines are T90 interval, blue solid line(s) is a spacecraft slew start time, and orange solid line(s) is a spacecraft slew end time.
- 5) Time of each bin is in the middle of the bin.
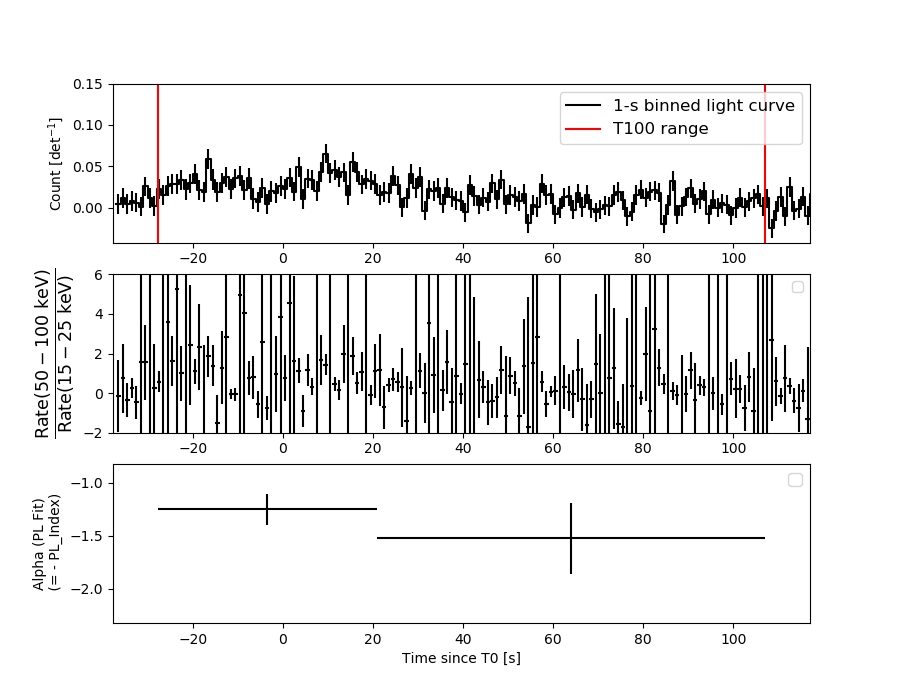
1 s binning
From T0-310 s to T0+310 s

From T100_start - 20 s to T100_end + 30 s

Full time interval
64 ms binning
Full time interval
From T100_start to T100_end
From T0-5 sec to T0+5 sec

16 ms binning
From T100_start-5 s to T100_start+5 s
8 ms binning
From T100_start-3 s to T100_start+3 s
2 ms binning
From T100_start-1 s to T100_start+1 s
SN=5 or 10 sec. binning (whichever binning is satisfied first)
SN=5 or 10 sec. binning (T < 200 sec)

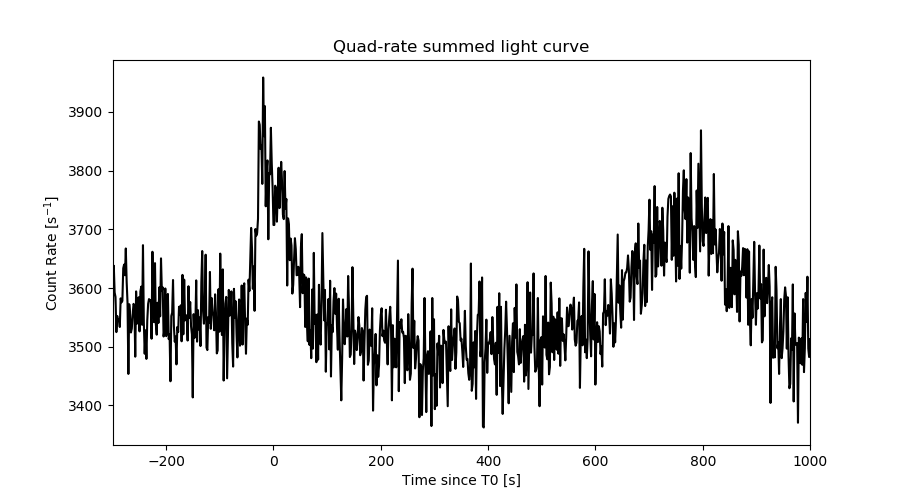
Quad-rate summed light curves (from T0-300s to T0+1000s)
Spectral Evolution
Spectra
Notes:
- 1) The fitting includes the systematic errors.
- 2) When the burst includes telescope slew time periods, the fitting uses an average response file made from multiple 5-s response files through out the slew time plus single time preiod for the non-slew times, and weighted by the total counts in the corresponding time period using addrmf. An average response file is needed becuase a spectral fit using the pre-slew DRM will introduce some errors in both a spectral shape and a normalization if the PHA file contains a lot of the slew/post-slew time interval.
- 3) For fits to more complicated models (e.g. a power-law over a cutoff power-law), the BAT team has decided to require a chi-square improvement of more than 6 for each extra dof.
Time averaged spectrum fit using the average DRM
Power-law model
Time interval is from  -27.784 sec. to  107.004 sec.

Spectral model in power-law:
------------------------------------------------------------
Parameters  : value       lower 90%   higher 90%
Photon index: 1.35014     ( -0.153983   0.153726 )
Norm@50keV  : 1.16885E-03    ( -0.000104842   0.000104435 )
------------------------------------------------------------
#Fit statistic  : Chi-Squared                   49.39     using 59 bins.
 Reduced chi-squared = 0.866491
# Null hypothesis probability of 7.53e-01 with 57 degrees of freedom

Photon flux (15-150 keV)    in 134.8 sec: 0.140819 ( -0.012675  0.012688 ) ph/cm2/s
Energy fluence (15-150 keV)             : 1.539e-06 ( -1.53934e-07  1.55612e-07 ) ergs/cm2
Cutoff power-law model
Time interval is from  -27.784 sec. to  107.004 sec.
Spectral model in the cutoff power-law:
------------------------------------------------------------
Parameters  : value       lower 90%   higher 90%
Photon index: 0.887185     ( -0.671297   0.569645 )
Epeak [keV] : 122.730      ( -45.6931 -122.73 )
Norm@50keV  : 1.98472E-03    ( -0.000871428   0.00217435 )
------------------------------------------------------------
#Fit statistic  : Chi-Squared                   47.58     using 59 bins.
 Reduced chi-squared = 0.849643
# Null hypothesis probability of 7.81e-01 with 56 degrees of freedom

Photon flux (15-150 keV)    in 134.8 sec: 0.137931 ( -0.01323  0.013205 ) ph/cm2/s
Energy fluence (15-150 keV)             : 1.48501e-06 ( -1.69302e-07  1.69921e-07 ) ergs/cm2
Band function

Time interval is from  -27.784 sec. to  107.004 sec.


Spectral model in the Band function:
------------------------------------------------------------
Parameters  : value       lower 90%   higher 90%
alpha       :    (     )
beta        :     (     )
Epeak [keV] :       (   )
Norm@50keV   :     (     )
------------------------------------------------------------

Photon flux (15-150 keV)    in  sec:  (    ) ph/cm2/s
Energy fluence (15-150 keV)             : 0 ( 0  0 ) ergs/cm2
Single BB
Spectral model blackbody:
------------------------------------------------------------
Parameters  : value    Lower 90%  Upper 90%
kT [keV]    : 16.6683  (-1.84614  2.12382)
R^2/D10^2   : 1.14560E-02  (-0.00384544   0.00566929)
(R is the radius in km and D10 is the distance to the source in units of 10 kpc)
------------------------------------------------------------
#Fit statistic  : Chi-Squared                   69.97     using 59 bins.
 Reduced chi-squared =
# Null hypothesis probability of 1.16e-01 with 57 degrees of freedom

Energy  Fluence     90% Error
[keV]   [erg/cm2]   [erg/cm2]
15- 25  8.784e-08   1.570e-08
25- 50  3.825e-07   4.893e-08
50-150  7.539e-07   1.318e-07
15-150  1.224e-06   1.374e-07
Thermal bremsstrahlung (OTTB)
Spectral model: thermal bremsstrahlung
------------------------------------------------------------
Parameters  : value         Lower 90%    Upper 90%
kT [keV]    : 200.000       (-34.5814      -200)
Norm        : 0.580957       (-0.0515533     0.0515533)
------------------------------------------------------------
#Fit statistic  : Chi-Squared                   52.50     using 59 bins.
 Reduced chi-squared =
# Null hypothesis probability of 6.44e-01 with 57 degrees of freedom

Energy  Fluence     90% Error
[keV]   [erg/cm2]   [erg/cm2]
15- 25  1.950e-07   2.575e-08
25- 50  3.751e-07   9.133e-08
50-150  8.227e-07   4.124e-07
15-150  1.393e-06   5.589e-07
Double BB

Spectral model: bbodyrad<1> + bbodyrad<2>
------------------------------------------------------------
Parameters  : value         Lower 90%    Upper 90%
kT1 [keV]   : 6.46558        (-2.03114      2.78731)
R1^2/D10^2  : 0.154459        (-0.1042      0.374081)
kT2 [keV]   : 24.4260        (-4.77811      9.94165)
R2^2/D10^2  : 2.64426E-03    (-0.0018613   0.00237194)
------------------------------------------------------------
#Fit statistic  : Chi-Squared                   46.91     using 59 bins.
 Reduced chi-squared =
# Null hypothesis probability of 7.73e-01 with 55 degrees of freedom

Energy  Fluence     90% Error
[keV]   [erg/cm2]   [erg/cm2]
15- 25  1.652e-07   7.891e-08
25- 50  3.589e-07   1.347e-07
50-150  9.486e-07   3.637e-07
15-150  1.473e-06   5.385e-07
Peak spectrum fit
Power-law model
Time interval is from    9.040 sec. to   10.040 sec.

Spectral model in power-law:
------------------------------------------------------------
Parameters  : value       lower 90%   higher 90%
Photon index: 0.795654     ( -0.601262   0.522368 )
Norm@50keV  : 4.27706E-03    ( -0.00134963   0.00124564 )
------------------------------------------------------------
#Fit statistic  : Chi-Squared                   59.60     using 59 bins.
 Reduced chi-squared = 1.04561
# Null hypothesis probability of 3.81e-01 with 57 degrees of freedom

Photon flux (15-150 keV)    in 1 sec: 0.491641 ( -0.141227  0.14307 ) ph/cm2/s
Energy fluence (15-150 keV)             : 5.00783e-08 ( -1.40362e-08  1.40884e-08 ) ergs/cm2
Cutoff power-law model

Time interval is from    9.040 sec. to   10.040 sec.
Spectral model in the cutoff power-law:
------------------------------------------------------------
Parameters  : value       lower 90%   higher 90%
Photon index: 0.787048     ( -3.09313   -0.710087 )
Epeak [keV] : 1.00000E+04      ( -10000 -10000 )
Norm@50keV  : 4.30562E-03    ( -0.00135447   -0.00430633 )
------------------------------------------------------------
#Fit statistic  : Chi-Squared                   59.61     using 59 bins.
 Reduced chi-squared = 1.06446
# Null hypothesis probability of 3.46e-01 with 56 degrees of freedom

Photon flux (15-150 keV)    in 1 sec: 0.491476 ( -0.141253  0.143032 ) ph/cm2/s
Energy fluence (15-150 keV)             : 5.00553e-08 ( -1.40215e-08  1.40996e-08 ) ergs/cm2
Band function

Time interval is from    9.040 sec. to   10.040 sec.


Spectral model in the Band function:
------------------------------------------------------------
Parameters  : value       lower 90%   higher 90%
alpha       :    (     )
beta        :     (     )
Epeak [keV] :       (   )
Norm@50keV   :     (     )
------------------------------------------------------------

Photon flux (15-150 keV)    in  sec:  (    ) ph/cm2/s
Energy fluence (15-150 keV)             : 0 ( 0  0 ) ergs/cm2
Single BB
Spectral model blackbody:
------------------------------------------------------------
Parameters  : value    Lower 90%  Upper 90%
kT [keV]    : 29.6309  (-9.19086  21.2576)
R^2/D10^2   : 7.51181E-03  (-0.00751326   0.0154208)
(R is the radius in km and D10 is the distance to the source in units of 10 kpc)
------------------------------------------------------------
#Fit statistic  : Chi-Squared                   61.48     using 59 bins.
 Reduced chi-squared =
# Null hypothesis probability of 3.19e-01 with 57 degrees of freedom

Energy  Fluence     90% Error
[keV]   [erg/cm2]   [erg/cm2]
15- 25  1.040e-09   6.560e-10
25- 50  6.380e-09   3.799e-09
50-150  3.976e-08   2.367e-08
15-150  4.718e-08   2.753e-08
Thermal bremsstrahlung (OTTB)
Spectral model: thermal bremsstrahlung
------------------------------------------------------------
Parameters  : value         Lower 90%    Upper 90%
kT [keV]    : 200.000       (-79.3774      -200)
Norm        : 2.02756       (-0.589145     0.589145)
------------------------------------------------------------
#Fit statistic  : Chi-Squared                   65.84     using 59 bins.
 Reduced chi-squared =
# Null hypothesis probability of 1.98e-01 with 57 degrees of freedom

Energy  Fluence     90% Error
[keV]   [erg/cm2]   [erg/cm2]
15- 25  5.048e-09   3.135e-09
25- 50  9.711e-09   5.785e-09
50-150  2.130e-08   1.322e-08
15-150  3.606e-08   2.224e-08
Double BB
Spectral model: bbodyrad<1> + bbodyrad<2>
------------------------------------------------------------
Parameters  : value         Lower 90%    Upper 90%
kT1 [keV]   : 3.89978        (-2.42721      3.54701)
R1^2/D10^2  : 4.63938        (-4.70086      43.6782)
kT2 [keV]   : 35.5205        (-12.2832      40.9381)
R2^2/D10^2  : 4.29194E-03    (-0.00361108   0.00689482)
------------------------------------------------------------
#Fit statistic  : Chi-Squared                   57.03     using 59 bins.
 Reduced chi-squared =
# Null hypothesis probability of 3.99e-01 with 55 degrees of freedom

Energy  Fluence     90% Error
[keV]   [erg/cm2]   [erg/cm2]
15- 25  4.486e-09   2.736e-09
25- 50  6.239e-09   3.311e-09
50-150  4.084e-08   2.424e-08
15-150  5.157e-08   2.783e-08
Pre-slew spectrum (Pre-slew PHA with pre-slew DRM)
Power-law model
Spectral model in power-law:
------------------------------------------------------------
Parameters  : value       lower 90%   higher 90%
Photon index: 1.35027     ( -0.149948   0.14963 )
Norm@50keV  : 1.38864E-03    ( -0.000121905   0.000121635 )
------------------------------------------------------------
#Fit statistic  : Chi-Squared                   35.88     using 59 bins.
 Reduced chi-squared =
# Null hypothesis probability of 9.87e-01 with 57 degrees of freedom

Photon flux (15-150 keV)    in 101.1 sec: 0.167300 ( -0.0147182  0.0147328 ) ph/cm2/s
Energy fluence (15-150 keV)             : 1.3711e-06 ( -1.34832e-07  1.36101e-07 ) ergs/cm2
Cutoff power-law model
Spectral model in the cutoff power-law:
------------------------------------------------------------
Parameters  : value       lower 90%   higher 90%
Photon index: 0.914669     ( -0.621689   0.499112 )
Epeak [keV] : 126.425      ( -47.7817 -126.425 )
Norm@50keV  : 2.29360E-03    ( -0.000968595   0.00228297 )
------------------------------------------------------------
#Fit statistic  : Chi-Squared                   34.03     using 59 bins.
 Reduced chi-squared =
# Null hypothesis probability of 9.91e-01 with 56 degrees of freedom

Photon flux (15-150 keV)    in 101.1 sec: 0.164181 ( -0.015249  0.015233 ) ph/cm2/s
Energy fluence (15-150 keV)             : 1.32581e-06 ( -1.47343e-07  1.47889e-07 ) ergs/cm2
Band function

Spectral model in the Band function:
------------------------------------------------------------
Parameters  : value       lower 90%   higher 90%
alpha       :    (     )
beta        :     (     )
Epeak [keV] :       (   )
Norm@50keV   :     (     )
------------------------------------------------------------

Photon flux (15-150 keV)    in  sec:  (    ) ph/cm2/s
Energy fluence (15-150 keV)             : 0 ( 0  0 ) ergs/cm2
S(25-50 keV) vs. S(50-100 keV) plot

S(25-50 keV)  = 3.52e-07
S(50-100 keV) = 5.53e-07
T90 vs. Hardness ratio plot
T90                                   = 104.051999926567 sec.
Hardness ratio (energy fluence ratio) = 1.57102
Color vs. Color plot
Count Ratio  (25-50 keV) / (15-25 keV) = 1.49762
Count Ratio (50-100 keV) / (15-25 keV) = 1.27396
Mask shadow pattern
IMX = 3.817690076934504E-04, IMY = -9.533068798711747E-02
TIME vs. PHA plot around the trigger time

TIME vs. DetID plot around the trigger time
100 us light curve (15-350 keV)
Spacecraft aspect plot
Bright source in the pre-burst/pre-slew/post-slew images
Pre-burst image of 15-350 keV band
Time interval of the image:
-275.000000 -27.784000

# RAcent  DECcent POSerr Theta    Phi  PeakCts   SNR AngSep     Name
#  [deg]    [deg]    ['] [deg]  [deg]                   [']
221.7400  -6.3782    3.5  32.2   77.6   2.5484   3.3 ------	UNKNOWN
239.7130  45.9997    2.4  56.9    2.4   7.0688   4.7 ------	UNKNOWN
144.2993 -21.1214    3.3  54.5 -157.1   4.7235   3.5 ------	UNKNOWN
Pre-slew background subtracted image of 15-350 keV band
Time interval of the image:
-27.784000 73.300600

# RAcent  DECcent POSerr Theta    Phi  PeakCts   SNR AngSep     Name
#  [deg]    [deg]    ['] [deg]  [deg]                   [']
196.6421   3.2776    0.8   5.4   89.8   1.9490  13.8 ------	UNKNOWN
Post-slew image of 15-350 keV band
Time interval of the image:
114.500610 289.513000
291.000000 963.012400

# RAcent  DECcent POSerr Theta    Phi  PeakCts   SNR AngSep     Name
#  [deg]    [deg]    ['] [deg]  [deg]                   [']
227.8539  -4.0281    3.8  32.1   77.5   7.7413   3.1 ------	UNKNOWN
226.3339  -7.5675    2.3  31.6   84.7  12.0379   4.9 ------	UNKNOWN
219.7701   8.9129    2.8  23.7   49.8   6.3529   4.1 ------	UNKNOWN
Plot creation:
Sat Sep 30 00:48:40 EDT 2023