Estimated redshift from machine learning (Ukwatta et al. 2016) - may take a few minute to calcaulte
Image
Pre-slew 15.0-350.0 keV image (Event data)

#   RAcent    DECcent   POSerr    Theta     Phi              Peak Cts       SNR   Name
  171.8514   -11.4292   0.0227    46.2422    -6.9428         0.5040978      8.462 TRIG_01177054

Foreground time interval of the image:
 -0.504   4.808 (delta_t =   5.312 [sec])
Background time interval of the image:
-239.240  -0.504 (delta_t = 238.736 [sec])
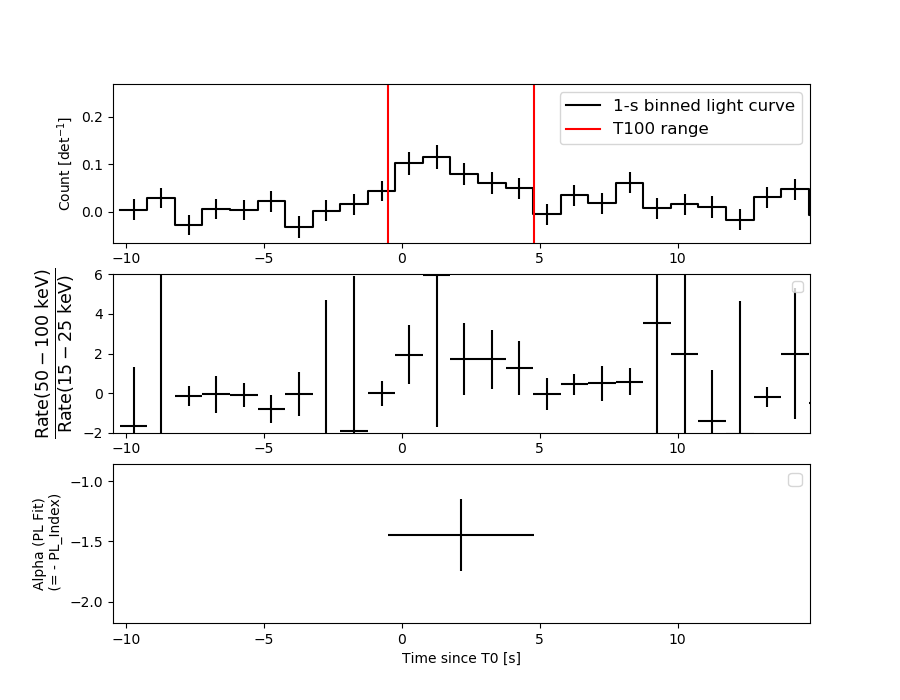
Lightcurves
Notes:
- 1) The mask-weighted light curves are using the flight position.
- 2) Multiple plots of different time binning/intervals are shown to cover all scenarios of short/long GRBs, rate/image triggers, and real/false positives.
- 3) For all the mask-weighted lightcurves, the y-axis units are counts/sec/det where a det is 0.4 x 0.4 = 0.16 sq cm.
- 4) The verticle lines correspond to following: green dotted lines are T50 interval, black dotted lines are T90 interval, blue solid line(s) is a spacecraft slew start time, and orange solid line(s) is a spacecraft slew end time.
- 5) Time of each bin is in the middle of the bin.
1 s binning
From T0-310 s to T0+310 s
From T100_start - 20 s to T100_end + 30 s
Full time interval
64 ms binning
Full time interval

From T100_start to T100_end

From T0-5 sec to T0+5 sec

16 ms binning
From T100_start-5 s to T100_start+5 s
Blue+Cyan dotted lines: Time interval of the scaled map
From 0.000000 to 2.048000
8 ms binning
From T100_start-3 s to T100_start+3 s
Blue+Cyan dotted lines: Time interval of the scaled map
From 0.000000 to 2.048000
2 ms binning
From T100_start-1 s to T100_start+1 s
Blue+Cyan dotted lines: Time interval of the scaled map
From 0.000000 to 2.048000
SN=5 or 10 sec. binning (whichever binning is satisfied first)
SN=5 or 10 sec. binning (T < 200 sec)

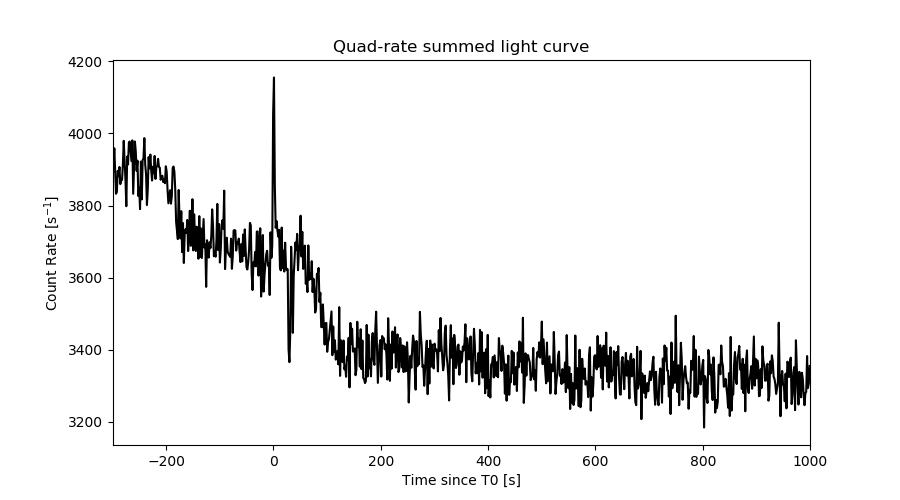
Quad-rate summed light curves (from T0-300s to T0+1000s)
Spectral Evolution
Spectra
Notes:
- 1) The fitting includes the systematic errors.
- 2) When the burst includes telescope slew time periods, the fitting uses an average response file made from multiple 5-s response files through out the slew time plus single time preiod for the non-slew times, and weighted by the total counts in the corresponding time period using addrmf. An average response file is needed becuase a spectral fit using the pre-slew DRM will introduce some errors in both a spectral shape and a normalization if the PHA file contains a lot of the slew/post-slew time interval.
- 3) For fits to more complicated models (e.g. a power-law over a cutoff power-law), the BAT team has decided to require a chi-square improvement of more than 6 for each extra dof.
Time averaged spectrum fit using the average DRM
Power-law model

Time interval is from   -0.504 sec. to    4.808 sec.

Spectral model in power-law:
------------------------------------------------------------
Parameters  : value       lower 90%   higher 90%
Photon index: 1.44601     ( -0.298578   0.29592 )
Norm@50keV  : 6.47195E-03    ( -0.00112655   0.00112635 )
------------------------------------------------------------
#Fit statistic  : Chi-Squared                   60.88     using 59 bins.
 Reduced chi-squared = 1.06807
# Null hypothesis probability of 3.38e-01 with 57 degrees of freedom

Photon flux (15-150 keV)    in 5.312 sec: 0.796807 ( -0.148234  0.149496 ) ph/cm2/s
Energy fluence (15-150 keV)             : 3.29267e-07 ( -6.02014e-08  6.05026e-08 ) ergs/cm2
Cutoff power-law model
Time interval is from   -0.504 sec. to    4.808 sec.
Spectral model in the cutoff power-law:
------------------------------------------------------------
Parameters  : value       lower 90%   higher 90%
Photon index: 0.661499     ( -1.68171   1.00074 )
Epeak [keV] : 93.7694      ( -37.3984 -93.744 )
Norm@50keV  : 1.49569E-02    ( -0.00932545   0.0659143 )
------------------------------------------------------------
#Fit statistic  : Chi-Squared                   59.77     using 59 bins.
 Reduced chi-squared = 1.06732
# Null hypothesis probability of 3.40e-01 with 56 degrees of freedom

Photon flux (15-150 keV)    in 5.312 sec: 0.766862 ( -0.157489  0.157407 ) ph/cm2/s
Energy fluence (15-150 keV)             : 3.18228e-07 ( -6.354e-08  6.34513e-08 ) ergs/cm2
Band function

Time interval is from   -0.504 sec. to    4.808 sec.


Spectral model in the Band function:
------------------------------------------------------------
Parameters  : value       lower 90%   higher 90%
alpha       :    (     )
beta        :     (     )
Epeak [keV] :       (   )
Norm@50keV   :     (     )
------------------------------------------------------------

Photon flux (15-150 keV)    in  sec:  (    ) ph/cm2/s
Energy fluence (15-150 keV)             : 0 ( 0  0 ) ergs/cm2
Single BB
Spectral model blackbody:
------------------------------------------------------------
Parameters  : value    Lower 90%  Upper 90%
kT [keV]    : 17.4608  (-3.1259  4.00438)
R^2/D10^2   : 5.53225E-02  (-0.0288264   0.0558617)
(R is the radius in km and D10 is the distance to the source in units of 10 kpc)
------------------------------------------------------------
#Fit statistic  : Chi-Squared                   63.63     using 59 bins.
 Reduced chi-squared =
# Null hypothesis probability of 2.54e-01 with 57 degrees of freedom

Energy  Fluence     90% Error
[keV]   [erg/cm2]   [erg/cm2]
15- 25  1.811e-08   6.305e-09
25- 50  8.183e-08   2.659e-08
50-150  1.796e-07   6.088e-08
15-150  2.795e-07   7.524e-08
Thermal bremsstrahlung (OTTB)

Spectral model: thermal bremsstrahlung
------------------------------------------------------------
Parameters  : value         Lower 90%    Upper 90%
kT [keV]    : 199.363       (-84.8217      -199.363)
Norm        : 3.33122       (-0.579324     0.579398)
------------------------------------------------------------
#Fit statistic  : Chi-Squared                   60.74     using 59 bins.
 Reduced chi-squared =
# Null hypothesis probability of 3.43e-01 with 57 degrees of freedom

Energy  Fluence     90% Error
[keV]   [erg/cm2]   [erg/cm2]
15- 25  4.406e-08   2.561e-08
25- 50  8.476e-08   4.762e-08
50-150  1.859e-07   1.064e-07
15-150  3.147e-07   1.790e-07
Double BB
Spectral model: bbodyrad<1> + bbodyrad<2>
------------------------------------------------------------
Parameters  : value         Lower 90%    Upper 90%
kT1 [keV]   : 4.78471        (-4.4097      10.4621)
R1^2/D10^2  : 2.44101        (-2.31349      -2.38428)
kT2 [keV]   : 20.6484        (-4.95194      -20.6801)
R2^2/D10^2  : 2.80304E-02    (-0.0274992   0.0368429)
------------------------------------------------------------
#Fit statistic  : Chi-Squared                   59.50     using 59 bins.
 Reduced chi-squared =
# Null hypothesis probability of 3.15e-01 with 55 degrees of freedom

Energy  Fluence     90% Error
[keV]   [erg/cm2]   [erg/cm2]
15- 25  3.843e-08   2.134e-08
25- 50  7.685e-08   4.065e-08
50-150  1.954e-07   1.130e-07
15-150  3.107e-07   1.553e-07
Peak spectrum fit
Power-law model

Time interval is from    0.332 sec. to    1.332 sec.

Spectral model in power-law:
------------------------------------------------------------
Parameters  : value       lower 90%   higher 90%
Photon index: 0.987246     ( -0.584695   0.498225 )
Norm@50keV  : 9.66727E-03    ( -0.00303335   0.00281126 )
------------------------------------------------------------
#Fit statistic  : Chi-Squared                   42.73     using 59 bins.
 Reduced chi-squared = 0.749649
# Null hypothesis probability of 9.20e-01 with 57 degrees of freedom

Photon flux (15-150 keV)    in 1 sec: 1.11227 ( -0.338016  0.34935 ) ph/cm2/s
Energy fluence (15-150 keV)             : 1.05024e-07 ( -2.78324e-08  2.78745e-08 ) ergs/cm2
Cutoff power-law model
Time interval is from    0.332 sec. to    1.332 sec.
Spectral model in the cutoff power-law:
------------------------------------------------------------
Parameters  : value       lower 90%   higher 90%
Photon index: 0.980778     ( -2.68747   -0.914471 )
Epeak [keV] : 1.00000E+04      ( -10000 -10000 )
Norm@50keV  : 9.72449E-03    ( -0.00304188   -0.00972494 )
------------------------------------------------------------
#Fit statistic  : Chi-Squared                   42.73     using 59 bins.
 Reduced chi-squared = 0.763036
# Null hypothesis probability of 9.04e-01 with 56 degrees of freedom

Photon flux (15-150 keV)    in 1 sec: 1.11198 ( -0.3376  0.3494 ) ph/cm2/s
Energy fluence (15-150 keV)             : 1.05264e-07 ( -2.89911e-08  2.84694e-08 ) ergs/cm2
Band function

Time interval is from    0.332 sec. to    1.332 sec.


Spectral model in the Band function:
------------------------------------------------------------
Parameters  : value       lower 90%   higher 90%
alpha       :    (     )
beta        :     (     )
Epeak [keV] :       (   )
Norm@50keV   :     (     )
------------------------------------------------------------

Photon flux (15-150 keV)    in  sec:  (    ) ph/cm2/s
Energy fluence (15-150 keV)             : 0 ( 0  0 ) ergs/cm2
Single BB

Spectral model blackbody:
------------------------------------------------------------
Parameters  : value    Lower 90%  Upper 90%
kT [keV]    : 25.5402  (-7.6131  16.1753)
R^2/D10^2   : 2.45404E-02  (-0.0245223   0.0537569)
(R is the radius in km and D10 is the distance to the source in units of 10 kpc)
------------------------------------------------------------
#Fit statistic  : Chi-Squared                   45.03     using 59 bins.
 Reduced chi-squared =
# Null hypothesis probability of 8.74e-01 with 57 degrees of freedom

Energy  Fluence     90% Error
[keV]   [erg/cm2]   [erg/cm2]
15- 25  2.749e-09   1.752e-09
25- 50  1.577e-08   9.605e-09
50-150  7.600e-08   4.551e-08
15-150  9.452e-08   5.547e-08
Thermal bremsstrahlung (OTTB)

Spectral model: thermal bremsstrahlung
------------------------------------------------------------
Parameters  : value         Lower 90%    Upper 90%
kT [keV]    : 200.000       (-79.8294      -200)
Norm        : 4.98720       (-1.38009     1.38009)
------------------------------------------------------------
#Fit statistic  : Chi-Squared                   46.87     using 59 bins.
 Reduced chi-squared =
# Null hypothesis probability of 8.29e-01 with 57 degrees of freedom

Energy  Fluence     90% Error
[keV]   [erg/cm2]   [erg/cm2]
15- 25  1.243e-08   7.405e-09
25- 50  2.391e-08   1.443e-08
50-150  5.245e-08   3.055e-08
15-150  8.880e-08   5.300e-08
Double BB
Spectral model: bbodyrad<1> + bbodyrad<2>
------------------------------------------------------------
Parameters  : value         Lower 90%    Upper 90%
kT1 [keV]   : 4.10913        (-4.10388      25.7957)
R1^2/D10^2  : 7.71172        (-7.7457      -7.7457)
kT2 [keV]   : 29.6205        (-9.96618      -29.6196)
R2^2/D10^2  : 1.48349E-02    (-0.0148371   0.0412709)
------------------------------------------------------------
#Fit statistic  : Chi-Squared                   42.70     using 59 bins.
 Reduced chi-squared =
# Null hypothesis probability of 8.87e-01 with 55 degrees of freedom

Energy  Fluence     90% Error
[keV]   [erg/cm2]   [erg/cm2]
15- 25  1.003e-08   6.085e-09
25- 50  1.570e-08   8.700e-09
50-150  7.847e-08   4.886e-08
15-150  1.042e-07   5.810e-08
Pre-slew spectrum (Pre-slew PHA with pre-slew DRM)
Power-law model

Spectral model in power-law:
------------------------------------------------------------
Parameters  : value       lower 90%   higher 90%
Photon index: 1.44601     ( -0.298578   0.29592 )
Norm@50keV  : 6.47195E-03    ( -0.00112655   0.00112635 )
------------------------------------------------------------
#Fit statistic  : Chi-Squared                   60.88     using 59 bins.
 Reduced chi-squared =
# Null hypothesis probability of 3.38e-01 with 57 degrees of freedom

Photon flux (15-150 keV)    in 5.312 sec: 0.796789 ( -0.148229  0.149481 ) ph/cm2/s
Energy fluence (15-150 keV)             : 3.29226e-07 ( -6.01913e-08  6.05435e-08 ) ergs/cm2
Cutoff power-law model

Spectral model in the cutoff power-law:
------------------------------------------------------------
Parameters  : value       lower 90%   higher 90%
Photon index: 0.660792     ( -1.6816   0.928222 )
Epeak [keV] : 93.7448      ( -93.7433 -93.7433 )
Norm@50keV  : 1.49669E-02    ( -0.00932538   0.0659197 )
------------------------------------------------------------
#Fit statistic  : Chi-Squared                   59.77     using 59 bins.
 Reduced chi-squared =
# Null hypothesis probability of 3.40e-01 with 56 degrees of freedom

Photon flux (15-150 keV)    in 5.312 sec: 0.766796 ( -0.157449  0.15736 ) ph/cm2/s
Energy fluence (15-150 keV)             : 3.18351e-07 ( -6.35618e-08  6.35453e-08 ) ergs/cm2
Band function
Spectral model in the Band function:
------------------------------------------------------------
Parameters  : value       lower 90%   higher 90%
alpha       :    (     )
beta        :     (     )
Epeak [keV] :       (   )
Norm@50keV   :     (     )
------------------------------------------------------------

Photon flux (15-150 keV)    in  sec:  (    ) ph/cm2/s
Energy fluence (15-150 keV)             : 0 ( 0  0 ) ergs/cm2
S(25-50 keV) vs. S(50-100 keV) plot

S(25-50 keV)  = 7.91e-08
S(50-100 keV) = 1.16e-07
T90 vs. Hardness ratio plot

T90                                   = 4.72000014781952 sec.
Hardness ratio (energy fluence ratio) = 1.4665
Color vs. Color plot
Count Ratio  (25-50 keV) / (15-25 keV) = 1.92701
Count Ratio (50-100 keV) / (15-25 keV) = 1.85599
Mask shadow pattern
IMX = 1.036670064867644E+00, IMY = 1.262367500860944E-01
TIME vs. PHA plot around the trigger time

Blue+Cyan dotted lines: Time interval of the scaled map
From 0.000000 to 2.048000
TIME vs. DetID plot around the trigger time
Blue+Cyan dotted lines: Time interval of the scaled map
From 0.000000 to 2.048000
100 us light curve (15-350 keV)
Blue+Cyan dotted lines: Time interval of the scaled map
From 0.000000 to 2.048000
Spacecraft aspect plot
Bright source in the pre-burst/pre-slew/post-slew images
Pre-burst image of 15-350 keV band
Time interval of the image:
-239.240000 -0.504000

# RAcent  DECcent POSerr Theta    Phi  PeakCts   SNR AngSep     Name
#  [deg]    [deg]    ['] [deg]  [deg]                   [']
135.5421 -40.5605    1.8  13.7  -77.5   2.7269   6.4    0.7	Vela X-1
170.1455 -60.7441   11.2  15.8   87.1  -0.4957  -1.0    8.8	Cen X-3
186.6551 -62.7805    0.7  23.9   87.5   9.4108  16.0    0.6	GX 301-2
202.0346 -57.2014    3.4  32.0   77.2   2.9582   3.5 ------	UNKNOWN
127.7390 -41.6860    3.4  16.0  -99.0   1.3881   3.4 ------	UNKNOWN
133.4035  -9.1287    2.8  44.4  -61.2   9.2974   4.2 ------	UNKNOWN
131.5088 -10.1431    4.6  43.8  -64.1   5.5151   2.5 ------	UNKNOWN
Pre-slew background subtracted image of 15-350 keV band
Time interval of the image:
-0.504000 4.808000

# RAcent  DECcent POSerr Theta    Phi  PeakCts   SNR AngSep     Name
#  [deg]    [deg]    ['] [deg]  [deg]                   [']
135.3595 -40.5236   28.2  13.8  -77.9  -0.0124  -0.4    7.9	Vela X-1
170.4821 -60.8149    0.0  16.0   87.1  -0.0695  -2.0   12.5	Cen X-3
187.0234 -62.6577    0.0  24.0   87.2   0.0526   1.3   12.1	GX 301-2
171.8515 -11.4292    1.4  46.2   -6.9   0.5041   8.5 ------	UNKNOWN
 72.7258 -48.6002    2.2  44.3 -159.7   0.2813   5.2 ------	UNKNOWN
Post-slew image of 15-350 keV band
Time interval of the image:
138.060600 151.460600

# RAcent  DECcent POSerr Theta    Phi  PeakCts   SNR AngSep     Name
#  [deg]    [deg]    ['] [deg]  [deg]                   [']
135.4956 -40.3477    0.0  53.9 -161.4  -0.4995  -3.3   12.5	Vela X-1
183.3917 -10.1798    2.1  14.5  122.1   0.2641   5.5 ------	UNKNOWN
148.7759 -26.2210    2.5  36.2 -157.2   0.3010   4.6 ------	UNKNOWN
127.5304 -18.1262    2.1  49.3 -132.2   1.1940   5.6 ------	UNKNOWN
Plot creation:
Sat Sep 30 00:47:27 EDT 2023