Special notes of this burst
Image
Pre-slew 15.0-350.0 keV image (Event data)
#   RAcent    DECcent   POSerr    Theta     Phi              Peak Cts       SNR   Name
  250.3903    -5.3194   0.0064    44.6764   -21.3511         2.8187548     30.135 TRIG_01180410

Foreground time interval of the image:
 -0.216   7.936 (delta_t =   8.152 [sec])
Background time interval of the image:
-239.576  -0.216 (delta_t = 239.360 [sec])
Lightcurves
Notes:
- 1) The mask-weighted light curves are using the flight position.
- 2) Multiple plots of different time binning/intervals are shown to cover all scenarios of short/long GRBs, rate/image triggers, and real/false positives.
- 3) For all the mask-weighted lightcurves, the y-axis units are counts/sec/det where a det is 0.4 x 0.4 = 0.16 sq cm.
- 4) The verticle lines correspond to following: green dotted lines are T50 interval, black dotted lines are T90 interval, blue solid line(s) is a spacecraft slew start time, and orange solid line(s) is a spacecraft slew end time.
- 5) Time of each bin is in the middle of the bin.
1 s binning
From T0-310 s to T0+310 s
From T100_start - 20 s to T100_end + 30 s
Full time interval

64 ms binning
Full time interval
From T100_start to T100_end
From T0-5 sec to T0+5 sec

16 ms binning
From T100_start-5 s to T100_start+5 s
Blue+Cyan dotted lines: Time interval of the scaled map
From 0.000000 to 0.512000
8 ms binning
From T100_start-3 s to T100_start+3 s

Blue+Cyan dotted lines: Time interval of the scaled map
From 0.000000 to 0.512000
2 ms binning
From T100_start-1 s to T100_start+1 s
Blue+Cyan dotted lines: Time interval of the scaled map
From 0.000000 to 0.512000
SN=5 or 10 sec. binning (whichever binning is satisfied first)

SN=5 or 10 sec. binning (T < 200 sec)
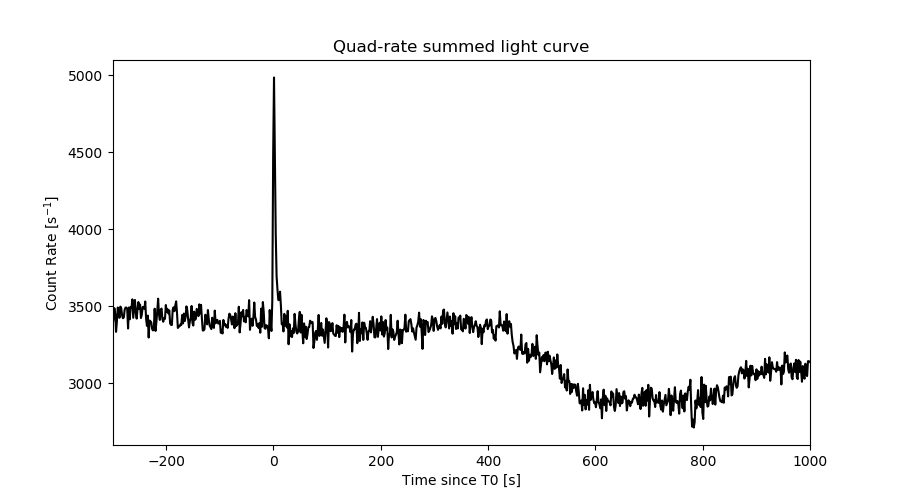
Quad-rate summed light curves (from T0-300s to T0+1000s)
Spectral Evolution

Spectra
Notes:
- 1) The fitting includes the systematic errors.
- 2) When the burst includes telescope slew time periods, the fitting uses an average response file made from multiple 5-s response files through out the slew time plus single time preiod for the non-slew times, and weighted by the total counts in the corresponding time period using addrmf. An average response file is needed becuase a spectral fit using the pre-slew DRM will introduce some errors in both a spectral shape and a normalization if the PHA file contains a lot of the slew/post-slew time interval.
- 3) For fits to more complicated models (e.g. a power-law over a cutoff power-law), the BAT team has decided to require a chi-square improvement of more than 6 for each extra dof.
Time averaged spectrum fit using the average DRM
Power-law model

Time interval is from   -0.216 sec. to    7.936 sec.

Spectral model in power-law:
------------------------------------------------------------
Parameters  : value       lower 90%   higher 90%
Photon index: 1.80652     ( -0.091441   0.0926036 )
Norm@50keV  : 2.27983E-02    ( -0.0012568   0.00125303 )
------------------------------------------------------------
#Fit statistic  : Chi-Squared                   58.29     using 59 bins.
 Reduced chi-squared = 1.02263
# Null hypothesis probability of 4.28e-01 with 57 degrees of freedom

Photon flux (15-150 keV)    in 8.152 sec: 3.14970 ( -0.18106  0.18168 ) ph/cm2/s
Energy fluence (15-150 keV)             : 1.71086e-06 ( -9.54452e-08  9.56654e-08 ) ergs/cm2
Cutoff power-law model
Time interval is from   -0.216 sec. to    7.936 sec.
Spectral model in the cutoff power-law:
------------------------------------------------------------
Parameters  : value       lower 90%   higher 90%
Photon index: 1.06206     ( -0.447159   0.408281 )
Epeak [keV] : 63.9075      ( -8.72115 19.2608 )
Norm@50keV  : 5.34469E-02    ( -0.0196012   0.0349084 )
------------------------------------------------------------
#Fit statistic  : Chi-Squared                   47.98     using 59 bins.
 Reduced chi-squared = 0.856786
# Null hypothesis probability of 7.68e-01 with 56 degrees of freedom

Photon flux (15-150 keV)    in 8.152 sec: 3.02626 ( -0.19139  0.19221 ) ph/cm2/s
Energy fluence (15-150 keV)             : 1.64329e-06 ( -1.02956e-07  1.02952e-07 ) ergs/cm2
Band function

Time interval is from   -0.216 sec. to    7.936 sec.


Spectral model in the Band function:
------------------------------------------------------------
Parameters  : value       lower 90%   higher 90%
alpha       :    (     )
beta        :     (     )
Epeak [keV] :       (   )
Norm@50keV   :     (     )
------------------------------------------------------------

Photon flux (15-150 keV)    in  sec:  (    ) ph/cm2/s
Energy fluence (15-150 keV)             : 0 ( 0  0 ) ergs/cm2
Single BB
Spectral model blackbody:
------------------------------------------------------------
Parameters  : value    Lower 90%  Upper 90%
kT [keV]    : 13.5607  (-0.810989  0.859197)
R^2/D10^2   : 0.482610  (-0.100439   0.126424)
(R is the radius in km and D10 is the distance to the source in units of 10 kpc)
------------------------------------------------------------
#Fit statistic  : Chi-Squared                  106.47     using 59 bins.
 Reduced chi-squared =
# Null hypothesis probability of 7.81e-05 with 57 degrees of freedom

Energy  Fluence     90% Error
[keV]   [erg/cm2]   [erg/cm2]
15- 25  1.532e-07   1.516e-08
25- 50  5.517e-07   3.497e-08
50-150  6.569e-07   6.791e-08
15-150  1.362e-06   7.541e-08
Thermal bremsstrahlung (OTTB)
Spectral model: thermal bremsstrahlung
------------------------------------------------------------
Parameters  : value         Lower 90%    Upper 90%
kT [keV]    : 113.323       (-21.9026      23.753)
Norm        : 13.3217       (-0.938406     1.2436)
------------------------------------------------------------
#Fit statistic  : Chi-Squared                   49.00     using 59 bins.
 Reduced chi-squared =
# Null hypothesis probability of 7.65e-01 with 57 degrees of freedom

Energy  Fluence     90% Error
[keV]   [erg/cm2]   [erg/cm2]
15- 25  2.834e-07   2.580e-08
25- 50  5.019e-07   2.898e-08
50-150  8.702e-07   2.368e-07
15-150  1.656e-06   2.515e-07
Double BB

Spectral model: bbodyrad<1> + bbodyrad<2>
------------------------------------------------------------
Parameters  : value         Lower 90%    Upper 90%
kT1 [keV]   : 6.88601        (-1.51947      1.72244)
R1^2/D10^2  : 3.45411        (-1.72617      4.84666)
kT2 [keV]   : 20.9484        (-3.20323      5.85492)
R2^2/D10^2  : 6.98955E-02    (-0.0456023   0.0543379)
------------------------------------------------------------
#Fit statistic  : Chi-Squared                   50.84     using 59 bins.
 Reduced chi-squared =
# Null hypothesis probability of 6.34e-01 with 55 degrees of freedom

Energy  Fluence     90% Error
[keV]   [erg/cm2]   [erg/cm2]
15- 25  2.581e-07   6.179e-08
25- 50  5.223e-07   1.127e-07
50-150  8.373e-07   2.098e-07
15-150  1.618e-06   3.102e-07
Peak spectrum fit
Power-law model

Time interval is from    1.636 sec. to    2.636 sec.

Spectral model in power-law:
------------------------------------------------------------
Parameters  : value       lower 90%   higher 90%
Photon index: 1.86106     ( -0.143873   0.149026 )
Norm@50keV  : 3.88250E-02    ( -0.00388363   0.00385805 )
------------------------------------------------------------
#Fit statistic  : Chi-Squared                   68.54     using 59 bins.
 Reduced chi-squared = 1.20246
# Null hypothesis probability of 1.41e-01 with 57 degrees of freedom

Photon flux (15-150 keV)    in 1 sec: 5.48232 ( -0.54253  0.54395 ) ph/cm2/s
Energy fluence (15-150 keV)             : 3.57001e-07 ( -3.56645e-08  3.57524e-08 ) ergs/cm2
Cutoff power-law model

Time interval is from    1.636 sec. to    2.636 sec.
Spectral model in the cutoff power-law:
------------------------------------------------------------
Parameters  : value       lower 90%   higher 90%
Photon index: 0.226801     ( -0.982822   0.781635 )
Epeak [keV] : 53.7711      ( -6.67283 9.8958 )
Norm@50keV  : 0.265552    ( -0.15865   0.593599 )
------------------------------------------------------------
#Fit statistic  : Chi-Squared                   53.32     using 59 bins.
 Reduced chi-squared = 0.952143
# Null hypothesis probability of 5.77e-01 with 56 degrees of freedom

Photon flux (15-150 keV)    in 1 sec: 5.22752 ( -0.55235  0.55465 ) ph/cm2/s
Energy fluence (15-150 keV)             : 3.40706e-07 ( -3.76869e-08  3.77366e-08 ) ergs/cm2
Band function

Time interval is from    1.636 sec. to    2.636 sec.


Spectral model in the Band function:
------------------------------------------------------------
Parameters  : value       lower 90%   higher 90%
alpha       :    (     )
beta        :     (     )
Epeak [keV] :       (   )
Norm@50keV   :     (     )
------------------------------------------------------------

Photon flux (15-150 keV)    in  sec:  (    ) ph/cm2/s
Energy fluence (15-150 keV)             : 0 ( 0  0 ) ergs/cm2
Single BB

Spectral model blackbody:
------------------------------------------------------------
Parameters  : value    Lower 90%  Upper 90%
kT [keV]    : 12.6836  (-1.11701  1.24418)
R^2/D10^2   : 1.15917  (-0.350525   0.484554)
(R is the radius in km and D10 is the distance to the source in units of 10 kpc)
------------------------------------------------------------
#Fit statistic  : Chi-Squared                   60.97     using 59 bins.
 Reduced chi-squared =
# Null hypothesis probability of 3.35e-01 with 57 degrees of freedom

Energy  Fluence     90% Error
[keV]   [erg/cm2]   [erg/cm2]
15- 25  3.955e-08   6.835e-09
25- 50  1.326e-07   1.505e-08
50-150  1.329e-07   2.510e-08
15-150  3.050e-07   3.255e-08
Thermal bremsstrahlung (OTTB)

Spectral model: thermal bremsstrahlung
------------------------------------------------------------
Parameters  : value         Lower 90%    Upper 90%
kT [keV]    : 93.8467       (-21.7053      33.3252)
Norm        : 25.1555       (-3.17962     3.58521)
------------------------------------------------------------
#Fit statistic  : Chi-Squared                   58.79     using 59 bins.
 Reduced chi-squared =
# Null hypothesis probability of 4.10e-01 with 57 degrees of freedom

Energy  Fluence     90% Error
[keV]   [erg/cm2]   [erg/cm2]
15- 25  6.571e-08   9.495e-09
25- 50  1.121e-07   1.230e-08
50-150  1.751e-07   6.310e-08
15-150  3.530e-07   6.670e-08
Double BB

Spectral model: bbodyrad<1> + bbodyrad<2>
------------------------------------------------------------
Parameters  : value         Lower 90%    Upper 90%
kT1 [keV]   : 1.16589        (-0.946923      1.78162)
R1^2/D10^2  : 5.08250E+05        (-423131      -423231)
kT2 [keV]   : 13.0902        (-1.20032      1.42642)
R2^2/D10^2  : 1.00997    (-0.337947   0.451019)
------------------------------------------------------------
#Fit statistic  : Chi-Squared                   53.55     using 59 bins.
 Reduced chi-squared =
# Null hypothesis probability of 5.30e-01 with 55 degrees of freedom

Energy  Fluence     90% Error
[keV]   [erg/cm2]   [erg/cm2]
15- 25  5.132e-08   1.237e-08
25- 50  1.258e-07   1.825e-08
50-150  1.402e-07   2.615e-08
15-150  3.173e-07   3.595e-08
Pre-slew spectrum (Pre-slew PHA with pre-slew DRM)
Power-law model

Spectral model in power-law:
------------------------------------------------------------
Parameters  : value       lower 90%   higher 90%
Photon index: 1.80652     ( -0.091441   0.0926036 )
Norm@50keV  : 2.27983E-02    ( -0.0012568   0.00125303 )
------------------------------------------------------------
#Fit statistic  : Chi-Squared                   58.29     using 59 bins.
 Reduced chi-squared =
# Null hypothesis probability of 4.28e-01 with 57 degrees of freedom

Photon flux (15-150 keV)    in 8.152 sec: 3.14953 ( -0.181043  0.181655 ) ph/cm2/s
Energy fluence (15-150 keV)             : 1.71058e-06 ( -9.54664e-08  9.56564e-08 ) ergs/cm2
Cutoff power-law model

Spectral model in the cutoff power-law:
------------------------------------------------------------
Parameters  : value       lower 90%   higher 90%
Photon index: 1.06206     ( -0.447159   0.408281 )
Epeak [keV] : 63.9075      ( -8.72115 19.2608 )
Norm@50keV  : 5.34469E-02    ( -0.0196012   0.0349084 )
------------------------------------------------------------
#Fit statistic  : Chi-Squared                   47.98     using 59 bins.
 Reduced chi-squared =
# Null hypothesis probability of 7.68e-01 with 56 degrees of freedom

Photon flux (15-150 keV)    in 8.152 sec: 3.02579 ( -0.19129  0.19214 ) ph/cm2/s
Energy fluence (15-150 keV)             : 1.6438e-06 ( -1.03017e-07  1.02854e-07 ) ergs/cm2
Band function
Spectral model in the Band function:
------------------------------------------------------------
Parameters  : value       lower 90%   higher 90%
alpha       :    (     )
beta        :     (     )
Epeak [keV] :       (   )
Norm@50keV   :     (     )
------------------------------------------------------------

Photon flux (15-150 keV)    in  sec:  (    ) ph/cm2/s
Energy fluence (15-150 keV)             : 0 ( 0  0 ) ergs/cm2
S(25-50 keV) vs. S(50-100 keV) plot

S(25-50 keV)  = 4.83e-07
S(50-100 keV) = 5.52e-07
T90 vs. Hardness ratio plot
T90                                   = 5.75599992275238 sec.
Hardness ratio (energy fluence ratio) = 1.14286
Color vs. Color plot
Count Ratio  (25-50 keV) / (15-25 keV) = 1.52225
Count Ratio (50-100 keV) / (15-25 keV) = 0.972817
Mask shadow pattern
IMX = 9.209038686364036E-01, IMY = 3.599928070229617E-01
TIME vs. PHA plot around the trigger time

Blue+Cyan dotted lines: Time interval of the scaled map
From 0.000000 to 0.512000
TIME vs. DetID plot around the trigger time

Blue+Cyan dotted lines: Time interval of the scaled map
From 0.000000 to 0.512000
100 us light curve (15-350 keV)

Blue+Cyan dotted lines: Time interval of the scaled map
From 0.000000 to 0.512000
Spacecraft aspect plot
Bright source in the pre-burst/pre-slew/post-slew images
Pre-burst image of 15-350 keV band
Time interval of the image:
-239.576000 -0.216000

# RAcent  DECcent POSerr Theta    Phi  PeakCts   SNR AngSep     Name
#  [deg]    [deg]    ['] [deg]  [deg]                   [']
244.9875 -15.6341    0.4  40.9  -37.5  24.9596  26.5    0.6	Sco X-1
255.8390 -38.0189    0.0  22.2  -68.8   0.5193   0.7   12.6	4U 1700-377
256.4505 -36.4652    4.9  21.9  -64.5   1.5163   2.3    2.6	GX 349+2
262.9512 -24.9236   31.5  22.1  -29.8   0.1906   0.4   11.1	GX 1+4
264.7525 -44.5991   10.5  15.9  -90.7   0.6153   1.1    9.0	4U 1735-44
268.4411  -1.4217    9.1  39.2    5.2   0.9006   1.3    4.8	SW J1753.5-0127
270.3075 -25.1094    4.2  17.3  -16.0   1.3913   2.8    2.2	GX 5-1
270.3399 -25.5650    5.6  16.9  -16.9   1.0559   2.1   10.9	GRS 1758-258
274.1034 -13.9614    4.2  25.5    7.5   1.6146   2.7    7.2	GX 17+2
275.7188 -30.3371    8.0  10.2  -14.5   0.7224   1.4   10.8	H1820-303
285.0774 -24.7342  249.0  13.2   34.5  -0.0225  -0.0   11.4	HT1900.1-2455
288.7772  10.7940    0.0  48.9   36.5  -1.5782  -1.1    9.2	GRS 1915+105
262.9437 -33.8518    3.7  17.5  -52.8   1.8095   3.2    2.5	GX 354-0
325.2034 -19.9182    2.7  39.8  105.3   6.6723   4.3 ------	UNKNOWN
307.8410 -13.4907    3.5  32.3   77.6   3.2390   3.3 ------	UNKNOWN
310.3498 -16.3596    2.9  31.6   84.6   3.6718   3.9 ------	UNKNOWN
329.5471 -42.6233    2.5  34.6  142.9   3.8698   4.7 ------	UNKNOWN
  1.2526 -58.1947    2.2  52.1  169.7   8.2054   5.2 ------	UNKNOWN
 11.6439 -86.8568    2.6  52.0 -153.6   6.4828   4.4 ------	UNKNOWN
Pre-slew background subtracted image of 15-350 keV band
Time interval of the image:
-0.216000 7.936000

# RAcent  DECcent POSerr Theta    Phi  PeakCts   SNR AngSep     Name
#  [deg]    [deg]    ['] [deg]  [deg]                   [']
245.1089 -15.5841   15.0  40.9  -37.4   0.0699   0.8    8.2	Sco X-1
255.9531 -37.7058    5.5  22.1  -67.9  -0.1197  -2.1    8.4	4U 1700-377
256.2931 -36.6001    0.0  22.0  -64.9   0.0951   1.6   12.6	GX 349+2
263.1955 -24.8121    4.6  22.0  -29.2  -0.1327  -2.5   10.9	GX 1+4
264.8636 -44.5741   24.3  15.8  -90.7   0.0262   0.5    9.1	4U 1735-44
268.4296  -1.3141    4.6  39.3    5.2  -0.2155  -2.5    9.1	SW J1753.5-0127
270.3329 -25.2230   17.2  17.2  -16.2   0.0346   0.7    9.0	GX 5-1
270.2186 -25.9393    0.0  16.7  -18.0   0.1329   2.6   12.6	GRS 1758-258
273.9191 -14.0852   10.4  25.4    7.0  -0.0654  -1.1    5.8	GX 17+2
275.8353 -30.5482    7.0  10.0  -14.8   0.0854   1.7   11.8	H1820-303
284.9948 -24.8501    4.2  13.1   34.2  -0.1407  -2.7    4.8	HT1900.1-2455
288.8259  10.9649   74.5  49.1   36.6  -0.0357  -0.2    2.0	GRS 1915+105
262.7997 -33.8229   19.5  17.6  -52.8   0.0328   0.6    9.5	GX 354-0
347.2320 -50.3460    2.5  45.6  157.5   0.5026   4.6 ------	UNKNOWN
346.6344 -51.7342    2.3  45.0  159.3   0.5467   5.0 ------	UNKNOWN
250.3903  -5.3194    0.4  44.7  -21.4   2.8185  30.1 ------	UNKNOWN
Post-slew image of 15-350 keV band
Time interval of the image:
Plot creation:
Fri Oct  6 19:00:58 EDT 2023