Estimated redshift from machine learning (Ukwatta et al. 2016) - may take a few minute to calcaulte
Image
Pre-slew 15.0-350.0 keV image (Event data)
#   RAcent    DECcent   POSerr    Theta     Phi              Peak Cts       SNR   Name
   76.2239    19.5514   0.0042    11.1193   147.8299         3.5366966     46.122 TRIG_01182085

Foreground time interval of the image:
 -6.040  11.581 (delta_t =  17.621 [sec])
Background time interval of the image:
-37.419  -6.040 (delta_t =  31.379 [sec])
Lightcurves
Notes:
- 1) The mask-weighted light curves are using the flight position.
- 2) Multiple plots of different time binning/intervals are shown to cover all scenarios of short/long GRBs, rate/image triggers, and real/false positives.
- 3) For all the mask-weighted lightcurves, the y-axis units are counts/sec/det where a det is 0.4 x 0.4 = 0.16 sq cm.
- 4) The verticle lines correspond to following: green dotted lines are T50 interval, black dotted lines are T90 interval, blue solid line(s) is a spacecraft slew start time, and orange solid line(s) is a spacecraft slew end time.
- 5) Time of each bin is in the middle of the bin.
1 s binning
From T0-310 s to T0+310 s
From T100_start - 20 s to T100_end + 30 s
Full time interval

64 ms binning
Full time interval
From T100_start to T100_end
From T0-5 sec to T0+5 sec
16 ms binning
From T100_start-5 s to T100_start+5 s
Blue+Cyan dotted lines: Time interval of the scaled map
From 0.000000 to 1.024000
8 ms binning
From T100_start-3 s to T100_start+3 s

Blue+Cyan dotted lines: Time interval of the scaled map
From 0.000000 to 1.024000
2 ms binning
From T100_start-1 s to T100_start+1 s
Blue+Cyan dotted lines: Time interval of the scaled map
From 0.000000 to 1.024000
SN=5 or 10 sec. binning (whichever binning is satisfied first)
SN=5 or 10 sec. binning (T < 200 sec)
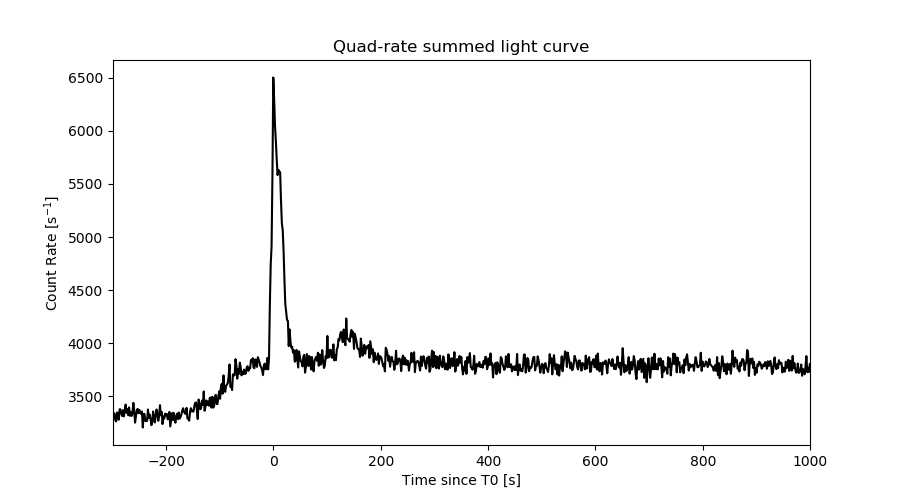
Quad-rate summed light curves (from T0-300s to T0+1000s)
Spectral Evolution

Spectra
Notes:
- 1) The fitting includes the systematic errors.
- 2) When the burst includes telescope slew time periods, the fitting uses an average response file made from multiple 5-s response files through out the slew time plus single time preiod for the non-slew times, and weighted by the total counts in the corresponding time period using addrmf. An average response file is needed becuase a spectral fit using the pre-slew DRM will introduce some errors in both a spectral shape and a normalization if the PHA file contains a lot of the slew/post-slew time interval.
- 3) For fits to more complicated models (e.g. a power-law over a cutoff power-law), the BAT team has decided to require a chi-square improvement of more than 6 for each extra dof.
Time averaged spectrum fit using the average DRM
Power-law model
Time interval is from   -6.040 sec. to  230.344 sec.

Spectral model in power-law:
------------------------------------------------------------
Parameters  : value       lower 90%   higher 90%
Photon index: 1.61202     ( -0.0716393   0.0719884 )
Norm@50keV  : 2.22647E-03    ( -8.7581e-05   8.74147e-05 )
------------------------------------------------------------
#Fit statistic  : Chi-Squared                   66.27     using 59 bins.
 Reduced chi-squared = 1.16263
# Null hypothesis probability of 1.87e-01 with 57 degrees of freedom

Photon flux (15-150 keV)    in 236.4 sec: 0.287197 ( -0.011668  0.011695 ) ph/cm2/s
Energy fluence (15-150 keV)             : 4.91596e-06 ( -2.0589e-07  2.06721e-07 ) ergs/cm2
Cutoff power-law model
Time interval is from   -6.040 sec. to  230.344 sec.
Spectral model in the cutoff power-law:
------------------------------------------------------------
Parameters  : value       lower 90%   higher 90%
Photon index: 1.27392     ( -0.310759   0.289469 )
Epeak [keV] : 108.272      ( -29.6525 283.352 )
Norm@50keV  : 3.27417E-03    ( -0.000900936   0.00135799 )
------------------------------------------------------------
#Fit statistic  : Chi-Squared                   62.27     using 59 bins.
 Reduced chi-squared = 1.11196
# Null hypothesis probability of 2.63e-01 with 56 degrees of freedom

Photon flux (15-150 keV)    in 236.4 sec: 0.280985 ( -0.012749  0.012775 ) ph/cm2/s
Energy fluence (15-150 keV)             : 4.77779e-06 ( -2.37979e-07  2.37173e-07 ) ergs/cm2
Band function

Time interval is from   -6.040 sec. to  230.344 sec.


Spectral model in the Band function:
------------------------------------------------------------
Parameters  : value       lower 90%   higher 90%
alpha       :    (     )
beta        :     (     )
Epeak [keV] :       (   )
Norm@50keV   :     (     )
------------------------------------------------------------

Photon flux (15-150 keV)    in  sec:  (    ) ph/cm2/s
Energy fluence (15-150 keV)             : 0 ( 0  0 ) ergs/cm2
Single BB
Spectral model blackbody:
------------------------------------------------------------
Parameters  : value    Lower 90%  Upper 90%
kT [keV]    : 14.3070  (  )
R^2/D10^2   : 3.65710E-02  (   )
(R is the radius in km and D10 is the distance to the source in units of 10 kpc)
------------------------------------------------------------
#Fit statistic  : Chi-Squared                  186.33     using 59 bins.
 Reduced chi-squared =
# Null hypothesis probability of 1.21e-15 with 57 degrees of freedom

Energy  Fluence     90% Error
[keV]   [erg/cm2]   [erg/cm2]
15- 25  3.730e-07   3.002e-08
25- 50  1.417e-06   6.619e-08
50-150  1.931e-06   1.647e-07
15-150  3.721e-06   1.690e-07
Thermal bremsstrahlung (OTTB)
Spectral model: thermal bremsstrahlung
------------------------------------------------------------
Parameters  : value         Lower 90%    Upper 90%
kT [keV]    : 173.832       (-32.6702      -173.67)
Norm        : 1.16547       (-0.0511745     0.0554114)
------------------------------------------------------------
#Fit statistic  : Chi-Squared                   62.15     using 59 bins.
 Reduced chi-squared =
# Null hypothesis probability of 2.98e-01 with 57 degrees of freedom

Energy  Fluence     90% Error
[keV]   [erg/cm2]   [erg/cm2]
15- 25  6.975e-07   4.243e-08
25- 50  1.319e-06   1.338e-07
50-150  2.759e-06   7.962e-07
15-150  4.775e-06   8.818e-07
Double BB

Spectral model: bbodyrad<1> + bbodyrad<2>
------------------------------------------------------------
Parameters  : value         Lower 90%    Upper 90%
kT1 [keV]   : 7.86971        (-1.2687      1.28989)
R1^2/D10^2  : 0.205963        (-0.0753935      0.154965)
kT2 [keV]   : 27.5209        (-4.88336      8.45247)
R2^2/D10^2  : 2.61762E-03    (-0.00158031   0.00289589)
------------------------------------------------------------
#Fit statistic  : Chi-Squared                   68.74     using 59 bins.
 Reduced chi-squared =
# Null hypothesis probability of 1.01e-01 with 55 degrees of freedom

Energy  Fluence     90% Error
[keV]   [erg/cm2]   [erg/cm2]
15- 25  6.157e-07   7.801e-08
25- 50  1.375e-06   1.290e-07
50-150  2.753e-06   5.767e-07
15-150  4.744e-06   7.057e-07
Peak spectrum fit
Power-law model
Time interval is from    0.604 sec. to    1.604 sec.

Spectral model in power-law:
------------------------------------------------------------
Parameters  : value       lower 90%   higher 90%
Photon index: 0.789100     ( -0.132065   0.128346 )
Norm@50keV  : 2.02557E-02    ( -0.00162017   0.00160982 )
------------------------------------------------------------
#Fit statistic  : Chi-Squared                   50.61     using 59 bins.
 Reduced chi-squared = 0.887895
# Null hypothesis probability of 7.12e-01 with 57 degrees of freedom

Photon flux (15-150 keV)    in 1 sec: 2.32896 ( -0.18216  0.18243 ) ph/cm2/s
Energy fluence (15-150 keV)             : 2.37821e-07 ( -1.94274e-08  1.95147e-08 ) ergs/cm2
Cutoff power-law model
Time interval is from    0.604 sec. to    1.604 sec.
Spectral model in the cutoff power-law:
------------------------------------------------------------
Parameters  : value       lower 90%   higher 90%
Photon index: -0.115381     ( -0.717188   0.606478 )
Epeak [keV] : 141.512      ( -36.8401 154.383 )
Norm@50keV  : 4.86112E-02    ( -0.0211639   0.0447347 )
------------------------------------------------------------
#Fit statistic  : Chi-Squared                   43.70     using 59 bins.
 Reduced chi-squared = 0.780357
# Null hypothesis probability of 8.84e-01 with 56 degrees of freedom

Photon flux (15-150 keV)    in 1 sec: 2.26498 ( -0.18821  0.18776 ) ph/cm2/s
Energy fluence (15-150 keV)             : 2.30893e-07 ( -2.07475e-08  2.06024e-08 ) ergs/cm2
Band function

Time interval is from    0.604 sec. to    1.604 sec.


Spectral model in the Band function:
------------------------------------------------------------
Parameters  : value       lower 90%   higher 90%
alpha       :    (     )
beta        :     (     )
Epeak [keV] :       (   )
Norm@50keV   :     (     )
------------------------------------------------------------

Photon flux (15-150 keV)    in  sec:  (    ) ph/cm2/s
Energy fluence (15-150 keV)             : 0 ( 0  0 ) ergs/cm2
Single BB

Spectral model blackbody:
------------------------------------------------------------
Parameters  : value    Lower 90%  Upper 90%
kT [keV]    : 24.8420  (-2.31506  2.70608)
R^2/D10^2   : 6.22806E-02  (-0.0166806   0.0216182)
(R is the radius in km and D10 is the distance to the source in units of 10 kpc)
------------------------------------------------------------
#Fit statistic  : Chi-Squared                   50.85     using 59 bins.
 Reduced chi-squared =
# Null hypothesis probability of 7.04e-01 with 57 degrees of freedom

Energy  Fluence     90% Error
[keV]   [erg/cm2]   [erg/cm2]
15- 25  6.699e-09   1.047e-09
25- 50  3.788e-08   4.105e-09
50-150  1.735e-07   2.030e-08
15-150  2.181e-07   2.190e-08
Thermal bremsstrahlung (OTTB)

Spectral model: thermal bremsstrahlung
------------------------------------------------------------
Parameters  : value         Lower 90%    Upper 90%
kT [keV]    : 199.362       (      )
Norm        : 8.91749       (     )
------------------------------------------------------------
#Fit statistic  : Chi-Squared                  137.88     using 59 bins.
 Reduced chi-squared =
# Null hypothesis probability of 1.19e-08 with 57 degrees of freedom

Energy  Fluence     90% Error
[keV]   [erg/cm2]   [erg/cm2]
15- 25  2.220e-08   3.365e-09
25- 50  4.272e-08   1.473e-08
50-150  9.368e-08   3.364e-08
15-150  1.586e-07   5.742e-08
Double BB

Spectral model: bbodyrad<1> + bbodyrad<2>
------------------------------------------------------------
Parameters  : value         Lower 90%    Upper 90%
kT1 [keV]   : 14.9701        (-12.2245      7.1947)
R1^2/D10^2  : 0.150962        (-0.074129      28.0734)
kT2 [keV]   : 43.8321        (-42.7889      -45.6708)
R2^2/D10^2  : 7.94801E-03    (-0.0065275   0.0541549)
------------------------------------------------------------
#Fit statistic  : Chi-Squared                   44.21     using 59 bins.
 Reduced chi-squared =
# Null hypothesis probability of 8.51e-01 with 55 degrees of freedom

Energy  Fluence     90% Error
[keV]   [erg/cm2]   [erg/cm2]
15- 25  8.928e-09   5.085e-09
25- 50  4.099e-08   2.212e-08
50-150  1.801e-07   9.165e-08
15-150  2.300e-07   1.180e-07
Pre-slew spectrum (Pre-slew PHA with pre-slew DRM)
Power-law model
Spectral model in power-law:
------------------------------------------------------------
Parameters  : value       lower 90%   higher 90%
Photon index: 0.932013     ( -0.0494148   0.0489337 )
Norm@50keV  : 1.33745E-02    ( -0.000392968   0.000392128 )
------------------------------------------------------------
#Fit statistic  : Chi-Squared                  100.20     using 59 bins.
 Reduced chi-squared =
# Null hypothesis probability of 3.59e-04 with 57 degrees of freedom

Photon flux (15-150 keV)    in 17.62 sec: 1.53585 ( -0.0455581  0.0456198 ) ph/cm2/s
Energy fluence (15-150 keV)             : 2.61254e-06 ( -7.79659e-08  7.80194e-08 ) ergs/cm2
Cutoff power-law model

Spectral model in the cutoff power-law:
------------------------------------------------------------
Parameters  : value       lower 90%   higher 90%
Photon index: 0.197112     ( -0.233116   0.22091 )
Epeak [keV] : 146.980      ( -21.2917 36.7012 )
Norm@50keV  : 2.73893E-02    ( -0.0051518   0.00667644 )
------------------------------------------------------------
#Fit statistic  : Chi-Squared                   63.93     using 59 bins.
 Reduced chi-squared =
# Null hypothesis probability of 2.18e-01 with 56 degrees of freedom

Photon flux (15-150 keV)    in 17.62 sec: 1.49038 ( -0.04724  0.04729 ) ph/cm2/s
Energy fluence (15-150 keV)             : 2.54315e-06 ( -8.28669e-08  8.23559e-08 ) ergs/cm2
Band function

Spectral model in the Band function:
------------------------------------------------------------
Parameters  : value       lower 90%   higher 90%
alpha       :    (     )
beta        :     (     )
Epeak [keV] :       (   )
Norm@50keV   :     (     )
------------------------------------------------------------

Photon flux (15-150 keV)    in  sec:  (    ) ph/cm2/s
Energy fluence (15-150 keV)             : 0 ( 0  0 ) ergs/cm2
S(25-50 keV) vs. S(50-100 keV) plot
S(25-50 keV)  = 1.28e-06
S(50-100 keV) = 1.68e-06
T90 vs. Hardness ratio plot
T90                                   = 175.151999950409 sec.
Hardness ratio (energy fluence ratio) = 1.3125
Color vs. Color plot
Count Ratio  (25-50 keV) / (15-25 keV) = 1.36978
Count Ratio (50-100 keV) / (15-25 keV) = 0.889977
Mask shadow pattern

IMX = -1.663669658110273E-01, IMY = -1.046454836695666E-01
TIME vs. PHA plot around the trigger time
Blue+Cyan dotted lines: Time interval of the scaled map
From 0.000000 to 1.024000
TIME vs. DetID plot around the trigger time

Blue+Cyan dotted lines: Time interval of the scaled map
From 0.000000 to 1.024000
100 us light curve (15-350 keV)
Blue+Cyan dotted lines: Time interval of the scaled map
From 0.000000 to 1.024000
Spacecraft aspect plot

Bright source in the pre-burst/pre-slew/post-slew images
Pre-burst image of 15-350 keV band
Time interval of the image:
-37.419400 -6.040000

# RAcent  DECcent POSerr Theta    Phi  PeakCts   SNR AngSep     Name
#  [deg]    [deg]    ['] [deg]  [deg]                   [']
 83.6423  22.0341    0.7  11.1 -173.2   1.2430  15.5    1.3	Crab
 49.2280  -2.8154    2.3  36.8   76.4   1.2490   5.0 ------	UNKNOWN
 72.6376  68.1795    2.3  57.7 -178.4   2.3472   5.1 ------	UNKNOWN
101.5101  48.2236    2.2  40.2 -155.1   0.5710   5.2 ------	UNKNOWN
Pre-slew background subtracted image of 15-350 keV band
Time interval of the image:
-6.040000 11.580590

# RAcent  DECcent POSerr Theta    Phi  PeakCts   SNR AngSep     Name
#  [deg]    [deg]    ['] [deg]  [deg]                   [']
 83.7898  22.0197   49.5  11.1 -172.5  -0.0177  -0.2    8.7	Crab
 59.7214  29.1205    2.4  28.7  139.1   0.5294   4.7 ------	UNKNOWN
 72.0333  -1.8167    2.4  17.2   48.9   0.3831   4.8 ------	UNKNOWN
 68.6641  41.5975    2.1  33.3  165.9   0.5339   5.6 ------	UNKNOWN
 76.2239  19.5514    0.2  11.1  147.8   3.5365  46.1 ------	UNKNOWN
 74.7163  55.5452    1.9  45.1  179.3   0.8299   6.1 ------	UNKNOWN
 97.6184 -42.6899    2.3  55.2   -6.2   1.6796   5.0 ------	UNKNOWN
101.6055  65.7064    2.2  56.1 -164.8   1.5344   5.3 ------	UNKNOWN
116.9411  62.1257    2.1  56.5 -155.7   1.6282   5.5 ------	UNKNOWN
Post-slew image of 15-350 keV band
Time interval of the image:
51.980600 962.143200

# RAcent  DECcent POSerr Theta    Phi  PeakCts   SNR AngSep     Name
#  [deg]    [deg]    ['] [deg]  [deg]                   [']
 83.6209  22.0114    0.4   7.3 -102.7  38.5453  30.7    0.7	Crab
 39.8456  15.7773    2.2  34.8   97.8  15.5837   5.3 ------	UNKNOWN
103.5914  16.1673    2.3  26.2  -78.9   7.7080   5.0 ------	UNKNOWN
104.4051  -4.2681    2.9  36.5  -44.2   6.6962   3.9 ------	UNKNOWN
124.3104  46.0311    4.1  47.3 -127.3  18.0634   2.8 ------	UNKNOWN
124.7447  47.6802    3.2  48.1 -129.3  23.1855   3.7 ------	UNKNOWN
Plot creation:
Sat Sep 30 00:45:31 EDT 2023