Special notes of this burst
Image
Pre-slew 15.0-350.0 keV image (Event data)
#   RAcent    DECcent   POSerr    Theta     Phi              Peak Cts       SNR   Name
   48.0641   -11.0498   0.0154    25.9423   -60.7536         0.5340043     12.425 TRIG_00118248

Foreground time interval of the image:
 -4.824  13.176 (delta_t =  18.000 [sec])
Background time interval of the image:
-299.824  -4.824 (delta_t = 295.000 [sec])
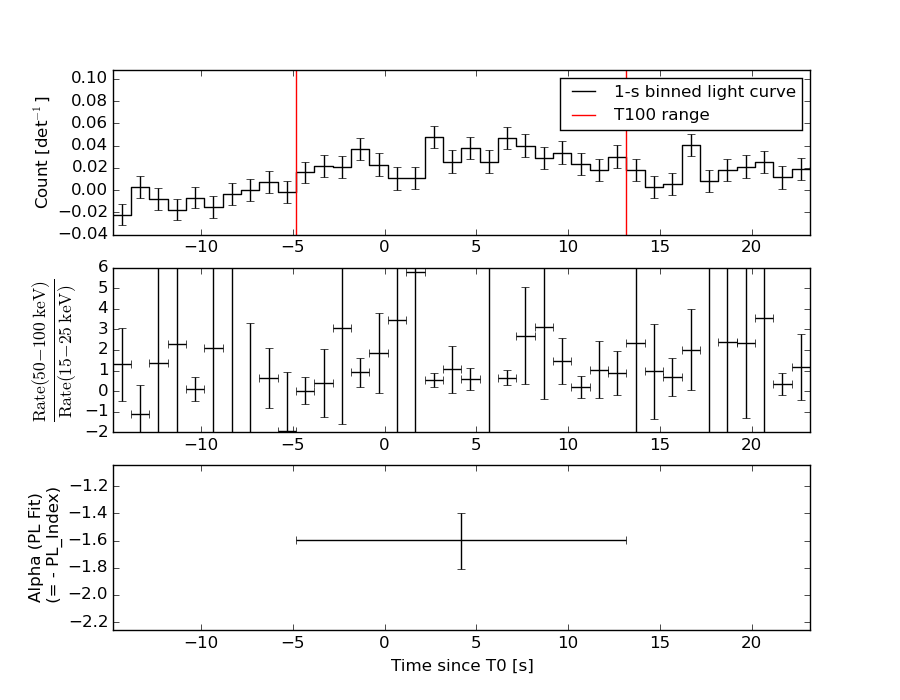
Lightcurves
Notes:
- 1) The mask-weighted light curves are using the flight position.
- 2) Multiple plots of different time binning/intervals are shown to cover all scenarios of short/long GRBs, rate/image triggers, and real/false positives.
- 3) For all the mask-weighted lightcurves, the y-axis units are counts/sec/det where a det is 0.4 x 0.4 = 0.16 sq cm.
- 4) The verticle lines correspond to following: green dotted lines are T50 interval, black dotted lines are T90 interval, blue solid line(s) is a spacecraft slew start time, and orange solid line(s) is a spacecraft slew end time.
- 5) Time of each bin is in the middle of the bin.
1 s binning
From T0-310 s to T0+310 s
From T100_start - 20 s to T100_end + 30 s
Full time interval
64 ms binning
Full time interval
From T100_start to T100_end
From T0-5 sec to T0+5 sec
16 ms binning
From T100_start-5 s to T100_start+5 s
Blue+Cyan dotted lines: Time interval of the scaled map
From 0.000000 to 8.192000
8 ms binning
From T100_start-3 s to T100_start+3 s
Blue+Cyan dotted lines: Time interval of the scaled map
From 0.000000 to 8.192000
2 ms binning
From T100_start-1 s to T100_start+1 s
Blue+Cyan dotted lines: Time interval of the scaled map
From 0.000000 to 8.192000
SN=5 or 10 sec. binning (whichever binning is satisfied first)

SN=5 or 10 sec. binning (T < 200 sec)
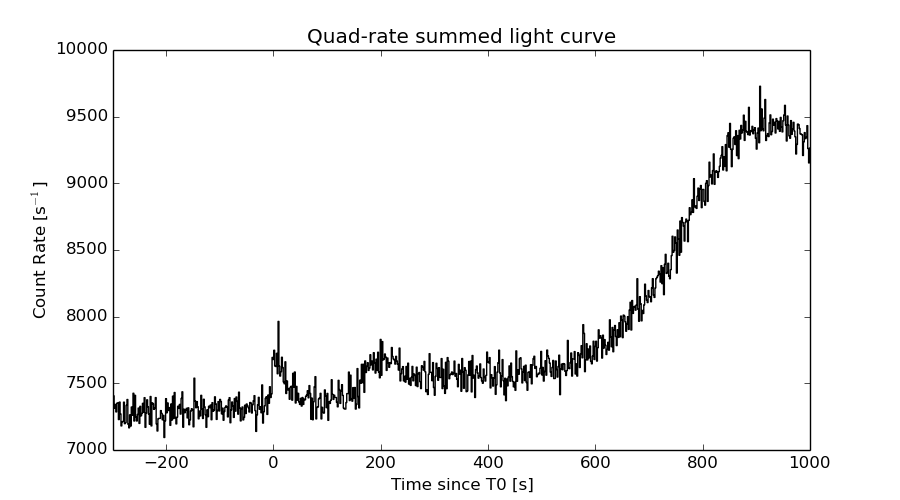
Quad-rate summed light curves (from T0-300s to T0+1000s)
Spectral Evolution
Spectra
Notes:
- 1) The fitting includes the systematic errors.
- 2) When the burst includes telescope slew time periods, the fitting uses an average response file made from multiple 5-s response files through out the slew time plus single time preiod for the non-slew times, and weighted by the total counts in the corresponding time period using addrmf. An average response file is needed becuase a spectral fit using the pre-slew DRM will introduce some errors in both a spectral shape and a normalization if the PHA file contains a lot of the slew/post-slew time interval.
- 3) For fits to more complicated models (e.g. a power-law over a cutoff power-law), the BAT team has decided to require a chi-square improvement of more than 6 for each extra dof.
Time averaged spectrum fit using the average DRM
Power-law model
Time interval is from   -4.824 sec. to   13.176 sec.

Spectral model in power-law:
------------------------------------------------------------
Parameters  : value       lower 90%   higher 90%
Photon index: 1.59836     ( -0.202965   0.208686 )
Norm@50keV  : 1.83989E-03    ( -0.000260008   0.000257836 )
------------------------------------------------------------
#Fit statistic : Chi-Squared =          75.62 using 59 PHA bins.
# Reduced chi-squared =          1.327 for     57 degrees of freedom
# Null hypothesis probability =   5.001712e-02

Photon flux (15-150 keV)    in 18 sec: 0.236310 ( -0.031381  0.0314041 ) ph/cm2/s
Energy fluence (15-150 keV)             : 3.09805e-07 ( -4.63511e-08  4.71841e-08 ) ergs/cm2
Cutoff power-law model

Time interval is from   -4.824 sec. to   13.176 sec.
Spectral model in the cutoff power-law:
------------------------------------------------------------
Parameters  : value       lower 90%   higher 90%
Photon index: -0.527102     ( -1.37327   1.06677 )
Epeak [keV] : 55.4978      ( -8.15984 13.6555 )
Norm@50keV  : 2.45411E-02    ( -0.0245764   0.101128 )
------------------------------------------------------------
#Fit statistic : Chi-Squared =          61.47 using 59 PHA bins.
# Reduced chi-squared =          1.098 for     56 degrees of freedom
# Null hypothesis probability =   2.864144e-01

Photon flux (15-150 keV)    in 18 sec: 0.222867 ( -0.031664  0.03182 ) ph/cm2/s
Energy fluence (15-150 keV)             : 2.73573e-07 ( -4.39614e-08  4.7196e-08 ) ergs/cm2
Band function

Time interval is from   -4.824 sec. to   13.176 sec.

Spectral model in the Band function:
------------------------------------------------------------
Parameters  : value       lower 90%   higher 90%
alpha       : 0.528954   ( -0.770506   1.8371 )
beta        : -10.0000    ( 10   3.55271e-15 )
Epeak [keV] : 55.4784      ( -8.14738 13.6248 )
Norm@50keV   : 2.46016E-02    ( -0.0246015   0.101458 )
------------------------------------------------------------
#Fit statistic : Chi-Squared =          61.47 using 59 PHA bins.
# Reduced chi-squared =          1.118 for     55 degrees of freedom
# Null hypothesis probability =   2.553680e-01

Photon flux (15-150 keV)    in 18 sec: 0.223012 ( 6.77699  -0.031606 ) ph/cm2/s
Energy fluence (15-150 keV)             : 2.73314e-07 ( -2.73188e-07  -4.374e-08 ) ergs/cm2
Single BB
Spectral model blackbody:
------------------------------------------------------------
Parameters  : value    Lower 90%  Upper 90%
kT [keV]    : 13.5952  (-1.66466  1.91261)
R^2/D10^2   : 4.07806E-02  (-0.0155459   0.0244444)
(R is the radius in km and D10 is the distance to the source in units of 10 kpc)
------------------------------------------------------------
#Fit statistic : Chi-Squared =          62.91 using 59 PHA bins.
# Reduced chi-squared =          1.104 for     57 degrees of freedom
# Null hypothesis probability =   2.750839e-01

Energy  Fluence     90% Error
[keV]   [erg/cm2]   [erg/cm2]
15- 25  2.873e-08   6.183e-09
25- 50  1.037e-07   1.851e-08
50-150  1.243e-07   3.340e-08
15-150  2.567e-07   4.554e-08
Thermal bremsstrahlung (OTTB)
Spectral model: thermal bremsstrahlung
------------------------------------------------------------
Parameters  : value         Lower 90%    Upper 90%
kT [keV]    : 143.403       (-56.1643      -141.462)
Norm        : 0.999767       (-0.141616     0.171849)
------------------------------------------------------------
#Fit statistic : Chi-Squared =          70.47 using 59 PHA bins.
# Reduced chi-squared =          1.236 for     57 degrees of freedom
# Null hypothesis probability =   1.084108e-01

Energy  Fluence     90% Error
[keV]   [erg/cm2]   [erg/cm2]
15- 25  4.639e-08   2.541e-08
25- 50  8.541e-08   4.630e-08
50-150  1.654e-07   9.909e-08
15-150  2.972e-07   1.643e-07
Double BB
Spectral model: bbodyrad<1> + bbodyrad<2>
------------------------------------------------------------
Parameters  : value         Lower 90%    Upper 90%
kT1 [keV]   : 5.86159        (-5.88685      -5.88685)
R1^2/D10^2  : 0.203153        (-0.199424      -0.199424)
kT2 [keV]   : 15.5141        (-2.83772      -15.5339)
R2^2/D10^2  : 2.23886E-02    (-0.0222568   0.0299674)
------------------------------------------------------------
#Fit statistic : Chi-Squared =          60.95 using 59 PHA bins.
# Reduced chi-squared =          1.108 for     55 degrees of freedom
# Null hypothesis probability =   2.704581e-01

Energy  Fluence     90% Error
[keV]   [erg/cm2]   [erg/cm2]
15- 25  3.632e-08   1.939e-08
25- 50  9.797e-08   5.070e-08
50-150  1.387e-07   8.199e-08
15-150  2.730e-07   1.459e-07
Peak spectrum fit
Power-law model

Time interval is from    2.176 sec. to    3.176 sec.

Spectral model in power-law:
------------------------------------------------------------
Parameters  : value       lower 90%   higher 90%
Photon index: 1.47195     ( -0.641648   0.662681 )
Norm@50keV  : 3.04409E-03    ( -0.00110617   0.00106321 )
------------------------------------------------------------
#Fit statistic : Chi-Squared =          70.29 using 59 PHA bins.
# Reduced chi-squared =          1.233 for     57 degrees of freedom
# Null hypothesis probability =   1.110391e-01

Photon flux (15-150 keV)    in 1 sec: 0.377230 ( -0.130737  0.130947 ) ph/cm2/s
Energy fluence (15-150 keV)             : 2.90151e-08 ( -1.11974e-08  1.14826e-08 ) ergs/cm2
Cutoff power-law model

Time interval is from    2.176 sec. to    3.176 sec.
Spectral model in the cutoff power-law:
------------------------------------------------------------
Parameters  : value       lower 90%   higher 90%
Photon index: 2.14108     (     )
Epeak [keV] : 53.0070      (   )
Norm@50keV  : 1.29634E-03    (     )
------------------------------------------------------------
#Fit statistic : Chi-Squared =          70.09 using 59 PHA bins.
# Reduced chi-squared =          1.252 for     56 degrees of freedom
# Null hypothesis probability =   9.760548e-02

Photon flux (15-150 keV)    in 1 sec: 0.378228 ( -0.131308  0.129923 ) ph/cm2/s
Energy fluence (15-150 keV)             : 2.90309e-08 ( -1.1731e-08  1.12982e-08 ) ergs/cm2
Band function
Time interval is from    2.176 sec. to    3.176 sec.

Spectral model in the Band function:
------------------------------------------------------------
Parameters  : value       lower 90%   higher 90%
alpha       : -0.867805   ( 0.953121   0.953121 )
beta        : -1.47805    ( 1.63642   0.806306 )
Epeak [keV] : 32.2611      ( -32.7178 -32.7178 )
Norm@50keV   : 1.06737E-02    ( -0.0106346   408409 )
------------------------------------------------------------
#Fit statistic : Chi-Squared =          70.29 using 59 PHA bins.
# Reduced chi-squared =          1.278 for     55 degrees of freedom
# Null hypothesis probability =   8.027013e-02

Photon flux (15-150 keV)    in 1 sec:  (    ) ph/cm2/s
Energy fluence (15-150 keV)             : 0 ( 0  0 ) ergs/cm2
Single BB
Spectral model blackbody:
------------------------------------------------------------
Parameters  : value    Lower 90%  Upper 90%
kT [keV]    : 13.7271  (-4.08927  7.26594)
R^2/D10^2   : 5.95774E-02  (-0.0595775   0.146839)
(R is the radius in km and D10 is the distance to the source in units of 10 kpc)
------------------------------------------------------------
#Fit statistic : Chi-Squared =          71.88 using 59 PHA bins.
# Reduced chi-squared =          1.261 for     57 degrees of freedom
# Null hypothesis probability =   8.866625e-02

Energy  Fluence     90% Error
[keV]   [erg/cm2]   [erg/cm2]
15- 25  2.375e-09   1.535e-09
25- 50  8.661e-09   5.485e-09
50-150  1.064e-08   7.665e-09
15-150  2.167e-08   1.375e-08
Thermal bremsstrahlung (OTTB)
Spectral model: thermal bremsstrahlung
------------------------------------------------------------
Parameters  : value         Lower 90%    Upper 90%
kT [keV]    : 199.363       (-199.363      -199.363)
Norm        : 1.54487       (-0.528721     0.529335)
------------------------------------------------------------
#Fit statistic : Chi-Squared =          70.54 using 59 PHA bins.
# Reduced chi-squared =          1.238 for     57 degrees of freedom
# Null hypothesis probability =   1.072475e-01

Energy  Fluence     90% Error
[keV]   [erg/cm2]   [erg/cm2]
15- 25  3.847e-09   2.455e-09
25- 50  7.400e-09   4.674e-09
50-150  1.623e-08   1.037e-08
15-150  2.748e-08   1.757e-08
Double BB
------------------------------------------------------------
#Fit statistic : Chi-Squared =          70.04 using 59 PHA bins.
#Fit statistic : Chi-Squared =          68.93 using 59 PHA bins.
#Fit statistic : Chi-Squared =          68.92 using 59 PHA bins.
#Fit statistic : Chi-Squared =          68.90 using 59 PHA bins.
# Reduced chi-squared =          1.273 for     55 degrees of freedom
# Reduced chi-squared =          1.253 for     55 degrees of freedom
# Reduced chi-squared =          1.253 for     55 degrees of freedom
# Reduced chi-squared =          1.253 for     55 degrees of freedom
# Null hypothesis probability =   8.332873e-02
# Null hypothesis probability =   9.801559e-02
# Null hypothesis probability =   9.820783e-02
# Null hypothesis probability =   9.844320e-02

Energy  Fluence     90% Error
[keV]   [erg/cm2]   [erg/cm2]
15- 25  3.953e-09   1.984e-09
25- 50  7.399e-09   4.576e-09
50-150  1.243e-08   8.430e-09
15-150  2.378e-08   1.441e-08
Pre-slew spectrum (Pre-slew PHA with pre-slew DRM)
Power-law model

Spectral model in power-law:
------------------------------------------------------------
Parameters  : value       lower 90%   higher 90%
Photon index: 1.59836     ( -0.202965   0.208686 )
Norm@50keV  : 1.83989E-03    ( -0.000260008   0.000257836 )
------------------------------------------------------------
#Fit statistic : Chi-Squared =          75.62 using 59 PHA bins.
# Reduced chi-squared =          1.327 for     57 degrees of freedom
# Null hypothesis probability =   5.001712e-02

Photon flux (15-150 keV)    in 18 sec: 0.236310 ( -0.031381  0.0314041 ) ph/cm2/s
Energy fluence (15-150 keV)             : 3.09805e-07 ( -4.63511e-08  4.71841e-08 ) ergs/cm2
Cutoff power-law model
Spectral model in the cutoff power-law:
------------------------------------------------------------
Parameters  : value       lower 90%   higher 90%
Photon index: -0.527102     ( -1.37327   1.06677 )
Epeak [keV] : 55.4978      ( -8.15984 13.6555 )
Norm@50keV  : 2.45411E-02    ( -0.0245764   0.101128 )
------------------------------------------------------------
#Fit statistic : Chi-Squared =          61.47 using 59 PHA bins.
# Reduced chi-squared =          1.098 for     56 degrees of freedom
# Null hypothesis probability =   2.864144e-01

Photon flux (15-150 keV)    in 18 sec: 0.222867 ( -0.031664  0.03182 ) ph/cm2/s
Energy fluence (15-150 keV)             : 2.73573e-07 ( -4.39614e-08  4.7196e-08 ) ergs/cm2
Band function

Spectral model in the Band function:
------------------------------------------------------------
Parameters  : value       lower 90%   higher 90%
alpha       : 0.528954   ( -0.770506   1.8371 )
beta        : -10.0000    ( 10   3.55271e-15 )
Epeak [keV] : 55.4784      ( -8.14738 13.6248 )
Norm@50keV   : 2.46016E-02    ( -0.0246015   0.101458 )
------------------------------------------------------------
#Fit statistic : Chi-Squared =          61.47 using 59 PHA bins.
# Reduced chi-squared =          1.118 for     55 degrees of freedom
# Null hypothesis probability =   2.553680e-01

Photon flux (15-150 keV)    in 18 sec: 0.223012 ( 6.77699  -0.031606 ) ph/cm2/s
Energy fluence (15-150 keV)             : 2.73314e-07 ( -2.73188e-07  -4.374e-08 ) ergs/cm2
S(25-50 keV) vs. S(50-100 keV) plot
S(25-50 keV)  = 8.02e-08
S(50-100 keV) = 1.06e-07
T90 vs. Hardness ratio plot
T90                                   = 15 sec.
Hardness ratio (energy fluence ratio) = 1.3217
Color vs. Color plot
Count Ratio  (25-50 keV) / (15-25 keV) = 1.80333
Count Ratio (50-100 keV) / (15-25 keV) = 1.19672
Mask shadow pattern
IMX = 2.376806277646026E-01, IMY = 4.244722018507173E-01
TIME vs. PHA plot around the trigger time
Blue+Cyan dotted lines: Time interval of the scaled map
From 0.000000 to 8.192000
TIME vs. DetID plot around the trigger time
Blue+Cyan dotted lines: Time interval of the scaled map
From 0.000000 to 8.192000
100 us light curve (15-350 keV)
Blue+Cyan dotted lines: Time interval of the scaled map
From 0.000000 to 8.192000
Spacecraft aspect plot
Bright source in the pre-burst/pre-slew/post-slew images
Pre-burst image of 15-350 keV band
Time interval of the image:
-299.824000 -4.824000

# RAcent  DECcent POSerr Theta    Phi  PeakCts   SNR AngSep     Name
#  [deg]    [deg]    ['] [deg]  [deg]                   [']
 16.1288 -39.6754    2.1  14.8  100.8   0.8241   5.6 ------	UNKNOWN
  1.9698 -30.8589    3.1  22.0  142.2   0.6226   3.7 ------	UNKNOWN
  9.0864 -16.0790    2.3  20.4 -172.4   0.7989   4.9 ------	UNKNOWN
 42.6392 -29.4030    2.9  13.7  -14.5   0.6368   4.0 ------	UNKNOWN
 59.0251 -17.7979    2.1  31.0  -36.4   1.0376   5.4 ------	UNKNOWN
 59.2701   2.8607    2.9  43.7  -63.8   3.7377   4.0 ------	UNKNOWN
Pre-slew background subtracted image of 15-350 keV band
Time interval of the image:
-4.824000 13.176000

# RAcent  DECcent POSerr Theta    Phi  PeakCts   SNR AngSep     Name
#  [deg]    [deg]    ['] [deg]  [deg]                   [']
 33.3237 -22.9313    2.3   7.6  -64.7   0.1694   5.1 ------	UNKNOWN
 48.0642 -11.0499    0.9  25.9  -60.8   0.5341  12.4 ------	UNKNOWN
 55.3226 -10.0975    2.1  32.0  -52.6   0.2846   5.6 ------	UNKNOWN
 25.8437  15.3308    2.4  43.3 -115.9   0.7335   4.8 ------	UNKNOWN
Post-slew image of 15-350 keV band
Time interval of the image:
-299.824000 32.205500

# RAcent  DECcent POSerr Theta    Phi  PeakCts   SNR AngSep     Name
#  [deg]    [deg]    ['] [deg]  [deg]                   [']
  1.9735 -30.8702    2.8  22.0  142.1   0.7663   4.2 ------	UNKNOWN
 42.6186 -29.3754    2.9  13.7  -14.6   0.6856   4.0 ------	UNKNOWN
 59.0164 -17.8188    2.1  31.0  -36.4   1.1316   5.6 ------	UNKNOWN
Plot creation:
Sun May 31 16:50:58 EDT 2015