Estimated redshift from machine learning (Ukwatta et al. 2016) - may take a few minute to calcaulte
Image
Pre-slew 15.0-350.0 keV image (Event data)
# RAcent DECcent POSerr Theta Phi Peak Cts SNR Name
328.4532 37.8578 0.0083 12.6449 142.6552 1.3068170 23.269 TRIG_01185673
Foreground time interval of the image:
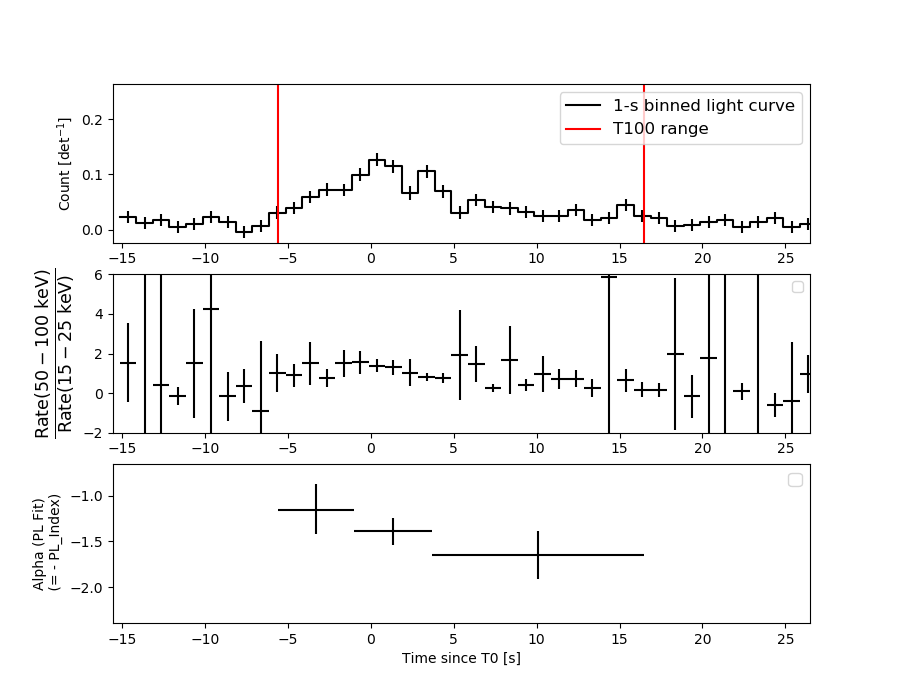
-5.564 16.484 (delta_t = 22.048 [sec])
Background time interval of the image:
-239.128 -5.564 (delta_t = 233.564 [sec])
Lightcurves
Notes:
- 1) The mask-weighted light curves are using the flight position.
- 2) Multiple plots of different time binning/intervals are shown to cover all scenarios of short/long GRBs, rate/image triggers, and real/false positives.
- 3) For all the mask-weighted lightcurves, the y-axis units are counts/sec/det where a det is 0.4 x 0.4 = 0.16 sq cm.
- 4) The verticle lines correspond to following: green dotted lines are T50 interval, black dotted lines are T90 interval, blue solid line(s) is a spacecraft slew start time, and orange solid line(s) is a spacecraft slew end time.
- 5) Time of each bin is in the middle of the bin.
1 s binning
From T0-310 s to T0+310 s
From T100_start - 20 s to T100_end + 30 s

Full time interval

64 ms binning
Full time interval
From T100_start to T100_end
From T0-5 sec to T0+5 sec
16 ms binning
From T100_start-5 s to T100_start+5 s

Blue+Cyan dotted lines: Time interval of the scaled map
From 0.000000 to 1.024000
8 ms binning
From T100_start-3 s to T100_start+3 s
Blue+Cyan dotted lines: Time interval of the scaled map
From 0.000000 to 1.024000
2 ms binning
From T100_start-1 s to T100_start+1 s

Blue+Cyan dotted lines: Time interval of the scaled map
From 0.000000 to 1.024000
SN=5 or 10 sec. binning (whichever binning is satisfied first)
SN=5 or 10 sec. binning (T < 200 sec)

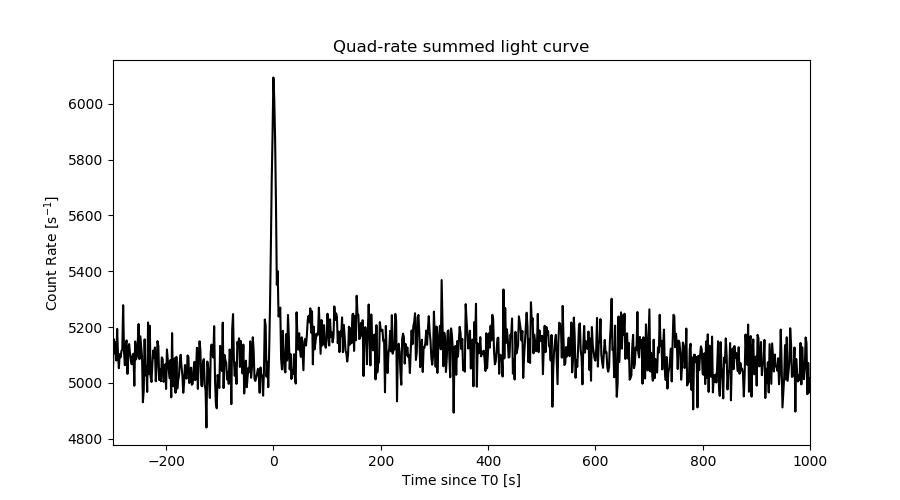
Quad-rate summed light curves (from T0-300s to T0+1000s)
Spectral Evolution
Spectra
Notes:
- 1) The fitting includes the systematic errors.
- 2) When the burst includes telescope slew time periods, the fitting uses an average response file made from multiple 5-s response files through out the slew time plus single time preiod for the non-slew times, and weighted by the total counts in the corresponding time period using addrmf. An average response file is needed becuase a spectral fit using the pre-slew DRM will introduce some errors in both a spectral shape and a normalization if the PHA file contains a lot of the slew/post-slew time interval.
- 3) For fits to more complicated models (e.g. a power-law over a cutoff power-law), the BAT team has decided to require a chi-square improvement of more than 6 for each extra dof.
Time averaged spectrum fit using the average DRM
Power-law model

Time interval is from   -5.564 sec. to   16.484 sec.

Spectral model in power-law:
------------------------------------------------------------
Parameters  : value       lower 90%   higher 90%
Photon index: 1.42592     ( -0.131524   0.131674 )
Norm@50keV  : 3.50490E-03    ( -0.000255731   0.000254788 )
------------------------------------------------------------
#Fit statistic  : Chi-Squared                   67.40     using 59 bins.
 Reduced chi-squared = 1.18246
# Null hypothesis probability of 1.63e-01 with 57 degrees of freedom

Photon flux (15-150 keV)    in 22.05 sec: 0.429419 ( -0.031206  0.031252 ) ph/cm2/s
Energy fluence (15-150 keV)             : 7.42999e-07 ( -6.07096e-08  6.13204e-08 ) ergs/cm2
Cutoff power-law model

Time interval is from   -5.564 sec. to   16.484 sec.
Spectral model in the cutoff power-law:
------------------------------------------------------------
Parameters  : value       lower 90%   higher 90%
Photon index: 1.42313     ( -0.368952   0.159294 )
Epeak [keV] : 1.00000E+04      ( -10000 -10000 )
Norm@50keV  : 3.51679E-03    ( -0.000257269   0.000249923 )
------------------------------------------------------------
#Fit statistic  : Chi-Squared                   67.41     using 59 bins.
 Reduced chi-squared = 1.20375
# Null hypothesis probability of 1.41e-01 with 56 degrees of freedom

Photon flux (15-150 keV)    in 22.05 sec: 0.431268 ( -0.041085  0.03719 ) ph/cm2/s
Energy fluence (15-150 keV)             : 7.49252e-07 ( -7.30003e-08  5.82032e-08 ) ergs/cm2
Band function

Time interval is from   -5.564 sec. to   16.484 sec.


Spectral model in the Band function:
------------------------------------------------------------
Parameters  : value       lower 90%   higher 90%
alpha       :    (     )
beta        :     (     )
Epeak [keV] :       (   )
Norm@50keV   :     (     )
------------------------------------------------------------

Photon flux (15-150 keV)    in  sec:  (    ) ph/cm2/s
Energy fluence (15-150 keV)             : 0 ( 0  0 ) ergs/cm2
Single BB

Spectral model blackbody:
------------------------------------------------------------
Parameters  : value    Lower 90%  Upper 90%
kT [keV]    : 15.0821  (  )
R^2/D10^2   : 4.69571E-02  (   )
(R is the radius in km and D10 is the distance to the source in units of 10 kpc)
------------------------------------------------------------
#Fit statistic  : Chi-Squared                  121.37     using 59 bins.
 Reduced chi-squared =
# Null hypothesis probability of 1.49e-06 with 57 degrees of freedom

Energy  Fluence     90% Error
[keV]   [erg/cm2]   [erg/cm2]
15- 25  4.927e-08   6.847e-09
25- 50  1.967e-07   2.045e-08
50-150  3.053e-07   4.333e-08
15-150  5.513e-07   5.479e-08
Thermal bremsstrahlung (OTTB)
Spectral model: thermal bremsstrahlung
------------------------------------------------------------
Parameters  : value         Lower 90%    Upper 90%
kT [keV]    : 200.000       (-33.2159      -200)
Norm        : 1.76038       (-0.125577     0.125577)
------------------------------------------------------------
#Fit statistic  : Chi-Squared                   71.47     using 59 bins.
 Reduced chi-squared =
# Null hypothesis probability of 9.40e-02 with 57 degrees of freedom

Energy  Fluence     90% Error
[keV]   [erg/cm2]   [erg/cm2]
15- 25  9.667e-08   7.927e-09
25- 50  1.860e-07   3.423e-08
50-150  4.078e-07   1.212e-07
15-150  6.905e-07   1.643e-07
Double BB
Spectral model: bbodyrad<1> + bbodyrad<2>
------------------------------------------------------------
Parameters  : value         Lower 90%    Upper 90%
kT1 [keV]   : 8.13536        (-1.85495      2.06742)
R1^2/D10^2  : 0.290586        (-0.143777      0.38172)
kT2 [keV]   : 38.6038        (-12.7622      58.0304)
R2^2/D10^2  : 1.66710E-03    (-0.00139165   0.00284099)
------------------------------------------------------------
#Fit statistic  : Chi-Squared                   69.05     using 59 bins.
 Reduced chi-squared =
# Null hypothesis probability of 9.64e-02 with 55 degrees of freedom

Energy  Fluence     90% Error
[keV]   [erg/cm2]   [erg/cm2]
15- 25  8.487e-08   2.027e-08
25- 50  1.888e-07   4.219e-08
50-150  4.861e-07   2.284e-07
15-150  7.597e-07   2.534e-07
Peak spectrum fit
Power-law model
Time interval is from    0.596 sec. to    1.596 sec.

Spectral model in power-law:
------------------------------------------------------------
Parameters  : value       lower 90%   higher 90%
Photon index: 1.46257     ( -0.26299   0.268483 )
Norm@50keV  : 8.04819E-03    ( -0.00123911   0.00122079 )
------------------------------------------------------------
#Fit statistic  : Chi-Squared                   43.95     using 59 bins.
 Reduced chi-squared = 0.771053
# Null hypothesis probability of 8.97e-01 with 57 degrees of freedom

Photon flux (15-150 keV)    in 1 sec: 0.994980 ( -0.146071  0.14619 ) ph/cm2/s
Energy fluence (15-150 keV)             : 7.68493e-08 ( -1.31433e-08  1.33618e-08 ) ergs/cm2
Cutoff power-law model

Time interval is from    0.596 sec. to    1.596 sec.
Spectral model in the cutoff power-law:
------------------------------------------------------------
Parameters  : value       lower 90%   higher 90%
Photon index: 1.45565     ( -0.317304   0.271495 )
Epeak [keV] : 9999.32      ( -9999.36 -9999.36 )
Norm@50keV  : 8.07697E-03    ( -0.0012493   0.0127897 )
------------------------------------------------------------
#Fit statistic  : Chi-Squared                   43.96     using 59 bins.
 Reduced chi-squared = 0.785
# Null hypothesis probability of 8.78e-01 with 56 degrees of freedom

Photon flux (15-150 keV)    in 1 sec: 0.997995 ( -0.157694  0.150125 ) ph/cm2/s
Energy fluence (15-150 keV)             : 7.77141e-08 ( -1.43767e-08  1.23559e-08 ) ergs/cm2
Band function

Time interval is from    0.596 sec. to    1.596 sec.


Spectral model in the Band function:
------------------------------------------------------------
Parameters  : value       lower 90%   higher 90%
alpha       :    (     )
beta        :     (     )
Epeak [keV] :       (   )
Norm@50keV   :     (     )
------------------------------------------------------------

Photon flux (15-150 keV)    in  sec:  (    ) ph/cm2/s
Energy fluence (15-150 keV)             : 0 ( 0  0 ) ergs/cm2
Single BB
Spectral model blackbody:
------------------------------------------------------------
Parameters  : value    Lower 90%  Upper 90%
kT [keV]    : 15.1644  (-3.02027  3.85052)
R^2/D10^2   : 0.107382  (-0.0577517   0.123726)
(R is the radius in km and D10 is the distance to the source in units of 10 kpc)
------------------------------------------------------------
#Fit statistic  : Chi-Squared                   59.92     using 59 bins.
 Reduced chi-squared =
# Null hypothesis probability of 3.70e-01 with 57 degrees of freedom

Energy  Fluence     90% Error
[keV]   [erg/cm2]   [erg/cm2]
15- 25  5.160e-09   1.583e-09
25- 50  2.071e-08   5.385e-09
50-150  3.257e-08   1.058e-08
15-150  5.844e-08   1.379e-08
Thermal bremsstrahlung (OTTB)

Spectral model: thermal bremsstrahlung
------------------------------------------------------------
Parameters  : value         Lower 90%    Upper 90%
kT [keV]    : 199.362       (-83.0722      -199.363)
Norm        : 4.06440       (-0.593263     0.593259)
------------------------------------------------------------
#Fit statistic  : Chi-Squared                   44.87     using 59 bins.
 Reduced chi-squared =
# Null hypothesis probability of 8.78e-01 with 57 degrees of freedom

Energy  Fluence     90% Error
[keV]   [erg/cm2]   [erg/cm2]
15- 25  1.012e-08   5.840e-09
25- 50  1.947e-08   1.099e-08
50-150  4.270e-08   2.421e-08
15-150  7.229e-08   4.046e-08
Double BB
Spectral model: bbodyrad<1> + bbodyrad<2>
------------------------------------------------------------
Parameters  : value         Lower 90%    Upper 90%
kT1 [keV]   : 6.02432        (-2.19448      3.32703)
R1^2/D10^2  : 1.85929        (-1.40811      5.17369)
kT2 [keV]   : 27.9130        (-9.04199      37.27)
R2^2/D10^2  : 1.12678E-02    (-0.0102324   0.0325021)
------------------------------------------------------------
#Fit statistic  : Chi-Squared                   44.05     using 59 bins.
 Reduced chi-squared =
# Null hypothesis probability of 8.55e-01 with 55 degrees of freedom

Energy  Fluence     90% Error
[keV]   [erg/cm2]   [erg/cm2]
15- 25  1.045e-08   5.951e-09
25- 50  1.765e-08   9.300e-09
50-150  4.923e-08   2.812e-08
15-150  7.733e-08   4.017e-08
Pre-slew spectrum (Pre-slew PHA with pre-slew DRM)
Power-law model
Spectral model in power-law:
------------------------------------------------------------
Parameters  : value       lower 90%   higher 90%
Photon index: 1.42592     ( -0.131524   0.131674 )
Norm@50keV  : 3.50490E-03    ( -0.000255731   0.000254788 )
------------------------------------------------------------
#Fit statistic  : Chi-Squared                   67.40     using 59 bins.
 Reduced chi-squared =
# Null hypothesis probability of 1.63e-01 with 57 degrees of freedom

Photon flux (15-150 keV)    in 22.05 sec: 0.429411 ( -0.0312041  0.0312503 ) ph/cm2/s
Energy fluence (15-150 keV)             : 7.42917e-07 ( -6.07868e-08  6.13155e-08 ) ergs/cm2
Cutoff power-law model

Spectral model in the cutoff power-law:
------------------------------------------------------------
Parameters  : value       lower 90%   higher 90%
Photon index: 1.43027     ( -0.390083   0.12833 )
Epeak [keV] : 9999.36      ( -9999.36 -9999.36 )
Norm@50keV  : 3.50363E-03    ( -0.000925503   0.00192072 )
------------------------------------------------------------
#Fit statistic  : Chi-Squared                   67.43     using 59 bins.
 Reduced chi-squared =
# Null hypothesis probability of 1.41e-01 with 56 degrees of freedom

Photon flux (15-150 keV)    in 22.05 sec: 0.429526 ( -0.031458  0.030947 ) ph/cm2/s
Energy fluence (15-150 keV)             : 7.42465e-07 ( -6.19958e-08  6.08382e-08 ) ergs/cm2
Band function
Spectral model in the Band function:
------------------------------------------------------------
Parameters  : value       lower 90%   higher 90%
alpha       :    (     )
beta        :     (     )
Epeak [keV] :       (   )
Norm@50keV   :     (     )
------------------------------------------------------------

Photon flux (15-150 keV)    in  sec:  (    ) ph/cm2/s
Energy fluence (15-150 keV)             : 0 ( 0  0 ) ergs/cm2
S(25-50 keV) vs. S(50-100 keV) plot
S(25-50 keV)  = 1.77e-07
S(50-100 keV) = 2.65e-07
T90 vs. Hardness ratio plot
T90                                   = 19.4479999542236 sec.
Hardness ratio (energy fluence ratio) = 1.49718
Color vs. Color plot
Count Ratio  (25-50 keV) / (15-25 keV) = 1.20663
Count Ratio (50-100 keV) / (15-25 keV) = 0.965585
Mask shadow pattern
IMX = -1.783571186160879E-01, IMY = -1.360920252802561E-01
TIME vs. PHA plot around the trigger time

Blue+Cyan dotted lines: Time interval of the scaled map
From 0.000000 to 1.024000
TIME vs. DetID plot around the trigger time

Blue+Cyan dotted lines: Time interval of the scaled map
From 0.000000 to 1.024000
100 us light curve (15-350 keV)
Blue+Cyan dotted lines: Time interval of the scaled map
From 0.000000 to 1.024000
Spacecraft aspect plot
Bright source in the pre-burst/pre-slew/post-slew images
Pre-burst image of 15-350 keV band
Time interval of the image:
-239.128000 -5.564000

# RAcent  DECcent POSerr Theta    Phi  PeakCts   SNR AngSep     Name
#  [deg]    [deg]    ['] [deg]  [deg]                   [']
299.5865  35.1904    0.6  35.4  155.7  10.9299  18.1    0.7	Cyg X-1
308.1893  41.0349    4.3  27.3  162.7   1.1804   2.7    6.1	Cyg X-3
326.1432  38.1874    9.4  14.3  146.2   0.4250   1.2    8.2	Cyg X-2
354.0541  -5.4229    2.4  46.8   46.4   4.8529   4.9  482.5	UNKNOWN
269.5498  83.3047    3.3  48.1 -129.1   5.6146   3.5 ------	UNKNOWN
Pre-slew background subtracted image of 15-350 keV band
Time interval of the image:
-5.564000 16.484000

# RAcent  DECcent POSerr Theta    Phi  PeakCts   SNR AngSep     Name
#  [deg]    [deg]    ['] [deg]  [deg]                   [']
299.7642  35.3106    6.0  35.2  155.8  -0.1664  -1.9   10.7	Cyg X-1
308.0499  40.8845    7.9  27.4  162.4   0.0982   1.4    4.9	Cyg X-3
326.1548  38.4822    8.2  14.2  147.3   0.0847   1.4    9.7	Cyg X-2
340.4687  16.6829    2.1  24.1   68.9   0.4173   5.5 ------	UNKNOWN
328.4532  37.8578    0.5  12.6  142.7   1.3069  23.2 ------	UNKNOWN
283.8020  46.7014    2.0  43.2  178.8   0.5568   5.8 ------	UNKNOWN
Post-slew image of 15-350 keV band
Time interval of the image:
71.972600 962.961900

# RAcent  DECcent POSerr Theta    Phi  PeakCts   SNR AngSep     Name
#  [deg]    [deg]    ['] [deg]  [deg]                   [']
254.4360  35.4145    4.6  57.8 -160.7 -14.0469  -2.5    4.4	Her X-1
288.6996  10.8177   66.3  44.6  150.4  -0.6476  -0.2    9.6	GRS 1915+105
299.5919  35.1894    0.4  23.2  179.4  37.3832  27.6    0.7	Cyg X-1
308.1528  40.9858    3.9  15.9 -165.2   3.8512   3.0    2.8	Cyg X-3
326.1581  38.1720    7.5   1.8 -171.5   1.8080   1.5    9.0	Cyg X-2
  7.8716   4.8086    1.8  48.8   29.7  16.4865   6.5  553.0	UNKNOWN
258.3148  62.1128    3.3  48.1 -129.2  19.3366   3.5 ------	UNKNOWN
Plot creation:
Sat Sep 30 00:43:22 EDT 2023