Estimated redshift from machine learning (Ukwatta et al. 2016) - may take a few minute to calcaulte
Image
Pre-slew 15.0-350.0 keV image (Event data)

#   RAcent    DECcent   POSerr    Theta     Phi              Peak Cts       SNR   Name
  285.8869    40.8865   0.0078    46.3810  -153.6598         2.2681347     24.677 TRIG_01186032

Foreground time interval of the image:
  0.792  10.093 (delta_t =   9.301 [sec])
Background time interval of the image:
-166.907   0.792 (delta_t = 167.699 [sec])
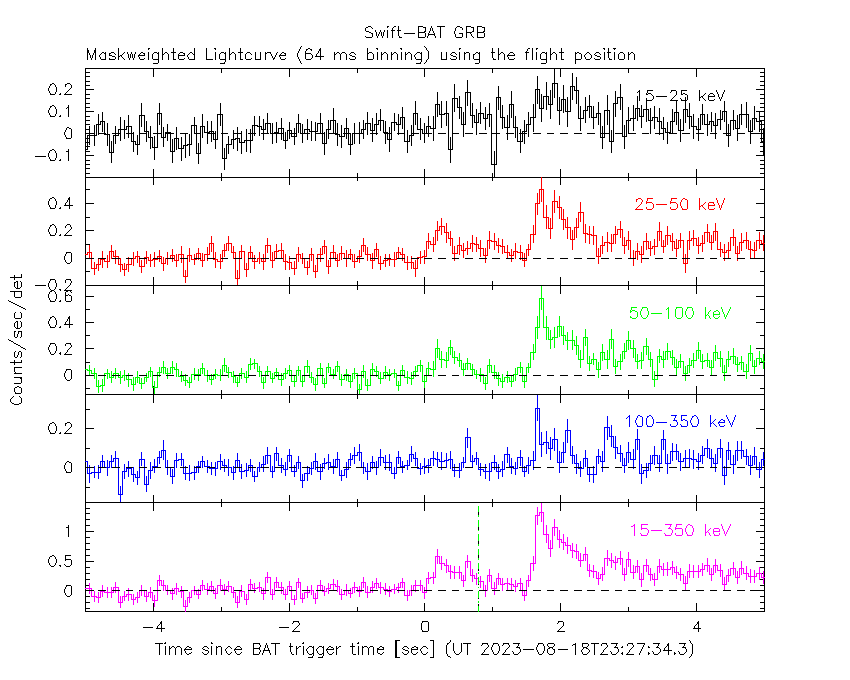
Lightcurves
Notes:
- 1) The mask-weighted light curves are using the flight position.
- 2) Multiple plots of different time binning/intervals are shown to cover all scenarios of short/long GRBs, rate/image triggers, and real/false positives.
- 3) For all the mask-weighted lightcurves, the y-axis units are counts/sec/det where a det is 0.4 x 0.4 = 0.16 sq cm.
- 4) The verticle lines correspond to following: green dotted lines are T50 interval, black dotted lines are T90 interval, blue solid line(s) is a spacecraft slew start time, and orange solid line(s) is a spacecraft slew end time.
- 5) Time of each bin is in the middle of the bin.
1 s binning
From T0-310 s to T0+310 s

From T100_start - 20 s to T100_end + 30 s

Full time interval

64 ms binning
Full time interval

From T100_start to T100_end

From T0-5 sec to T0+5 sec
16 ms binning
From T100_start-5 s to T100_start+5 s

8 ms binning
From T100_start-3 s to T100_start+3 s

2 ms binning
From T100_start-1 s to T100_start+1 s

SN=5 or 10 sec. binning (whichever binning is satisfied first)

SN=5 or 10 sec. binning (T < 200 sec)

Quad-rate summed light curves (from T0-300s to T0+1000s)

Spectral Evolution

Spectra
Notes:
- 1) The fitting includes the systematic errors.
- 2) When the burst includes telescope slew time periods, the fitting uses an average response file made from multiple 5-s response files through out the slew time plus single time preiod for the non-slew times, and weighted by the total counts in the corresponding time period using addrmf. An average response file is needed becuase a spectral fit using the pre-slew DRM will introduce some errors in both a spectral shape and a normalization if the PHA file contains a lot of the slew/post-slew time interval.
- 3) For fits to more complicated models (e.g. a power-law over a cutoff power-law), the BAT team has decided to require a chi-square improvement of more than 6 for each extra dof.
Time averaged spectrum fit using the average DRM
Power-law model

Time interval is from    0.792 sec. to   80.792 sec.

Spectral model in power-law:
------------------------------------------------------------
Parameters  : value       lower 90%   higher 90%
Photon index: 1.42763     ( -0.145604   0.144572 )
Norm@50keV  : 2.80069E-03    ( -0.000233281   0.000233244 )
------------------------------------------------------------
#Fit statistic  : Chi-Squared                   55.17     using 59 bins.
 Reduced chi-squared = 0.967895
# Null hypothesis probability of 5.44e-01 with 57 degrees of freedom

Photon flux (15-150 keV)    in 80 sec: 0.343280 ( -0.030555  0.030661 ) ph/cm2/s
Energy fluence (15-150 keV)             : 2.15338e-06 ( -1.90242e-07  1.91122e-07 ) ergs/cm2
Cutoff power-law model

Time interval is from    0.792 sec. to   80.792 sec.
Spectral model in the cutoff power-law:
------------------------------------------------------------
Parameters  : value       lower 90%   higher 90%
Photon index: 1.26956     ( -0.594077   0.287454 )
Epeak [keV] : 246.426      ( -246.447 -246.447 )
Norm@50keV  : 3.33819E-03    ( -0.000987823   0.003 )
------------------------------------------------------------
#Fit statistic  : Chi-Squared                   54.92     using 59 bins.
 Reduced chi-squared = 0.980714
# Null hypothesis probability of 5.16e-01 with 56 degrees of freedom

Photon flux (15-150 keV)    in 80 sec: 0.340937 ( -0.031552  0.031628 ) ph/cm2/s
Energy fluence (15-150 keV)             : 2.13521e-06 ( -2.02617e-07  1.99647e-07 ) ergs/cm2
Band function

Time interval is from    0.792 sec. to   80.792 sec.


Spectral model in the Band function:
------------------------------------------------------------
Parameters  : value       lower 90%   higher 90%
alpha       :    (     )
beta        :     (     )
Epeak [keV] :       (   )
Norm@50keV   :     (     )
------------------------------------------------------------

Photon flux (15-150 keV)    in  sec:  (    ) ph/cm2/s
Energy fluence (15-150 keV)             : 0 ( 0  0 ) ergs/cm2
Single BB

Spectral model blackbody:
------------------------------------------------------------
Parameters  : value    Lower 90%  Upper 90%
kT [keV]    : 16.4012  (-1.76816  2.08042)
R^2/D10^2   : 2.87410E-02  (-0.00983279   0.0143623)
(R is the radius in km and D10 is the distance to the source in units of 10 kpc)
------------------------------------------------------------
#Fit statistic  : Chi-Squared                   90.29     using 59 bins.
 Reduced chi-squared =
# Null hypothesis probability of 3.27e-03 with 57 degrees of freedom

Energy  Fluence     90% Error
[keV]   [erg/cm2]   [erg/cm2]
15- 25  1.271e-07   2.036e-08
25- 50  5.463e-07   6.760e-08
50-150  1.037e-06   1.520e-07
15-150  1.710e-06   1.872e-07
Thermal bremsstrahlung (OTTB)

Spectral model: thermal bremsstrahlung
------------------------------------------------------------
Parameters  : value         Lower 90%    Upper 90%
kT [keV]    : 200.000       (-35.41      -200)
Norm        : 1.43111       (-0.11952     0.11952)
------------------------------------------------------------
#Fit statistic  : Chi-Squared                   57.63     using 59 bins.
 Reduced chi-squared =
# Null hypothesis probability of 4.52e-01 with 57 degrees of freedom

Energy  Fluence     90% Error
[keV]   [erg/cm2]   [erg/cm2]
15- 25  2.851e-07   3.144e-08
25- 50  5.484e-07   6.160e-08
50-150  1.203e-06   4.791e-07
15-150  2.036e-06   6.364e-07
Double BB

Spectral model: bbodyrad<1> + bbodyrad<2>
------------------------------------------------------------
Parameters  : value         Lower 90%    Upper 90%
kT1 [keV]   : 8.97047        (-1.87663      2.13156)
R1^2/D10^2  : 0.167307        (-0.081137      0.186961)
kT2 [keV]   : 38.7799        (-11.7887      42.4451)
R2^2/D10^2  : 1.20995E-03    (-0.00102586   0.00283751)
------------------------------------------------------------
#Fit statistic  : Chi-Squared                   52.44     using 59 bins.
 Reduced chi-squared =
# Null hypothesis probability of 5.73e-01 with 55 degrees of freedom

Energy  Fluence     90% Error
[keV]   [erg/cm2]   [erg/cm2]
15- 25  2.285e-07   7.400e-08
25- 50  5.724e-07   1.819e-07
50-150  1.360e-06   6.052e-07
15-150  2.161e-06   8.321e-07
Peak spectrum fit
Power-law model

Time interval is from    8.292 sec. to    9.292 sec.

Spectral model in power-law:
------------------------------------------------------------
Parameters  : value       lower 90%   higher 90%
Photon index: 1.97722     ( -1.44531   2.92376 )
Norm@50keV  : 2.82457E-03    ( -0.0027931   0.00270572 )
------------------------------------------------------------
#Fit statistic  : Chi-Squared                   79.65     using 59 bins.
 Reduced chi-squared = 1.39737
# Null hypothesis probability of 2.54e-02 with 57 degrees of freedom

Photon flux (15-150 keV)    in 1 sec: 0.419287 ( -0.351612  0.35201 ) ph/cm2/s
Energy fluence (15-150 keV)             : 2.54877e-08 ( -2.21015e-08  2.57147e-08 ) ergs/cm2
Cutoff power-law model

Time interval is from    8.292 sec. to    9.292 sec.
Spectral model in the cutoff power-law:
------------------------------------------------------------
Parameters  : value       lower 90%   higher 90%
Photon index: -9.98041     ( 9.99145   9.0155 )
Epeak [keV] : 46.8002      ( -9.42537 10.7615 )
Norm@50keV  : 3341.90    ( -3332.21   36537.6 )
------------------------------------------------------------
#Fit statistic  : Chi-Squared                   75.00     using 59 bins.
 Reduced chi-squared = 1.33929
# Null hypothesis probability of 4.59e-02 with 56 degrees of freedom

Photon flux (15-150 keV)    in 1 sec:  (    ) ph/cm2/s
Energy fluence (15-150 keV)             : 2.46093e-08 ( -1.31331e-08  1.8481e-08 ) ergs/cm2
Band function

Time interval is from    8.292 sec. to    9.292 sec.


Spectral model in the Band function:
------------------------------------------------------------
Parameters  : value       lower 90%   higher 90%
alpha       :    (     )
beta        :     (     )
Epeak [keV] :       (   )
Norm@50keV   :     (     )
------------------------------------------------------------

Photon flux (15-150 keV)    in  sec:  (    ) ph/cm2/s
Energy fluence (15-150 keV)             : 0 ( 0  0 ) ergs/cm2
Single BB

Spectral model blackbody:
------------------------------------------------------------
Parameters  : value    Lower 90%  Upper 90%
kT [keV]    : 11.4450  (-4.58494  7.41051)
R^2/D10^2   : 0.158165  (-0.158565   0.787158)
(R is the radius in km and D10 is the distance to the source in units of 10 kpc)
------------------------------------------------------------
#Fit statistic  : Chi-Squared                   77.36     using 59 bins.
 Reduced chi-squared =
# Null hypothesis probability of 3.77e-02 with 57 degrees of freedom

Energy  Fluence     90% Error
[keV]   [erg/cm2]   [erg/cm2]
15- 25  4.358e-09   3.080e-09
25- 50  1.296e-08   9.395e-09
50-150  9.874e-09   8.280e-09
15-150  2.719e-08   2.004e-08
Thermal bremsstrahlung (OTTB)

Spectral model: thermal bremsstrahlung
------------------------------------------------------------
Parameters  : value         Lower 90%    Upper 90%
kT [keV]    : 57.2291       (-56.2914      -56.2914)
Norm        : 2.41546       (-2.41578     6.74852)
------------------------------------------------------------
#Fit statistic  : Chi-Squared                   79.07     using 59 bins.
 Reduced chi-squared =
# Null hypothesis probability of 2.81e-02 with 57 degrees of freedom

Energy  Fluence     90% Error
[keV]   [erg/cm2]   [erg/cm2]
15- 25  6.022e-09   4.449e-09
25- 50  9.030e-09   6.965e-09
50-150  9.873e-09   1.022e-08
15-150  2.492e-08   2.056e-08
Double BB

Spectral model: bbodyrad<1> + bbodyrad<2>
------------------------------------------------------------
Parameters  : value         Lower 90%    Upper 90%
kT1 [keV]   : 0.139843        (13.1599      -0.139843)
R1^2/D10^2  : 81.3683        (-81.4393      -81.4393)
kT2 [keV]   : 11.3883        (-4.59367      7.40163)
R2^2/D10^2  : 0.160971    (-0.159991   0.786483)
------------------------------------------------------------
#Fit statistic  : Chi-Squared                   77.36     using 59 bins.
 Reduced chi-squared =
# Null hypothesis probability of 2.51e-02 with 55 degrees of freedom

Energy  Fluence     90% Error
[keV]   [erg/cm2]   [erg/cm2]
15- 25  0.000e+00   0.000e+00
25- 50  0.000e+00   0.000e+00
50-150  0.000e+00   0.000e+00
15-150  0.000e+00   0.000e+00
Pre-slew spectrum (Pre-slew PHA with pre-slew DRM)
Power-law model

Spectral model in power-law:
------------------------------------------------------------
Parameters  : value       lower 90%   higher 90%
Photon index: 1.28150     ( -0.10535   0.104395 )
Norm@50keV  : 1.69391E-02    ( -0.0010109   0.00100944 )
------------------------------------------------------------
#Fit statistic  : Chi-Squared                   63.80     using 59 bins.
 Reduced chi-squared =
# Null hypothesis probability of 2.50e-01 with 57 degrees of freedom

Photon flux (15-150 keV)    in 9.301 sec: 2.01416 ( -0.129434  0.129853 ) ph/cm2/s
Energy fluence (15-150 keV)             : 1.56403e-06 ( -9.74522e-08  9.76103e-08 ) ergs/cm2
Cutoff power-law model

Spectral model in the cutoff power-law:
------------------------------------------------------------
Parameters  : value       lower 90%   higher 90%
Photon index: 1.14481     ( -0.420184   0.1894 )
Epeak [keV] : 360.120      ( -360.12 -360.12 )
Norm@50keV  : 1.95015E-02    ( -0.00339325   0.0101283 )
------------------------------------------------------------
#Fit statistic  : Chi-Squared                   63.45     using 59 bins.
 Reduced chi-squared =
# Null hypothesis probability of 2.30e-01 with 56 degrees of freedom

Photon flux (15-150 keV)    in 9.301 sec: 2.00055 ( -0.13468  0.13083 ) ph/cm2/s
Energy fluence (15-150 keV)             : 1.55686e-06 ( -1.00841e-07  9.98648e-08 ) ergs/cm2
Band function

Spectral model in the Band function:
------------------------------------------------------------
Parameters  : value       lower 90%   higher 90%
alpha       :    (     )
beta        :     (     )
Epeak [keV] :       (   )
Norm@50keV   :     (     )
------------------------------------------------------------

Photon flux (15-150 keV)    in  sec:  (    ) ph/cm2/s
Energy fluence (15-150 keV)             : 0 ( 0  0 ) ergs/cm2
S(25-50 keV) vs. S(50-100 keV) plot

S(25-50 keV)  = 5.14e-07
S(50-100 keV) = 7.63e-07
T90 vs. Hardness ratio plot

T90                                   = 64 sec.
Hardness ratio (energy fluence ratio) = 1.48444
Color vs. Color plot

Count Ratio  (25-50 keV) / (15-25 keV) = 1.7122
Count Ratio (50-100 keV) / (15-25 keV) = 1.31995
Mask shadow pattern

IMX = -9.404514481017708E-01, IMY = 4.656208230364318E-01
TIME vs. PHA plot around the trigger time

TIME vs. DetID plot around the trigger time

100 us light curve (15-350 keV)

Spacecraft aspect plot

Bright source in the pre-burst/pre-slew/post-slew images
Pre-burst image of 15-350 keV band
Time interval of the image:
-166.907400 0.792000

# RAcent  DECcent POSerr Theta    Phi  PeakCts   SNR AngSep     Name
#  [deg]    [deg]    ['] [deg]  [deg]                   [']
288.6711  11.0848  137.6  36.9  162.8  -0.0325  -0.1   11.2	GRS 1915+105
299.5883  35.1961    0.7  34.3 -151.8   5.8766  16.3    0.3	Cyg X-1
308.0720  40.9605    3.5  34.0 -136.1   1.1729   3.3    1.8	Cyg X-3
326.1230  38.4009    3.6  27.4 -111.4   1.0337   3.2    5.3	Cyg X-2
344.6885 -13.6238    2.4  30.6   32.1   1.8093   4.9 ------	UNKNOWN
350.1011  38.1510    2.7  34.5  -76.9   2.0888   4.3 ------	UNKNOWN
 17.3237  24.0253    3.0  50.0  -43.2   4.5569   3.9 ------	UNKNOWN
Pre-slew background subtracted image of 15-350 keV band
Time interval of the image:
0.792000 10.092590

# RAcent  DECcent POSerr Theta    Phi  PeakCts   SNR AngSep     Name
#  [deg]    [deg]    ['] [deg]  [deg]                   [']
288.7362  10.9321    9.7  36.9  162.6   0.0726   1.2    3.7	GRS 1915+105
299.5267  35.3358  404.1  34.4 -151.7  -0.0015  -0.0    8.6	Cyg X-1
308.0560  41.0073    7.8  34.0 -136.0   0.0932   1.5    4.1	Cyg X-3
326.0552  38.4525    9.2  27.4 -111.5   0.0703   1.3    9.6	Cyg X-2
278.5040   0.1095    2.0  48.8  149.3   0.8451   5.7 ------	UNKNOWN
272.5755   4.4987    2.8  53.6  156.4   0.9174   4.1 ------	UNKNOWN
306.4722  12.9716    2.8  19.5  166.7   0.1760   4.2 ------	UNKNOWN
285.8869  40.8865    0.5  46.4 -153.7   2.2683  24.7 ------	UNKNOWN
Post-slew image of 15-350 keV band
Time interval of the image:
123.492600 1040.923400

# RAcent  DECcent POSerr Theta    Phi  PeakCts   SNR AngSep     Name
#  [deg]    [deg]    ['] [deg]  [deg]                   [']
254.5583  35.2675    6.6  25.2 -137.0   2.4264   1.8    6.7	Her X-1
268.3180  -1.3451    6.7  45.2  160.9  -6.2211  -1.7    7.1	SW J1753.5-0127
289.0163  10.9408    0.0  30.1  129.6   3.7929   2.0   12.8	GRS 1915+105
299.5956  35.1990    0.4  12.2   69.1  33.4006  25.9    0.3	Cyg X-1
307.9533  40.8628    4.9  16.6   38.5   2.8512   2.4    8.9	Cyg X-3
326.2663  38.2785    5.5  30.9   37.1   4.0111   2.1    5.2	Cyg X-2
274.2374  -4.5876    2.3  46.7  151.8  20.4269   5.0 ------	UNKNOWN
345.0792  52.2415    2.6  41.0    8.9   9.0831   4.4 ------	UNKNOWN
 11.6025  55.9259    3.3  55.0   -1.3  11.8192   3.5 ------	UNKNOWN
346.8153  64.7587    2.6  41.5  -10.1   8.3282   4.4 ------	UNKNOWN
246.0969   3.1734    3.9  52.0 -170.1  10.1636   2.9 ------	UNKNOWN
274.7573  85.8093    3.1  45.0  -45.5  13.1583   3.7 ------	UNKNOWN
Plot creation:
Sat Sep 30 00:42:44 EDT 2023