Special notes of this burst
Image
Pre-slew 15.0-350.0 keV image (Event data)
#   RAcent    DECcent   POSerr    Theta     Phi              Peak Cts       SNR   Name
  310.5730    54.0783   0.0090     8.1649    85.9306         0.6632414     21.438 TRIG_00118707

Foreground time interval of the image:
 -6.260   6.784 (delta_t =  13.044 [sec])
Background time interval of the image:
-299.032  -6.260 (delta_t = 292.772 [sec])
Lightcurves
Notes:
- 1) The mask-weighted light curves are using the flight position.
- 2) Multiple plots of different time binning/intervals are shown to cover all scenarios of short/long GRBs, rate/image triggers, and real/false positives.
- 3) For all the mask-weighted lightcurves, the y-axis units are counts/sec/det where a det is 0.4 x 0.4 = 0.16 sq cm.
- 4) The verticle lines correspond to following: green dotted lines are T50 interval, black dotted lines are T90 interval, blue solid line(s) is a spacecraft slew start time, and orange solid line(s) is a spacecraft slew end time.
- 5) Time of each bin is in the middle of the bin.
1 s binning
From T0-310 s to T0+310 s
From T100_start - 20 s to T100_end + 30 s

Full time interval

64 ms binning
Full time interval

From T100_start to T100_end
From T0-5 sec to T0+5 sec
16 ms binning
From T100_start-5 s to T100_start+5 s
Blue+Cyan dotted lines: Time interval of the scaled map
From 0.000000 to 1.024000
8 ms binning
From T100_start-3 s to T100_start+3 s
Blue+Cyan dotted lines: Time interval of the scaled map
From 0.000000 to 1.024000
2 ms binning
From T100_start-1 s to T100_start+1 s

Blue+Cyan dotted lines: Time interval of the scaled map
From 0.000000 to 1.024000
SN=5 or 10 sec. binning (whichever binning is satisfied first)

SN=5 or 10 sec. binning (T < 200 sec)
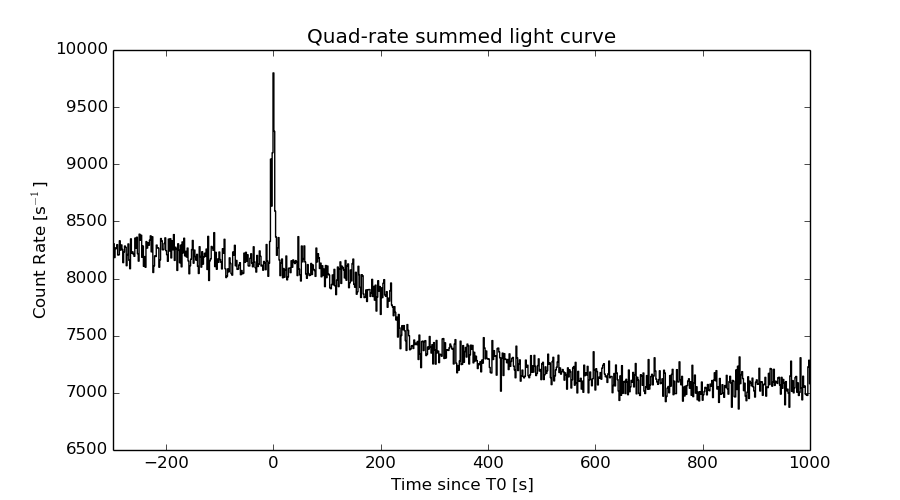
Quad-rate summed light curves (from T0-300s to T0+1000s)
Spectral Evolution

Spectra
Notes:
- 1) The fitting includes the systematic errors.
- 2) When the burst includes telescope slew time periods, the fitting uses an average response file made from multiple 5-s response files through out the slew time plus single time preiod for the non-slew times, and weighted by the total counts in the corresponding time period using addrmf. An average response file is needed becuase a spectral fit using the pre-slew DRM will introduce some errors in both a spectral shape and a normalization if the PHA file contains a lot of the slew/post-slew time interval.
- 3) For fits to more complicated models (e.g. a power-law over a cutoff power-law), the BAT team has decided to require a chi-square improvement of more than 6 for each extra dof.
Time averaged spectrum fit using the average DRM
Power-law model

Time interval is from   -6.260 sec. to    6.784 sec.

Spectral model in power-law:
------------------------------------------------------------
Parameters  : value       lower 90%   higher 90%
Photon index: 2.09007     ( -0.157794   0.165362 )
Norm@50keV  : 2.79228E-03    ( -0.00029228   0.000286046 )
------------------------------------------------------------
#Fit statistic : Chi-Squared =          50.81 using 59 PHA bins.
# Reduced chi-squared =         0.8914 for     57 degrees of freedom
# Null hypothesis probability =   7.051241e-01

Photon flux (15-150 keV)    in 13.04 sec: 0.437157 ( -0.033703  0.0337268 ) ph/cm2/s
Energy fluence (15-150 keV)             : 3.37982e-07 ( -3.14984e-08  3.21227e-08 ) ergs/cm2
Cutoff power-law model

Time interval is from   -6.260 sec. to    6.784 sec.
Spectral model in the cutoff power-law:
------------------------------------------------------------
Parameters  : value       lower 90%   higher 90%
Photon index: 2.11290     ( -0.605687   0.0272499 )
Epeak [keV] : 210.628      (   )
Norm@50keV  : 2.71040E-03    (     )
------------------------------------------------------------
#Fit statistic : Chi-Squared =          50.82 using 59 PHA bins.
# Reduced chi-squared =         0.9076 for     56 degrees of freedom
# Null hypothesis probability =   6.705781e-01

Photon flux (15-150 keV)    in 13.04 sec: 0.436364 ( -0.036363  0.03426 ) ph/cm2/s
Energy fluence (15-150 keV)             : 3.36442e-07 ( -3.8884e-08  3.32311e-08 ) ergs/cm2
Band function

Time interval is from   -6.260 sec. to    6.784 sec.

Spectral model in the Band function:
------------------------------------------------------------
Parameters  : value       lower 90%   higher 90%
alpha       : -1.58828   ( 1.59037   1.59037 )
beta        : -2.08920    ( 2.08952   0.157438 )
Epeak [keV] : 13.3759      ( -12.6831 -12.6831 )
Norm@50keV   : 8.08752E-03    ( -0.00823603   0.410166 )
------------------------------------------------------------
#Fit statistic : Chi-Squared =          50.81 using 59 PHA bins.
# Reduced chi-squared =         0.9239 for     55 degrees of freedom
# Null hypothesis probability =   6.351783e-01

Photon flux (15-150 keV)    in 13.04 sec:  (    ) ph/cm2/s
Energy fluence (15-150 keV)             : 0 ( 0  0 ) ergs/cm2
Single BB

Spectral model blackbody:
------------------------------------------------------------
Parameters  : value    Lower 90%  Upper 90%
kT [keV]    : 9.57621  (-0.924235  1.01433)
R^2/D10^2   : 0.227662  (-0.0733543   0.110079)
(R is the radius in km and D10 is the distance to the source in units of 10 kpc)
------------------------------------------------------------
#Fit statistic : Chi-Squared =          91.69 using 59 PHA bins.
# Reduced chi-squared =          1.609 for     57 degrees of freedom
# Null hypothesis probability =   2.436495e-03

Energy  Fluence     90% Error
[keV]   [erg/cm2]   [erg/cm2]
15- 25  5.455e-08   7.165e-09
25- 50  1.274e-07   1.104e-08
50-150  5.858e-08   1.251e-08
15-150  2.405e-07   2.341e-08
Thermal bremsstrahlung (OTTB)

Spectral model: thermal bremsstrahlung
------------------------------------------------------------
Parameters  : value         Lower 90%    Upper 90%
kT [keV]    : 59.0932       (-13.1771      19.0335)
Norm        : 2.26627       (-0.30571     0.347179)
------------------------------------------------------------
#Fit statistic : Chi-Squared =          54.04 using 59 PHA bins.
# Reduced chi-squared =         0.9481 for     57 degrees of freedom
# Null hypothesis probability =   5.868422e-01

Energy  Fluence     90% Error
[keV]   [erg/cm2]   [erg/cm2]
15- 25  7.409e-08   7.648e-09
25- 50  1.122e-07   9.826e-09
50-150  1.261e-07   2.611e-08
15-150  3.124e-07   3.293e-08
Double BB

Spectral model: bbodyrad<1> + bbodyrad<2>
------------------------------------------------------------
Parameters  : value         Lower 90%    Upper 90%
kT1 [keV]   : 4.20428        (-1.06496      1.40305)
R1^2/D10^2  : 4.18243        (-2.84619      12.7887)
kT2 [keV]   : 15.2022        (-2.76523      5.072)
R2^2/D10^2  : 3.02037E-02    (-0.0208583   0.0394129)
------------------------------------------------------------
#Fit statistic : Chi-Squared =          53.78 using 59 PHA bins.
# Reduced chi-squared =         0.9778 for     55 degrees of freedom
# Null hypothesis probability =   5.213875e-01

Energy  Fluence     90% Error
[keV]   [erg/cm2]   [erg/cm2]
15- 25  8.183e-08   3.703e-08
25- 50  1.026e-07   3.137e-08
50-150  1.214e-07   4.428e-08
15-150  3.058e-07   9.636e-08
Peak spectrum fit
Power-law model

Time interval is from    0.704 sec. to    1.704 sec.

Spectral model in power-law:
------------------------------------------------------------
Parameters  : value       lower 90%   higher 90%
Photon index: 2.08486     ( -0.250412   0.272455 )
Norm@50keV  : 5.65023E-03    ( -0.00106696   0.00103645 )
------------------------------------------------------------
#Fit statistic : Chi-Squared =          47.99 using 59 PHA bins.
# Reduced chi-squared =         0.8419 for     57 degrees of freedom
# Null hypothesis probability =   7.966221e-01

Photon flux (15-150 keV)    in 1 sec: 0.882340 ( -0.117489  0.117492 ) ph/cm2/s
Energy fluence (15-150 keV)             : 5.24223e-08 ( -8.77607e-09  9.08647e-09 ) ergs/cm2
Cutoff power-law model

Time interval is from    0.704 sec. to    1.704 sec.
Spectral model in the cutoff power-law:
------------------------------------------------------------
Parameters  : value       lower 90%   higher 90%
Photon index: 1.68479     ( -1.13446   0.713494 )
Epeak [keV] : 30.9628      ( -20.5025 -30.9595 )
Norm@50keV  : 9.86543E-03    ( -0.00538373   0.0394293 )
------------------------------------------------------------
#Fit statistic : Chi-Squared =          47.44 using 59 PHA bins.
# Reduced chi-squared =         0.8472 for     56 degrees of freedom
# Null hypothesis probability =   7.852696e-01

Photon flux (15-150 keV)    in 1 sec: 0.871544 ( -0.119557  0.119778 ) ph/cm2/s
Energy fluence (15-150 keV)             : 5.00893e-08 ( -9.8473e-09  1.04501e-08 ) ergs/cm2
Band function

Time interval is from    0.704 sec. to    1.704 sec.

Spectral model in the Band function:
------------------------------------------------------------
Parameters  : value       lower 90%   higher 90%
alpha       : 4.95953   ( -4.95953   -4.95953 )
beta        : -2.21868    ( -0.383993   0.299352 )
Epeak [keV] : 20.4695      ( -20.4695 4.57972 )
Norm@50keV   : 3553.49    ( -470.338   8.77316e+06 )
------------------------------------------------------------
#Fit statistic : Chi-Squared =          46.26 using 59 PHA bins.
# Reduced chi-squared =         0.8410 for     55 degrees of freedom
# Null hypothesis probability =   7.933193e-01

Photon flux (15-150 keV)    in 1 sec:  (    ) ph/cm2/s
Energy fluence (15-150 keV)             : 5.12542e-08 ( 0  0 ) ergs/cm2
Single BB

Spectral model blackbody:
------------------------------------------------------------
Parameters  : value    Lower 90%  Upper 90%
kT [keV]    : 8.39793  (-1.40833  1.75064)
R^2/D10^2   : 0.788998  (-0.408919   0.838005)
(R is the radius in km and D10 is the distance to the source in units of 10 kpc)
------------------------------------------------------------
#Fit statistic : Chi-Squared =          60.47 using 59 PHA bins.
# Reduced chi-squared =          1.061 for     57 degrees of freedom
# Null hypothesis probability =   3.516239e-01

Energy  Fluence     90% Error
[keV]   [erg/cm2]   [erg/cm2]
15- 25  1.041e-08   2.485e-09
25- 50  1.978e-08   3.995e-09
50-150  6.078e-09   2.613e-09
15-150  3.627e-08   7.155e-09
Thermal bremsstrahlung (OTTB)

Spectral model: thermal bremsstrahlung
------------------------------------------------------------
Parameters  : value         Lower 90%    Upper 90%
kT [keV]    : 55.5159       (-18.5828      33.6675)
Norm        : 4.80350       (-1.01758     1.34101)
------------------------------------------------------------
#Fit statistic : Chi-Squared =          47.77 using 59 PHA bins.
# Reduced chi-squared =         0.8381 for     57 degrees of freedom
# Null hypothesis probability =   8.030445e-01

Energy  Fluence     90% Error
[keV]   [erg/cm2]   [erg/cm2]
15- 25  1.191e-08   2.026e-09
25- 50  1.768e-08   3.045e-09
50-150  1.883e-08   7.426e-09
15-150  4.842e-08   9.995e-09
Double BB

Spectral model: bbodyrad<1> + bbodyrad<2>
------------------------------------------------------------
Parameters  : value         Lower 90%    Upper 90%
kT1 [keV]   : 5.21039        (-1.4223      1.65225)
R1^2/D10^2  : 3.88497        (-2.50817      9.99506)
kT2 [keV]   : 18.7031        (-5.91685      13.2764)
R2^2/D10^2  : 2.48262E-02    (-0.02154   0.0924808)
------------------------------------------------------------
#Fit statistic : Chi-Squared =          45.92 using 59 PHA bins.
# Reduced chi-squared =         0.8349 for     55 degrees of freedom
# Null hypothesis probability =   8.034313e-01

Energy  Fluence     90% Error
[keV]   [erg/cm2]   [erg/cm2]
15- 25  1.283e-08   6.753e-09
25- 50  1.619e-08   7.621e-09
50-150  2.132e-08   1.334e-08
15-150  5.033e-08   2.620e-08
Pre-slew spectrum (Pre-slew PHA with pre-slew DRM)
Power-law model

Spectral model in power-law:
------------------------------------------------------------
Parameters  : value       lower 90%   higher 90%
Photon index: 2.09007     ( -0.157794   0.165362 )
Norm@50keV  : 2.79228E-03    ( -0.00029228   0.000286046 )
------------------------------------------------------------
#Fit statistic : Chi-Squared =          50.81 using 59 PHA bins.
# Reduced chi-squared =         0.8914 for     57 degrees of freedom
# Null hypothesis probability =   7.051241e-01

Photon flux (15-150 keV)    in 13.04 sec: 0.437157 ( -0.033703  0.0337268 ) ph/cm2/s
Energy fluence (15-150 keV)             : 3.37982e-07 ( -3.14984e-08  3.21227e-08 ) ergs/cm2
Cutoff power-law model

Spectral model in the cutoff power-law:
------------------------------------------------------------
Parameters  : value       lower 90%   higher 90%
Photon index: 2.11290     ( -0.605687   0.0371378 )
Epeak [keV] : 210.628      (   )
Norm@50keV  : 2.71040E-03    (     )
------------------------------------------------------------
#Fit statistic : Chi-Squared =          50.82 using 59 PHA bins.
# Reduced chi-squared =         0.9076 for     56 degrees of freedom
# Null hypothesis probability =   6.705781e-01

Photon flux (15-150 keV)    in 13.04 sec: 0.436364 ( -0.036363  0.03426 ) ph/cm2/s
Energy fluence (15-150 keV)             : 3.36442e-07 ( -3.8884e-08  3.32311e-08 ) ergs/cm2
Band function

Spectral model in the Band function:
------------------------------------------------------------
Parameters  : value       lower 90%   higher 90%
alpha       : -1.58828   ( 1.59037   1.59037 )
beta        : -2.08920    ( 2.08952   0.157438 )
Epeak [keV] : 13.3759      ( -12.6831 -12.6831 )
Norm@50keV   : 8.08752E-03    ( -0.00823603   0.410171 )
------------------------------------------------------------
#Fit statistic : Chi-Squared =          50.81 using 59 PHA bins.
# Reduced chi-squared =         0.9239 for     55 degrees of freedom
# Null hypothesis probability =   6.351783e-01

Photon flux (15-150 keV)    in 13.04 sec:  (    ) ph/cm2/s
Energy fluence (15-150 keV)             : 0 ( 0  0 ) ergs/cm2
S(25-50 keV) vs. S(50-100 keV) plot

S(25-50 keV)  = 1.04e-07
S(50-100 keV) = 9.80e-08
T90 vs. Hardness ratio plot
T90                                   = 10.5079999864101 sec.
Hardness ratio (energy fluence ratio) = 0.942308
Color vs. Color plot

Count Ratio  (25-50 keV) / (15-25 keV) = 0.905929
Count Ratio (50-100 keV) / (15-25 keV) = 0.437506
Mask shadow pattern

IMX = 1.018196477192660E-02, IMY = -1.431157912779417E-01
TIME vs. PHA plot around the trigger time

Blue+Cyan dotted lines: Time interval of the scaled map
From 0.000000 to 1.024000
TIME vs. DetID plot around the trigger time

Blue+Cyan dotted lines: Time interval of the scaled map
From 0.000000 to 1.024000
100 us light curve (15-350 keV)

Blue+Cyan dotted lines: Time interval of the scaled map
From 0.000000 to 1.024000
Spacecraft aspect plot

Bright source in the pre-burst/pre-slew/post-slew images
Pre-burst image of 15-350 keV band
Time interval of the image:
-299.032000 -6.260000

# RAcent  DECcent POSerr Theta    Phi  PeakCts   SNR AngSep     Name
#  [deg]    [deg]    ['] [deg]  [deg]                   [']
299.5932  35.1993    0.3  26.7   52.1   8.3375  33.2    0.2	Cyg X-1
308.1075  40.9515    0.9  18.3   44.8   2.5162  13.0    0.1	Cyg X-3
326.3132  38.4733    4.7  17.3   -2.7   0.5385   2.5   11.3	Cyg X-2
308.0940  37.6833    1.8  21.2   40.3   1.3122   6.4 ------	UNKNOWN
331.7566  65.5324    2.3  10.4 -161.1   0.9148   4.9 ------	UNKNOWN
121.1434  63.9090    3.3  59.0 -166.2   5.4571   3.5 ------	UNKNOWN
Pre-slew background subtracted image of 15-350 keV band
Time interval of the image:
-6.260000 6.784000

# RAcent  DECcent POSerr Theta    Phi  PeakCts   SNR AngSep     Name
#  [deg]    [deg]    ['] [deg]  [deg]                   [']
299.3855  35.2252    5.9  26.7   52.4   0.0831   1.9   10.1	Cyg X-1
308.1228  40.9478  284.2  18.3   44.8  -0.0014  -0.0    0.6	Cyg X-3
326.2207  38.2591    3.8  17.5   -2.4   0.0916   3.0    4.4	Cyg X-2
314.7745  33.9426    2.4  22.8   23.2   0.1585   4.8 ------	UNKNOWN
310.5731  54.0783    0.5   8.2   85.9   0.6632  21.4 ------	UNKNOWN
Post-slew image of 15-350 keV band
Time interval of the image:
38.668600 123.043200

# RAcent  DECcent POSerr Theta    Phi  PeakCts   SNR AngSep     Name
#  [deg]    [deg]    ['] [deg]  [deg]                   [']
288.6947  11.0164    4.4  46.4   45.1   0.9966   2.6    7.4	GRS 1915+105
299.5916  35.1956    0.4  20.4   41.4   2.4741  28.5    0.4	Cyg X-1
308.1380  40.9846    1.3  13.2   23.0   0.7257   8.8    2.3	Cyg X-3
326.0859  38.2898   13.5  19.0  -25.4   0.0725   0.8    4.5	Cyg X-2
277.6394  54.4156    2.2  19.1  119.2   0.4839   5.2 ------	UNKNOWN
308.0495  37.6580    2.4  16.5   21.9   0.3965   4.8 ------	UNKNOWN
338.7310  62.8760    2.3  16.9 -117.8   0.4213   5.0 ------	UNKNOWN
126.0429  66.5020    2.9  59.4 -163.2   2.5790   4.0 ------	UNKNOWN
 34.0792  58.1251    2.6  43.7 -115.9   1.5274   4.4 ------	UNKNOWN
 38.8469  59.8452    2.4  44.8 -119.9   1.6249   4.9 ------	UNKNOWN
 65.4207  64.9324    2.7  51.0 -135.6   2.0357   4.3 ------	UNKNOWN
Plot creation:
Sun May 31 16:49:20 EDT 2015