Special notes of this burst
Image
Pre-slew 15.0-350.0 keV image (Event data)
#   RAcent    DECcent   POSerr    Theta     Phi              Peak Cts       SNR   Name
  189.1205    29.0014   0.0229     7.9627   -46.5137         0.0159783      8.372 TRIG_00118749

Foreground time interval of the image:
  0.000   0.028 (delta_t =   0.028 [sec])
Background time interval of the image:
-299.752   0.000 (delta_t = 299.752 [sec])
Lightcurves
Notes:
- 1) The mask-weighted light curves are using the flight position.
- 2) Multiple plots of different time binning/intervals are shown to cover all scenarios of short/long GRBs, rate/image triggers, and real/false positives.
- 3) For all the mask-weighted lightcurves, the y-axis units are counts/sec/det where a det is 0.4 x 0.4 = 0.16 sq cm.
- 4) The verticle lines correspond to following: green dotted lines are T50 interval, black dotted lines are T90 interval, blue solid line(s) is a spacecraft slew start time, and orange solid line(s) is a spacecraft slew end time.
- 5) Time of each bin is in the middle of the bin.
1 s binning
From T0-310 s to T0+310 s
From T100_start - 20 s to T100_end + 30 s

Full time interval

64 ms binning
Full time interval
From T100_start to T100_end

From T0-5 sec to T0+5 sec
16 ms binning
From T100_start-5 s to T100_start+5 s

Blue+Cyan dotted lines: Time interval of the scaled map
From 0.000000 to 0.128000
8 ms binning
From T100_start-3 s to T100_start+3 s

Blue+Cyan dotted lines: Time interval of the scaled map
From 0.000000 to 0.128000
2 ms binning
From T100_start-1 s to T100_start+1 s
Blue+Cyan dotted lines: Time interval of the scaled map
From 0.000000 to 0.128000
SN=5 or 10 sec. binning (whichever binning is satisfied first)
SN=5 or 10 sec. binning (T < 200 sec)

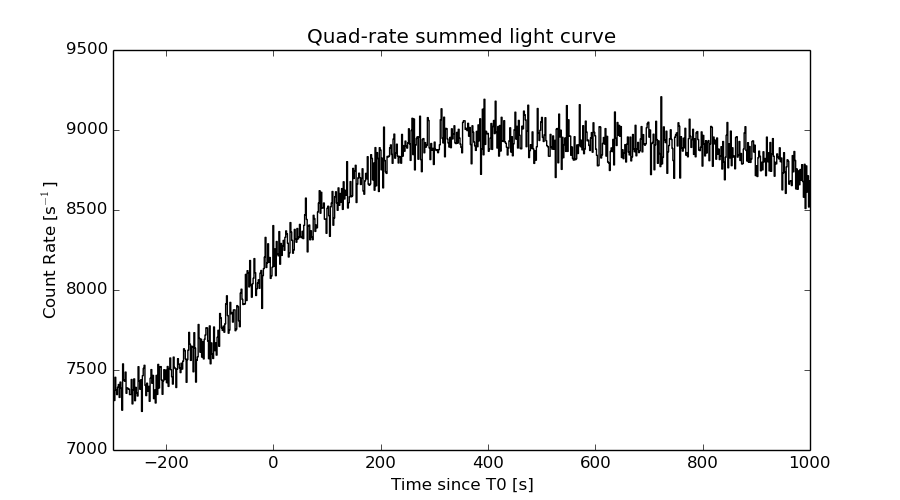
Quad-rate summed light curves (from T0-300s to T0+1000s)
Spectral Evolution

Spectra
Notes:
- 1) The fitting includes the systematic errors.
- 2) When the burst includes telescope slew time periods, the fitting uses an average response file made from multiple 5-s response files through out the slew time plus single time preiod for the non-slew times, and weighted by the total counts in the corresponding time period using addrmf. An average response file is needed becuase a spectral fit using the pre-slew DRM will introduce some errors in both a spectral shape and a normalization if the PHA file contains a lot of the slew/post-slew time interval.
- 3) For fits to more complicated models (e.g. a power-law over a cutoff power-law), the BAT team has decided to require a chi-square improvement of more than 6 for each extra dof.
Time averaged spectrum fit using the average DRM
Power-law model

Time interval is from    0.000 sec. to    0.028 sec.

Spectral model in power-law:
------------------------------------------------------------
Parameters  : value       lower 90%   higher 90%
Photon index: 1.27542     ( -0.405249   0.399023 )
Norm@50keV  : 2.55981E-02    ( -0.00658928   0.00656488 )
------------------------------------------------------------
#Fit statistic : Chi-Squared =          55.54 using 59 PHA bins.
# Reduced chi-squared =         0.9743 for     57 degrees of freedom
# Null hypothesis probability =   5.300914e-01

Photon flux (15-150 keV)    in 0.028 sec: 3.04059 ( -0.779492  0.780738 ) ph/cm2/s
Energy fluence (15-150 keV)             : 7.12555e-09 ( -2.01506e-09  2.0692e-09 ) ergs/cm2
Cutoff power-law model

Time interval is from    0.000 sec. to    0.028 sec.
Spectral model in the cutoff power-law:
------------------------------------------------------------
Parameters  : value       lower 90%   higher 90%
Photon index: -2.47455     ( -6.69073   2.76826 )
Epeak [keV] : 58.0686      ( -9.94937 40.5869 )
Norm@50keV  : 1.97788    (     )
------------------------------------------------------------
#Fit statistic : Chi-Squared =          50.43 using 59 PHA bins.
# Reduced chi-squared =         0.9005 for     56 degrees of freedom
# Null hypothesis probability =   6.848795e-01

Photon flux (15-150 keV)    in 0.028 sec: 2.76626 ( -0.78962  0.80783 ) ph/cm2/s
Energy fluence (15-150 keV)             : 5.85096e-09 ( -1.62378e-09  2.01424e-09 ) ergs/cm2
Band function

Time interval is from    0.000 sec. to    0.028 sec.

Spectral model in the Band function:
------------------------------------------------------------
Parameters  : value       lower 90%   higher 90%
alpha       : 1.97789   ( -1.16861   4.3977 )
beta        : -10.00000    ( 10   1.56015e-06 )
Epeak [keV] : 59.5369      ( -10.5294 40.38 )
Norm@50keV   : 1.14456    ( -0.275118   18.9311 )
------------------------------------------------------------
#Fit statistic : Chi-Squared =          50.49 using 59 PHA bins.
# Reduced chi-squared =         0.9179 for     55 degrees of freedom
# Null hypothesis probability =   6.475213e-01

Photon flux (15-150 keV)    in 0.028 sec:  (    ) ph/cm2/s
Energy fluence (15-150 keV)             : 0 ( 0  0 ) ergs/cm2
Single BB

Spectral model blackbody:
------------------------------------------------------------
Parameters  : value    Lower 90%  Upper 90%
kT [keV]    : 15.6270  (-2.92008  4.12848)
R^2/D10^2   : 0.353302  (-0.202885   0.37557)
(R is the radius in km and D10 is the distance to the source in units of 10 kpc)
------------------------------------------------------------
#Fit statistic : Chi-Squared =          50.59 using 59 PHA bins.
# Reduced chi-squared =         0.8875 for     57 degrees of freedom
# Null hypothesis probability =   7.127646e-01

Energy  Fluence     90% Error
[keV]   [erg/cm2]   [erg/cm2]
15- 25  5.020e-10   2.279e-10
25- 50  2.070e-09   1.012e-09
50-150  3.500e-09   1.793e-09
15-150  6.072e-09   2.537e-09
Thermal bremsstrahlung (OTTB)

Spectral model: thermal bremsstrahlung
------------------------------------------------------------
Parameters  : value         Lower 90%    Upper 90%
kT [keV]    : 199.362       (-100.843      -199.363)
Norm        : 12.5503       (-3.20389     3.20953)
------------------------------------------------------------
#Fit statistic : Chi-Squared =          55.85 using 59 PHA bins.
# Reduced chi-squared =         0.9799 for     57 degrees of freedom
# Null hypothesis probability =   5.181791e-01

Energy  Fluence     90% Error
[keV]   [erg/cm2]   [erg/cm2]
15- 25  8.750e-10   5.321e-10
25- 50  1.683e-09   1.009e-09
50-150  3.692e-09   2.215e-09
15-150  6.250e-09   3.742e-09
Double BB

Spectral model: bbodyrad<1> + bbodyrad<2>
------------------------------------------------------------
Parameters  : value         Lower 90%    Upper 90%
kT1 [keV]   : 1.99246        (-1.96999      19.1841)
R1^2/D10^2  : 263.940        (-316.448      -316.448)
kT2 [keV]   : 15.8523        (-3.0893      -15.8639)
R2^2/D10^2  : 0.331930    (-0.330975   0.386009)
------------------------------------------------------------
#Fit statistic : Chi-Squared =          50.46 using 59 PHA bins.
# Reduced chi-squared =         0.9175 for     55 degrees of freedom
# Null hypothesis probability =   6.485166e-01

Energy  Fluence     90% Error
[keV]   [erg/cm2]   [erg/cm2]
15- 25  5.496e-10   3.196e-10
25- 50  2.022e-09   1.138e-09
50-150  3.535e-09   2.201e-09
15-150  6.107e-09   3.141e-09
Peak spectrum fit
Power-law model

Time interval is from   -0.484 sec. to    0.516 sec.

Spectral model in power-law:
------------------------------------------------------------
Parameters  : value       lower 90%   higher 90%
Photon index: 0.960004     ( -1.47726   1.00524 )
Norm@50keV  : 1.65738E-03    ( -0.00165737   0.000845336 )
------------------------------------------------------------
#Fit statistic : Chi-Squared =          39.12 using 59 PHA bins.
# Reduced chi-squared =         0.6863 for     57 degrees of freedom
# Null hypothesis probability =   9.661161e-01

Photon flux (15-150 keV)    in 1 sec: 0.190461 ( -0.190473  0.101143 ) ph/cm2/s
Energy fluence (15-150 keV)             : 1.81848e-08 ( -9.61456e-09  9.80714e-09 ) ergs/cm2
Cutoff power-law model

Time interval is from   -0.484 sec. to    0.516 sec.
Spectral model in the cutoff power-law:
------------------------------------------------------------
Parameters  : value       lower 90%   higher 90%
Photon index: 4.33706     (     )
Epeak [keV] : 491.057      (   )
Norm@50keV  : 3.59902E-05    (     )
------------------------------------------------------------
#Fit statistic : Chi-Squared =          38.67 using 59 PHA bins.
# Reduced chi-squared =         0.6906 for     56 degrees of freedom
# Null hypothesis probability =   9.624741e-01

Photon flux (15-150 keV)    in 1 sec: 0.192036 ( -0.101603  0.099599 ) ph/cm2/s
Energy fluence (15-150 keV)             : 1.81598e-08 ( -9.5798e-09  9.6751e-09 ) ergs/cm2
Band function
Time interval is from   -0.484 sec. to    0.516 sec.

Spectral model in the Band function:
------------------------------------------------------------
Parameters  : value       lower 90%   higher 90%
alpha       : -0.841772   ( 0.84153   0.84153 )
beta        : -0.960105    ( 0.959947   1.47702 )
Epeak [keV] : 27.9274      ( -28.0329 -28.0329 )
Norm@50keV   : 2.61807E-03    ( -0.00261698   3164.33 )
------------------------------------------------------------
#Fit statistic : Chi-Squared =          39.12 using 59 PHA bins.
# Reduced chi-squared =         0.7113 for     55 degrees of freedom
# Null hypothesis probability =   9.479479e-01

Photon flux (15-150 keV)    in 1 sec:  (    ) ph/cm2/s
Energy fluence (15-150 keV)             : 0 ( 0  0 ) ergs/cm2
Single BB

Spectral model blackbody:
------------------------------------------------------------
Parameters  : value    Lower 90%  Upper 90%
kT [keV]    : 22.2245  (-12.0658  -22.3024)
R^2/D10^2   : 6.36684E-03  (-0.00626413   0.0735068)
(R is the radius in km and D10 is the distance to the source in units of 10 kpc)
------------------------------------------------------------
#Fit statistic : Chi-Squared =          40.47 using 59 PHA bins.
# Reduced chi-squared =         0.7101 for     57 degrees of freedom
# Null hypothesis probability =   9.520439e-01

Energy  Fluence     90% Error
[keV]   [erg/cm2]   [erg/cm2]
15- 25  5.793e-10   4.172e-10
25- 50  3.082e-09   2.088e-09
50-150  1.137e-08   7.690e-09
15-150  1.503e-08   1.089e-08
Thermal bremsstrahlung (OTTB)
Spectral model: thermal bremsstrahlung
------------------------------------------------------------
Parameters  : value         Lower 90%    Upper 90%
kT [keV]    : 199.363       (-199.363      -199.363)
Norm        : 0.788507       (-0.413007     0.413007)
------------------------------------------------------------
#Fit statistic : Chi-Squared =          40.31 using 59 PHA bins.
# Reduced chi-squared =         0.7072 for     57 degrees of freedom
# Null hypothesis probability =   9.539555e-01

Energy  Fluence     90% Error
[keV]   [erg/cm2]   [erg/cm2]
15- 25  1.964e-09   1.425e-09
25- 50  3.777e-09   2.580e-09
50-150  8.284e-09   5.745e-09
15-150  1.402e-08   9.420e-09
Double BB

Spectral model: bbodyrad<1> + bbodyrad<2>
------------------------------------------------------------
Parameters  : value         Lower 90%    Upper 90%
kT1 [keV]   : 0.664873        (-0.666206      78.9586)
R1^2/D10^2  : 1.53743E+08        (-1.42481e+08      5.27862e+12)
kT2 [keV]   : 24.8950        (-13.6223      -25.1087)
R2^2/D10^2  : 4.35946E-03    (-0.00420078   0.00970226)
------------------------------------------------------------
#Fit statistic : Chi-Squared =          38.39 using 59 PHA bins.
# Reduced chi-squared =         0.6981 for     55 degrees of freedom
# Null hypothesis probability =   9.566516e-01

Energy  Fluence     90% Error
[keV]   [erg/cm2]   [erg/cm2]
15- 25  5.780e-10   3.421e-10
25- 50  2.663e-09   1.862e-09
50-150  1.224e-08   8.385e-09
15-150  1.549e-08   1.044e-08
Pre-slew spectrum (Pre-slew PHA with pre-slew DRM)
Power-law model

Spectral model in power-law:
------------------------------------------------------------
Parameters  : value       lower 90%   higher 90%
Photon index: 1.27542     ( -0.405249   0.399023 )
Norm@50keV  : 2.55981E-02    ( -0.00658928   0.00656488 )
------------------------------------------------------------
#Fit statistic : Chi-Squared =          55.54 using 59 PHA bins.
# Reduced chi-squared =         0.9743 for     57 degrees of freedom
# Null hypothesis probability =   5.300914e-01

Photon flux (15-150 keV)    in 0.028 sec: 3.04059 ( -0.779492  0.780738 ) ph/cm2/s
Energy fluence (15-150 keV)             : 7.12555e-09 ( -2.01506e-09  2.0692e-09 ) ergs/cm2
Cutoff power-law model
Spectral model in the cutoff power-law:
------------------------------------------------------------
Parameters  : value       lower 90%   higher 90%
Photon index: -2.47455     ( -6.69073   2.76826 )
Epeak [keV] : 58.0686      ( -9.94937 40.5869 )
Norm@50keV  : 1.97788    (     )
------------------------------------------------------------
#Fit statistic : Chi-Squared =          50.43 using 59 PHA bins.
# Reduced chi-squared =         0.9005 for     56 degrees of freedom
# Null hypothesis probability =   6.848795e-01

Photon flux (15-150 keV)    in 0.028 sec: 2.76626 ( -0.78962  0.80783 ) ph/cm2/s
Energy fluence (15-150 keV)             : 5.85096e-09 ( -1.62378e-09  2.01424e-09 ) ergs/cm2
Band function

Spectral model in the Band function:
------------------------------------------------------------
Parameters  : value       lower 90%   higher 90%
alpha       : 1.97789   ( -1.16861   4.3977 )
beta        : -10.00000    ( 10   1.56015e-06 )
Epeak [keV] : 59.5369      ( -10.5294 40.38 )
Norm@50keV   : 1.14456    ( -0.275118   18.9311 )
------------------------------------------------------------
#Fit statistic : Chi-Squared =          50.49 using 59 PHA bins.
# Reduced chi-squared =         0.9179 for     55 degrees of freedom
# Null hypothesis probability =   6.475213e-01

Photon flux (15-150 keV)    in 0.028 sec:  (    ) ph/cm2/s
Energy fluence (15-150 keV)             : 0 ( 0  0 ) ergs/cm2
S(25-50 keV) vs. S(50-100 keV) plot

S(25-50 keV)  = 1.56e-09
S(50-100 keV) = 2.58e-09
T90 vs. Hardness ratio plot
T90                                   = 0.0240000188350677 sec.
Hardness ratio (energy fluence ratio) = 1.65385
Color vs. Color plot

Count Ratio  (25-50 keV) / (15-25 keV) = 2.43768
Count Ratio (50-100 keV) / (15-25 keV) = 1.69268
Mask shadow pattern

IMX = 9.626120033947863E-02, IMY = 1.014867399437389E-01
TIME vs. PHA plot around the trigger time

Blue+Cyan dotted lines: Time interval of the scaled map
From 0.000000 to 0.128000
TIME vs. DetID plot around the trigger time

Blue+Cyan dotted lines: Time interval of the scaled map
From 0.000000 to 0.128000
100 us light curve (15-350 keV)

Blue+Cyan dotted lines: Time interval of the scaled map
From 0.000000 to 0.128000
Spacecraft aspect plot

Bright source in the pre-burst/pre-slew/post-slew images
Pre-burst image of 15-350 keV band
Time interval of the image:
-299.752000 0.000000

# RAcent  DECcent POSerr Theta    Phi  PeakCts   SNR AngSep     Name
#  [deg]    [deg]    ['] [deg]  [deg]                   [']
201.2637  36.7268    2.6  19.2  -17.8   0.7126   4.5 ------	UNKNOWN
132.7852   8.0696    3.3  55.2 -145.3   4.4709   3.6 ------	UNKNOWN
Pre-slew background subtracted image of 15-350 keV band
Time interval of the image:
0.000000 0.028000

# RAcent  DECcent POSerr Theta    Phi  PeakCts   SNR AngSep     Name
#  [deg]    [deg]    ['] [deg]  [deg]                   [']
216.5109   5.1121    2.6  31.5   66.1   0.0154   4.4 ------	UNKNOWN
189.1205  29.0014    1.4   8.0  -46.5   0.0160   8.4 ------	UNKNOWN
221.6468  49.0151    2.3  38.4  -15.1   0.0137   5.1 ------	UNKNOWN
Post-slew image of 15-350 keV band
Time interval of the image:
36.748600 302.261800

# RAcent  DECcent POSerr Theta    Phi  PeakCts   SNR AngSep     Name
#  [deg]    [deg]    ['] [deg]  [deg]                   [']
139.8005  -6.2636    3.5  59.0 -166.1   3.8537   3.3 ------	UNKNOWN
153.6555  58.2780    3.0  38.1  -77.2   1.8333   3.9 ------	UNKNOWN
Plot creation:
Sun May 31 16:47:28 EDT 2015