Estimated redshift from machine learning (Ukwatta et al. 2016) - may take a few minute to calcaulte
Image
Pre-slew 15.0-350.0 keV image (Event data)
#   RAcent    DECcent   POSerr    Theta     Phi              Peak Cts       SNR   Name
    9.8975   -40.9089   0.0153    28.6584    93.7422         0.4120037     12.600 TRIG_01189514

Foreground time interval of the image:
  0.196   2.932 (delta_t =   2.736 [sec])
Background time interval of the image:
-344.192 -254.138 (delta_t =  90.054 [sec])
-239.192   0.196 (delta_t = 239.388 [sec])
Lightcurves
Notes:
- 1) The mask-weighted light curves are using the flight position.
- 2) Multiple plots of different time binning/intervals are shown to cover all scenarios of short/long GRBs, rate/image triggers, and real/false positives.
- 3) For all the mask-weighted lightcurves, the y-axis units are counts/sec/det where a det is 0.4 x 0.4 = 0.16 sq cm.
- 4) The verticle lines correspond to following: green dotted lines are T50 interval, black dotted lines are T90 interval, blue solid line(s) is a spacecraft slew start time, and orange solid line(s) is a spacecraft slew end time.
- 5) Time of each bin is in the middle of the bin.
1 s binning
From T0-310 s to T0+310 s

From T100_start - 20 s to T100_end + 30 s
Full time interval
64 ms binning
Full time interval
From T100_start to T100_end
From T0-5 sec to T0+5 sec
16 ms binning
From T100_start-5 s to T100_start+5 s
8 ms binning
From T100_start-3 s to T100_start+3 s
2 ms binning
From T100_start-1 s to T100_start+1 s
SN=5 or 10 sec. binning (whichever binning is satisfied first)
SN=5 or 10 sec. binning (T < 200 sec)

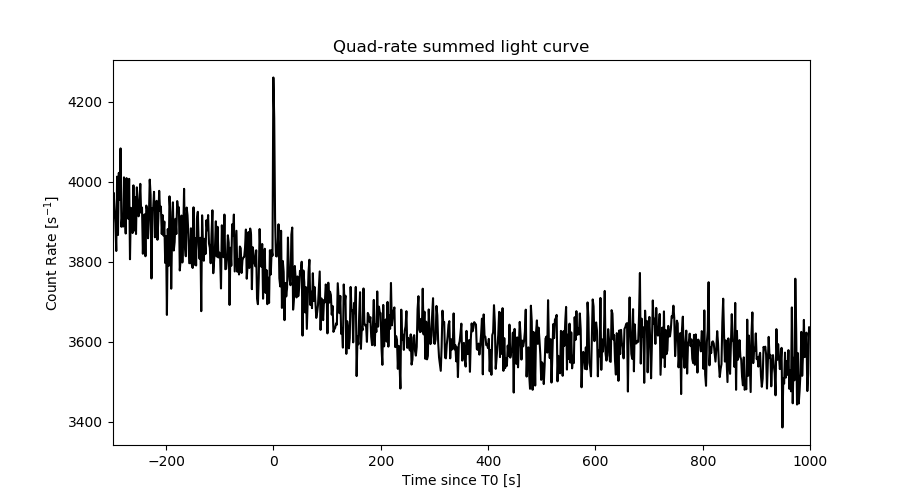
Quad-rate summed light curves (from T0-300s to T0+1000s)
Spectral Evolution

Spectra
Notes:
- 1) The fitting includes the systematic errors.
- 2) When the burst includes telescope slew time periods, the fitting uses an average response file made from multiple 5-s response files through out the slew time plus single time preiod for the non-slew times, and weighted by the total counts in the corresponding time period using addrmf. An average response file is needed becuase a spectral fit using the pre-slew DRM will introduce some errors in both a spectral shape and a normalization if the PHA file contains a lot of the slew/post-slew time interval.
- 3) For fits to more complicated models (e.g. a power-law over a cutoff power-law), the BAT team has decided to require a chi-square improvement of more than 6 for each extra dof.
Time averaged spectrum fit using the average DRM
Power-law model

Time interval is from    0.196 sec. to    2.932 sec.

Spectral model in power-law:
------------------------------------------------------------
Parameters  : value       lower 90%   higher 90%
Photon index: 1.40144     ( -0.209397   0.210199 )
Norm@50keV  : 9.21022E-03    ( -0.00126762   0.0012641 )
------------------------------------------------------------
#Fit statistic  : Chi-Squared                   54.65     using 59 bins.
 Reduced chi-squared = 0.958772
# Null hypothesis probability of 5.64e-01 with 57 degrees of freedom

Photon flux (15-150 keV)    in 2.736 sec: 1.12203 ( -0.154298  0.15456 ) ph/cm2/s
Energy fluence (15-150 keV)             : 2.43442e-07 ( -3.63967e-08  3.6782e-08 ) ergs/cm2
Cutoff power-law model

Time interval is from    0.196 sec. to    2.932 sec.
Spectral model in the cutoff power-law:
------------------------------------------------------------
Parameters  : value       lower 90%   higher 90%
Photon index: -0.677504     ( -1.77143   1.22073 )
Epeak [keV] : 63.1787      ( -10.6464 24.4082 )
Norm@50keV  : 0.104702    ( -0.104718   0.692852 )
------------------------------------------------------------
#Fit statistic  : Chi-Squared                   44.26     using 59 bins.
 Reduced chi-squared = 0.790357
# Null hypothesis probability of 8.72e-01 with 56 degrees of freedom

Photon flux (15-150 keV)    in 2.736 sec: 1.05189 ( -0.161075  0.16068 ) ph/cm2/s
Energy fluence (15-150 keV)             : 2.14633e-07 ( -3.79453e-08  4.00829e-08 ) ergs/cm2
Band function

Time interval is from    0.196 sec. to    2.932 sec.


Spectral model in the Band function:
------------------------------------------------------------
Parameters  : value       lower 90%   higher 90%
alpha       :    (     )
beta        :     (     )
Epeak [keV] :       (   )
Norm@50keV   :     (     )
------------------------------------------------------------

Photon flux (15-150 keV)    in  sec:  (    ) ph/cm2/s
Energy fluence (15-150 keV)             : 0 ( 0  0 ) ergs/cm2
Single BB

Spectral model blackbody:
------------------------------------------------------------
Parameters  : value    Lower 90%  Upper 90%
kT [keV]    : 15.1241  (-1.88658  2.2484)
R^2/D10^2   : 0.137142  (-0.0534826   0.0820523)
(R is the radius in km and D10 is the distance to the source in units of 10 kpc)
------------------------------------------------------------
#Fit statistic  : Chi-Squared                   45.06     using 59 bins.
 Reduced chi-squared =
# Null hypothesis probability of 8.74e-01 with 57 degrees of freedom

Energy  Fluence     90% Error
[keV]   [erg/cm2]   [erg/cm2]
15- 25  1.794e-08   4.352e-09
25- 50  7.184e-08   1.220e-08
50-150  1.122e-07   3.055e-08
15-150  2.020e-07   3.270e-08
Thermal bremsstrahlung (OTTB)

Spectral model: thermal bremsstrahlung
------------------------------------------------------------
Parameters  : value         Lower 90%    Upper 90%
kT [keV]    : 200.000       (-69.5812      -200)
Norm        : 4.67744       (-0.629812     0.629812)
------------------------------------------------------------
#Fit statistic  : Chi-Squared                   52.78     using 59 bins.
 Reduced chi-squared =
# Null hypothesis probability of 6.34e-01 with 57 degrees of freedom

Energy  Fluence     90% Error
[keV]   [erg/cm2]   [erg/cm2]
15- 25  3.187e-08   1.818e-08
25- 50  6.131e-08   3.435e-08
50-150  1.345e-07   7.461e-08
15-150  2.276e-07   1.265e-07
Double BB

Spectral model: bbodyrad<1> + bbodyrad<2>
------------------------------------------------------------
Parameters  : value         Lower 90%    Upper 90%
kT1 [keV]   : 31.0214        (-31.1534      -31.1534)
R1^2/D10^2  : 3.92862E-03        (-0.00358135      0.189072)
kT2 [keV]   : 12.6871        (-12.7214      3.97867)
R2^2/D10^2  : 0.197740    (-0.196864   -0.196864)
------------------------------------------------------------
#Fit statistic  : Chi-Squared                   43.76     using 59 bins.
 Reduced chi-squared =
# Null hypothesis probability of 8.62e-01 with 55 degrees of freedom

Energy  Fluence     90% Error
[keV]   [erg/cm2]   [erg/cm2]
15- 25  2.077e-08   6.703e-09
25- 50  6.963e-08   2.271e-08
50-150  1.154e-07   3.945e-08
15-150  2.058e-07   5.525e-08
Peak spectrum fit
Power-law model
Time interval is from    0.496 sec. to    1.496 sec.

Spectral model in power-law:
------------------------------------------------------------
Parameters  : value       lower 90%   higher 90%
Photon index: 1.44404     ( -0.286498   0.291337 )
Norm@50keV  : 1.07037E-02    ( -0.00210759   0.00209862 )
------------------------------------------------------------
#Fit statistic  : Chi-Squared                   63.40     using 59 bins.
 Reduced chi-squared = 1.11228
# Null hypothesis probability of 2.61e-01 with 57 degrees of freedom

Photon flux (15-150 keV)    in 1 sec: 1.31709 ( -0.25746  0.25794 ) ph/cm2/s
Energy fluence (15-150 keV)             : 1.0257e-07 ( -2.16436e-08  2.19331e-08 ) ergs/cm2
Cutoff power-law model
Time interval is from    0.496 sec. to    1.496 sec.
Spectral model in the cutoff power-law:
------------------------------------------------------------
Parameters  : value       lower 90%   higher 90%
Photon index: -0.610635     ( -2.4589   1.51318 )
Epeak [keV] : 61.2124      ( -13.3617 42.1045 )
Norm@50keV  : 0.124388    ( -0.125894   2.14179 )
------------------------------------------------------------
#Fit statistic  : Chi-Squared                   57.22     using 59 bins.
 Reduced chi-squared = 1.02179
# Null hypothesis probability of 4.30e-01 with 56 degrees of freedom

Photon flux (15-150 keV)    in 1 sec: 1.25430 ( -0.263157  0.26357 ) ph/cm2/s
Energy fluence (15-150 keV)             : 9.12935e-08 ( -2.21868e-08  2.38448e-08 ) ergs/cm2
Band function

Time interval is from    0.496 sec. to    1.496 sec.


Spectral model in the Band function:
------------------------------------------------------------
Parameters  : value       lower 90%   higher 90%
alpha       :    (     )
beta        :     (     )
Epeak [keV] :       (   )
Norm@50keV   :     (     )
------------------------------------------------------------

Photon flux (15-150 keV)    in  sec:  (    ) ph/cm2/s
Energy fluence (15-150 keV)             : 0 ( 0  0 ) ergs/cm2
Single BB
Spectral model blackbody:
------------------------------------------------------------
Parameters  : value    Lower 90%  Upper 90%
kT [keV]    : 14.5948  (-2.53664  3.22747)
R^2/D10^2   : 0.183153  (-0.0936741   0.175172)
(R is the radius in km and D10 is the distance to the source in units of 10 kpc)
------------------------------------------------------------
#Fit statistic  : Chi-Squared                   57.78     using 59 bins.
 Reduced chi-squared =
# Null hypothesis probability of 4.46e-01 with 57 degrees of freedom

Energy  Fluence     90% Error
[keV]   [erg/cm2]   [erg/cm2]
15- 25  8.202e-09   2.543e-09
25- 50  3.176e-08   9.470e-09
50-150  4.547e-08   1.870e-08
15-150  8.544e-08   2.317e-08
Thermal bremsstrahlung (OTTB)
Spectral model: thermal bremsstrahlung
------------------------------------------------------------
Parameters  : value         Lower 90%    Upper 90%
kT [keV]    : 199.363       (-100.633      -199.363)
Norm        : 5.50750       (-1.05073     1.05098)
------------------------------------------------------------
#Fit statistic  : Chi-Squared                   61.79     using 59 bins.
 Reduced chi-squared =
# Null hypothesis probability of 3.09e-01 with 57 degrees of freedom

Energy  Fluence     90% Error
[keV]   [erg/cm2]   [erg/cm2]
15- 25  1.371e-08   8.105e-09
25- 50  2.638e-08   1.515e-08
50-150  5.786e-08   3.302e-08
15-150  9.795e-08   5.630e-08
Double BB
Spectral model: bbodyrad<1> + bbodyrad<2>
------------------------------------------------------------
Parameters  : value         Lower 90%    Upper 90%
kT1 [keV]   : 11.5546        (-11.6436      -11.6436)
R1^2/D10^2  : 0.291693        (-0.287248      -0.287248)
kT2 [keV]   : 25.8495        (-27.3965      -27.3965)
R2^2/D10^2  : 1.03125E-02    (-0.007507   0.312491)
------------------------------------------------------------
#Fit statistic  : Chi-Squared                   56.94     using 59 bins.
 Reduced chi-squared =
# Null hypothesis probability of 4.03e-01 with 55 degrees of freedom

Energy  Fluence     90% Error
[keV]   [erg/cm2]   [erg/cm2]
15- 25  9.379e-09   7.540e-09
25- 50  3.145e-08   2.894e-08
50-150  5.272e-08   6.105e-08
15-150  9.355e-08   9.950e-08
Pre-slew spectrum (Pre-slew PHA with pre-slew DRM)
Power-law model

Spectral model in power-law:
------------------------------------------------------------
Parameters  : value       lower 90%   higher 90%
Photon index: 1.40144     ( -0.209397   0.210199 )
Norm@50keV  : 9.21022E-03    ( -0.00126762   0.0012641 )
------------------------------------------------------------
#Fit statistic  : Chi-Squared                   54.65     using 59 bins.
 Reduced chi-squared =
# Null hypothesis probability of 5.64e-01 with 57 degrees of freedom

Photon flux (15-150 keV)    in 2.736 sec: 1.12202 ( -0.154302  0.154543 ) ph/cm2/s
Energy fluence (15-150 keV)             : 2.43409e-07 ( -3.6382e-08  3.67995e-08 ) ergs/cm2
Cutoff power-law model
Spectral model in the cutoff power-law:
------------------------------------------------------------
Parameters  : value       lower 90%   higher 90%
Photon index: -0.677514     ( -1.77142   1.22073 )
Epeak [keV] : 63.1786      ( -10.6464 24.4082 )
Norm@50keV  : 0.104703    ( -0.104719   0.692851 )
------------------------------------------------------------
#Fit statistic  : Chi-Squared                   44.26     using 59 bins.
 Reduced chi-squared =
# Null hypothesis probability of 8.72e-01 with 56 degrees of freedom

Photon flux (15-150 keV)    in 2.736 sec: 1.05183 ( -0.161064  0.16065 ) ph/cm2/s
Energy fluence (15-150 keV)             : 2.14705e-07 ( -3.80214e-08  4.01081e-08 ) ergs/cm2
Band function
Spectral model in the Band function:
------------------------------------------------------------
Parameters  : value       lower 90%   higher 90%
alpha       :    (     )
beta        :     (     )
Epeak [keV] :       (   )
Norm@50keV   :     (     )
------------------------------------------------------------

Photon flux (15-150 keV)    in  sec:  (    ) ph/cm2/s
Energy fluence (15-150 keV)             : 0 ( 0  0 ) ergs/cm2
S(25-50 keV) vs. S(50-100 keV) plot
S(25-50 keV)  = 5.72e-08
S(50-100 keV) = 8.67e-08
T90 vs. Hardness ratio plot
T90                                   = 2.53599989414215 sec.
Hardness ratio (energy fluence ratio) = 1.51573
Color vs. Color plot
Count Ratio  (25-50 keV) / (15-25 keV) = 1.99044
Count Ratio (50-100 keV) / (15-25 keV) = 1.38443
Mask shadow pattern

IMX = -3.567144706682876E-02, IMY = -5.453748491462346E-01
TIME vs. PHA plot around the trigger time

TIME vs. DetID plot around the trigger time
100 us light curve (15-350 keV)
Spacecraft aspect plot
Bright source in the pre-burst/pre-slew/post-slew images
Pre-burst image of 15-350 keV band
Time interval of the image:
-344.192000 -254.138200
-239.192000 0.196000

# RAcent  DECcent POSerr Theta    Phi  PeakCts   SNR AngSep     Name
#  [deg]    [deg]    ['] [deg]  [deg]                   [']
298.4262 -62.6125    2.7  43.5   13.3   3.6914   4.2 ------	UNKNOWN
191.4203 -84.6742    2.6  33.1  -32.1   2.6472   4.5 ------	UNKNOWN
 81.4884 -25.7539    3.0  44.2 -153.3   3.1476   3.9 ------	UNKNOWN
123.5538 -64.0929    2.7  34.4  -76.7   3.4448   4.3 ------	UNKNOWN
100.9292 -30.9553    2.3  48.0 -129.0  10.4959   5.2 ------	UNKNOWN
Pre-slew background subtracted image of 15-350 keV band
Time interval of the image:
0.196000 2.932000

# RAcent  DECcent POSerr Theta    Phi  PeakCts   SNR AngSep     Name
#  [deg]    [deg]    ['] [deg]  [deg]                   [']
  9.8975 -40.9089    0.9  28.7   93.7   0.4121  12.6 ------	UNKNOWN
 69.9783  -8.7153    2.6  56.5 -174.4   0.3447   4.5 ------	UNKNOWN
171.3015 -81.5121    2.3  34.3  -38.9   0.1280   5.1 ------	UNKNOWN
101.2771 -35.0241    2.3  44.8 -125.6   0.3295   4.9 ------	UNKNOWN
Post-slew image of 15-350 keV band
Time interval of the image:
94.908590 961.808600

# RAcent  DECcent POSerr Theta    Phi  PeakCts   SNR AngSep     Name
#  [deg]    [deg]    ['] [deg]  [deg]                   [']
345.9990 -33.1766    2.6  20.5   58.5   5.3695   4.3 ------	UNKNOWN
308.2330 -47.7598    2.6  43.4   13.3   9.0753   4.4 ------	UNKNOWN
345.1778 -71.6926    2.4  33.1  -32.1   6.4403   4.8 ------	UNKNOWN
342.8014 -75.5913    2.5  36.7  -35.1   6.7678   4.7 ------	UNKNOWN
Plot creation:
Sat Sep 30 00:41:24 EDT 2023