Estimated redshift from machine learning (Ukwatta et al. 2016) - may take a few minute to calcaulte
Image
Pre-slew 15.0-350.0 keV image (Event data)
#   RAcent    DECcent   POSerr    Theta     Phi              Peak Cts       SNR   Name
  226.8013   -41.3526   0.0154    12.8433   -53.3051         0.6973701     12.439 TRIG_01191188

Foreground time interval of the image:
 -8.632   9.584 (delta_t =  18.216 [sec])
Background time interval of the image:
-239.504  -8.632 (delta_t = 230.872 [sec])
Lightcurves
Notes:
- 1) The mask-weighted light curves are using the flight position.
- 2) Multiple plots of different time binning/intervals are shown to cover all scenarios of short/long GRBs, rate/image triggers, and real/false positives.
- 3) For all the mask-weighted lightcurves, the y-axis units are counts/sec/det where a det is 0.4 x 0.4 = 0.16 sq cm.
- 4) The verticle lines correspond to following: green dotted lines are T50 interval, black dotted lines are T90 interval, blue solid line(s) is a spacecraft slew start time, and orange solid line(s) is a spacecraft slew end time.
- 5) Time of each bin is in the middle of the bin.
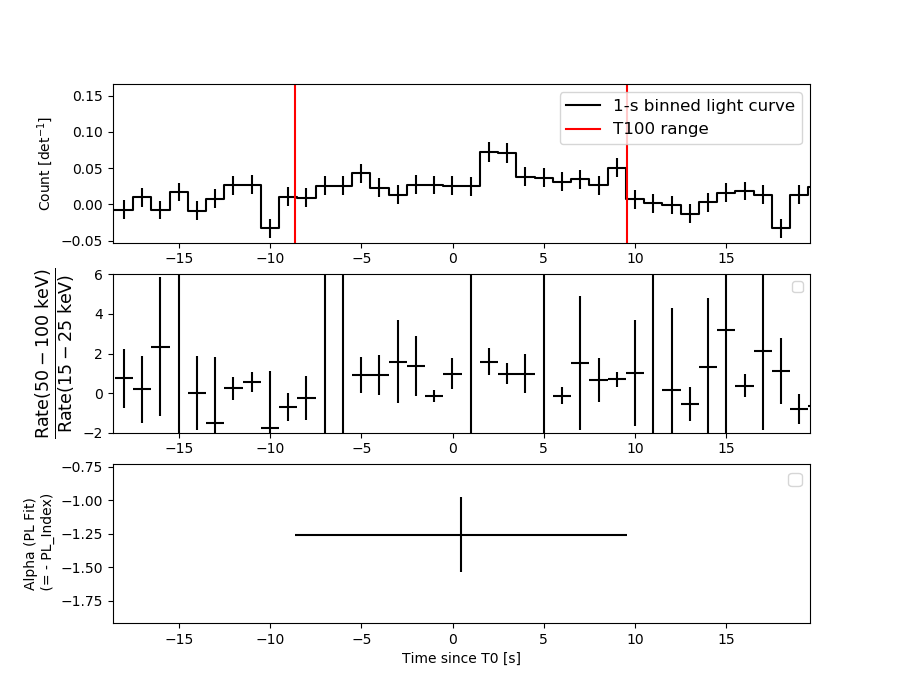
1 s binning
From T0-310 s to T0+310 s
From T100_start - 20 s to T100_end + 30 s

Full time interval
64 ms binning
Full time interval
From T100_start to T100_end
From T0-5 sec to T0+5 sec

16 ms binning
From T100_start-5 s to T100_start+5 s
8 ms binning
From T100_start-3 s to T100_start+3 s

2 ms binning
From T100_start-1 s to T100_start+1 s

SN=5 or 10 sec. binning (whichever binning is satisfied first)

SN=5 or 10 sec. binning (T < 200 sec)
Quad-rate summed light curves (from T0-300s to T0+1000s)

Spectral Evolution
Spectra
Notes:
- 1) The fitting includes the systematic errors.
- 2) When the burst includes telescope slew time periods, the fitting uses an average response file made from multiple 5-s response files through out the slew time plus single time preiod for the non-slew times, and weighted by the total counts in the corresponding time period using addrmf. An average response file is needed becuase a spectral fit using the pre-slew DRM will introduce some errors in both a spectral shape and a normalization if the PHA file contains a lot of the slew/post-slew time interval.
- 3) For fits to more complicated models (e.g. a power-law over a cutoff power-law), the BAT team has decided to require a chi-square improvement of more than 6 for each extra dof.
Time averaged spectrum fit using the average DRM
Power-law model

Time interval is from   -8.632 sec. to    9.584 sec.

Spectral model in power-law:
------------------------------------------------------------
Parameters  : value       lower 90%   higher 90%
Photon index: 1.26018     ( -0.281538   0.273434 )
Norm@50keV  : 2.09318E-03    ( -0.000309166   0.000309166 )
------------------------------------------------------------
#Fit statistic  : Chi-Squared                   56.28     using 59 bins.
 Reduced chi-squared = 0.987368
# Null hypothesis probability of 5.02e-01 with 57 degrees of freedom

Photon flux (15-150 keV)    in 18.22 sec: 0.247984 ( -0.038259  0.038472 ) ph/cm2/s
Energy fluence (15-150 keV)             : 3.80714e-07 ( -6.20316e-08  6.26988e-08 ) ergs/cm2
Cutoff power-law model

Time interval is from   -8.632 sec. to    9.584 sec.
Spectral model in the cutoff power-law:
------------------------------------------------------------
Parameters  : value       lower 90%   higher 90%
Photon index: 1.25627     ( -0.8424   1.93747 )
Epeak [keV] : 1.00000E+04      ( -10000 -10000 )
Norm@50keV  : 2.10237E-03    ( -0.000310556   -0.00210243 )
------------------------------------------------------------
#Fit statistic  : Chi-Squared                   56.28     using 59 bins.
 Reduced chi-squared = 1.005
# Null hypothesis probability of 4.64e-01 with 56 degrees of freedom

Photon flux (15-150 keV)    in 18.22 sec: 0.248967 ( -0.041502  0.039324 ) ph/cm2/s
Energy fluence (15-150 keV)             : 3.82181e-07 ( -6.7907e-08  6.40692e-08 ) ergs/cm2
Band function

Time interval is from   -8.632 sec. to    9.584 sec.


Spectral model in the Band function:
------------------------------------------------------------
Parameters  : value       lower 90%   higher 90%
alpha       :    (     )
beta        :     (     )
Epeak [keV] :       (   )
Norm@50keV   :     (     )
------------------------------------------------------------

Photon flux (15-150 keV)    in  sec:  (    ) ph/cm2/s
Energy fluence (15-150 keV)             : 0 ( 0  0 ) ergs/cm2
Single BB
Spectral model blackbody:
------------------------------------------------------------
Parameters  : value    Lower 90%  Upper 90%
kT [keV]    : 19.9498  (-4.12184  5.4422)
R^2/D10^2   : 1.09292E-02  (-0.00587744   0.012634)
(R is the radius in km and D10 is the distance to the source in units of 10 kpc)
------------------------------------------------------------
#Fit statistic  : Chi-Squared                   69.79     using 59 bins.
 Reduced chi-squared =
# Null hypothesis probability of 1.19e-01 with 57 degrees of freedom

Energy  Fluence     90% Error
[keV]   [erg/cm2]   [erg/cm2]
15- 25  1.529e-08   4.814e-09
25- 50  7.605e-08   2.073e-08
50-150  2.243e-07   6.619e-08
15-150  3.156e-07   7.680e-08
Thermal bremsstrahlung (OTTB)

Spectral model: thermal bremsstrahlung
------------------------------------------------------------
Parameters  : value         Lower 90%    Upper 90%
kT [keV]    : 200.000       (-56.545      -200)
Norm        : 1.03253       (-0.15493     0.15493)
------------------------------------------------------------
#Fit statistic  : Chi-Squared                   60.03     using 59 bins.
 Reduced chi-squared =
# Null hypothesis probability of 3.66e-01 with 57 degrees of freedom

Energy  Fluence     90% Error
[keV]   [erg/cm2]   [erg/cm2]
15- 25  4.685e-08   2.684e-08
25- 50  9.012e-08   5.031e-08
50-150  1.977e-07   1.117e-07
15-150  3.346e-07   1.868e-07
Double BB
Spectral model: bbodyrad<1> + bbodyrad<2>
------------------------------------------------------------
Parameters  : value         Lower 90%    Upper 90%
kT1 [keV]   : 6.62142        (-2.21224      3.05328)
R1^2/D10^2  : 0.300953        (-0.222297      0.632462)
kT2 [keV]   : 32.4941        (-9.64497      30.2326)
R2^2/D10^2  : 1.99370E-03    (-0.00165643   0.00424429)
------------------------------------------------------------
#Fit statistic  : Chi-Squared                   54.72     using 59 bins.
 Reduced chi-squared =
# Null hypothesis probability of 4.85e-01 with 55 degrees of freedom

Energy  Fluence     90% Error
[keV]   [erg/cm2]   [erg/cm2]
15- 25  4.203e-08   2.438e-08
25- 50  8.087e-08   4.356e-08
50-150  2.674e-07   1.509e-07
15-150  3.903e-07   2.063e-07
Peak spectrum fit
Power-law model

Time interval is from    2.072 sec. to    3.072 sec.

Spectral model in power-law:
------------------------------------------------------------
Parameters  : value       lower 90%   higher 90%
Photon index: 1.90608     ( -0.512923   0.600111 )
Norm@50keV  : 4.52860E-03    ( -0.00160889   0.00147091 )
------------------------------------------------------------
#Fit statistic  : Chi-Squared                   57.57     using 59 bins.
 Reduced chi-squared = 1.01
# Null hypothesis probability of 4.54e-01 with 57 degrees of freedom

Photon flux (15-150 keV)    in 1 sec: 0.651628 ( -0.173023  0.173132 ) ph/cm2/s
Energy fluence (15-150 keV)             : 4.16438e-08 ( -1.3471e-08  1.41248e-08 ) ergs/cm2
Cutoff power-law model
Time interval is from    2.072 sec. to    3.072 sec.
Spectral model in the cutoff power-law:
------------------------------------------------------------
Parameters  : value       lower 90%   higher 90%
Photon index: 1.91705     ( -0.524487   1.00776 )
Epeak [keV] : 9999.32      ( -9999.35 -9999.36 )
Norm@50keV  : 4.49569E-03    ( -0.00452011   0.0205106 )
------------------------------------------------------------
#Fit statistic  : Chi-Squared                   57.57     using 59 bins.
 Reduced chi-squared = 1.02804
# Null hypothesis probability of 4.17e-01 with 56 degrees of freedom

Photon flux (15-150 keV)    in 1 sec: 0.652626 ( -0.174534  0.172458 ) ph/cm2/s
Energy fluence (15-150 keV)             : 3.92022e-08 ( -3.6428e-08  1.30615e-08 ) ergs/cm2
Band function

Time interval is from    2.072 sec. to    3.072 sec.


Spectral model in the Band function:
------------------------------------------------------------
Parameters  : value       lower 90%   higher 90%
alpha       :    (     )
beta        :     (     )
Epeak [keV] :       (   )
Norm@50keV   :     (     )
------------------------------------------------------------

Photon flux (15-150 keV)    in  sec:  (    ) ph/cm2/s
Energy fluence (15-150 keV)             : 0 ( 0  0 ) ergs/cm2
Single BB
Spectral model blackbody:
------------------------------------------------------------
Parameters  : value    Lower 90%  Upper 90%
kT [keV]    : 12.4422  (-4.23724  5.66092)
R^2/D10^2   : 0.131311  (-0.129837   0.472162)
(R is the radius in km and D10 is the distance to the source in units of 10 kpc)
------------------------------------------------------------
#Fit statistic  : Chi-Squared                   63.04     using 59 bins.
 Reduced chi-squared =
# Null hypothesis probability of 2.71e-01 with 57 degrees of freedom

Energy  Fluence     90% Error
[keV]   [erg/cm2]   [erg/cm2]
15- 25  4.309e-09   2.714e-09
25- 50  1.414e-08   8.650e-09
50-150  1.347e-08   9.010e-09
15-150  3.192e-08   1.961e-08
Thermal bremsstrahlung (OTTB)

Spectral model: thermal bremsstrahlung
------------------------------------------------------------
Parameters  : value         Lower 90%    Upper 90%
kT [keV]    : 90.0075       (-53.6914      -90.0075)
Norm        : 2.92513       (-0.949652     1.67929)
------------------------------------------------------------
#Fit statistic  : Chi-Squared                   58.09     using 59 bins.
 Reduced chi-squared =
# Null hypothesis probability of 4.35e-01 with 57 degrees of freedom

Energy  Fluence     90% Error
[keV]   [erg/cm2]   [erg/cm2]
15- 25  7.632e-09   4.085e-09
25- 50  1.291e-08   7.875e-09
50-150  1.966e-08   1.561e-08
15-150  4.020e-08   2.743e-08
Double BB
Spectral model: bbodyrad<1> + bbodyrad<2>
------------------------------------------------------------
Parameters  : value         Lower 90%    Upper 90%
kT1 [keV]   : 2.85740        (-1.95258      3.33159)
R1^2/D10^2  : 46.8595        (-45.8547      127647)
kT2 [keV]   : 16.7780        (-5.73722      12.2901)
R2^2/D10^2  : 3.91573E-02    (-0.0338162   0.0581011)
------------------------------------------------------------
#Fit statistic  : Chi-Squared                   56.09     using 59 bins.
 Reduced chi-squared =
# Null hypothesis probability of 4.34e-01 with 55 degrees of freedom

Energy  Fluence     90% Error
[keV]   [erg/cm2]   [erg/cm2]
15- 25  8.685e-09   4.792e-09
25- 50  1.065e-08   5.950e-09
50-150  1.974e-08   1.340e-08
15-150  3.908e-08   2.156e-08
Pre-slew spectrum (Pre-slew PHA with pre-slew DRM)
Power-law model
Spectral model in power-law:
------------------------------------------------------------
Parameters  : value       lower 90%   higher 90%
Photon index: 1.26018     ( -0.281538   0.273434 )
Norm@50keV  : 2.09318E-03    ( -0.000309166   0.000309166 )
------------------------------------------------------------
#Fit statistic  : Chi-Squared                   56.28     using 59 bins.
 Reduced chi-squared =
# Null hypothesis probability of 5.02e-01 with 57 degrees of freedom

Photon flux (15-150 keV)    in 18.22 sec: 0.247983 ( -0.0382595  0.0384689 ) ph/cm2/s
Energy fluence (15-150 keV)             : 3.80669e-07 ( -6.20183e-08  6.27216e-08 ) ergs/cm2
Cutoff power-law model

Spectral model in the cutoff power-law:
------------------------------------------------------------
Parameters  : value       lower 90%   higher 90%
Photon index: 1.25627     ( -0.837862   1.94464 )
Epeak [keV] : 1.00000E+04      ( -10000 -10000 )
Norm@50keV  : 2.10237E-03    ( -0.000310556   -0.00210243 )
------------------------------------------------------------
#Fit statistic  : Chi-Squared                   56.28     using 59 bins.
 Reduced chi-squared =
# Null hypothesis probability of 4.64e-01 with 56 degrees of freedom

Photon flux (15-150 keV)    in 18.22 sec: 0.247820 ( -0.019186  0.038033 ) ph/cm2/s
Energy fluence (15-150 keV)             : 3.8037e-07 ( -3.32169e-08  6.23397e-08 ) ergs/cm2
Band function

Spectral model in the Band function:
------------------------------------------------------------
Parameters  : value       lower 90%   higher 90%
alpha       :    (     )
beta        :     (     )
Epeak [keV] :       (   )
Norm@50keV   :     (     )
------------------------------------------------------------

Photon flux (15-150 keV)    in  sec:  (    ) ph/cm2/s
Energy fluence (15-150 keV)             : 0 ( 0  0 ) ergs/cm2
S(25-50 keV) vs. S(50-100 keV) plot

S(25-50 keV)  = 8.29e-08
S(50-100 keV) = 1.38e-07
T90 vs. Hardness ratio plot
T90                                   = 14.4879999160767 sec.
Hardness ratio (energy fluence ratio) = 1.66466
Color vs. Color plot
Count Ratio  (25-50 keV) / (15-25 keV) = 1.09346
Count Ratio (50-100 keV) / (15-25 keV) = 1.11521
Mask shadow pattern
IMX = 1.362359546233123E-01, IMY = 1.828085824036829E-01
TIME vs. PHA plot around the trigger time

TIME vs. DetID plot around the trigger time

100 us light curve (15-350 keV)
Spacecraft aspect plot
Bright source in the pre-burst/pre-slew/post-slew images
Pre-burst image of 15-350 keV band
Time interval of the image:
-239.504000 -8.632000

# RAcent  DECcent POSerr Theta    Phi  PeakCts   SNR AngSep     Name
#  [deg]    [deg]    ['] [deg]  [deg]                   [']
170.4882 -60.4536   36.0  36.3 -145.6   0.2396   0.3   11.4	Cen X-3
186.3299 -62.7974    4.4  28.5 -147.5   1.6806   2.6    9.1	GX 301-2
244.9732 -15.6567    1.4  36.9   -3.1   6.4317   8.3    1.1	Sco X-1
256.0084 -37.8378    1.2  19.3   34.6   5.7120   9.4    1.1	4U 1700-377
256.2991 -36.2684   22.5  20.7   32.5   0.3177   0.5   11.4	GX 349+2
262.8480 -24.6061   30.4  33.6   29.7  -0.3505  -0.4   12.1	GX 1+4
264.7539 -44.5217    7.3  19.6   62.9   0.9577   1.6    4.3	4U 1735-44
270.2891 -25.1713    9.5  36.7   40.2   1.5697   1.2    5.5	GX 5-1
270.1729 -25.8380   23.2  36.1   40.7   0.6176   0.5    9.0	GRS 1758-258
273.9527 -14.0418   15.8  47.9   35.8  -1.4986  -0.7    3.1	GX 17+2
275.8630 -30.2961   15.4  35.6   52.1  -0.9829  -0.8    5.3	H1820-303
263.1456 -33.9746    8.6  25.9   40.5   0.9666   1.4   11.5	GX 354-0
261.9332 -16.2014    0.4  40.8   22.3  29.7829  27.1 ------	UNKNOWN
257.8550 -13.7045    3.0  41.7   15.4   4.0833   3.8 ------	UNKNOWN
255.2926 -34.7216    2.5  21.6   28.2   2.7771   4.7 ------	UNKNOWN
139.8464 -50.8197    2.5  55.9 -146.3  16.2632   4.6 ------	UNKNOWN
Pre-slew background subtracted image of 15-350 keV band
Time interval of the image:
-8.632000 9.584000

# RAcent  DECcent POSerr Theta    Phi  PeakCts   SNR AngSep     Name
#  [deg]    [deg]    ['] [deg]  [deg]                   [']
170.0206 -60.6201   11.4  36.5 -146.0  -0.0803  -1.0    8.7	Cen X-3
186.5322 -62.9750    0.0  28.4 -147.9   0.1001   1.5   12.7	GX 301-2
245.0907 -15.7150    6.3  36.9   -2.9  -0.1583  -1.8    7.8	Sco X-1
256.0474 -37.8252    2.7  19.4   34.6  -0.2706  -4.2    3.1	4U 1700-377
256.3744 -36.2724   57.6  20.8   32.6   0.0130   0.2    9.5	GX 349+2
262.9575 -24.5985    4.7  33.7   29.8   0.2309   2.4    9.3	GX 1+4
264.7779 -44.4080    5.7  19.7   62.7  -0.1451  -2.0    2.9	4U 1735-44
270.2980 -25.2176    3.8  36.6   40.2   0.3506   3.1    8.3	GX 5-1
270.1937 -25.6762    7.0  36.2   40.6  -0.1884  -1.7    7.1	GRS 1758-258
273.9905 -13.9421    7.4  48.1   35.8  -0.4276  -1.6    5.7	GX 17+2
275.9786 -30.4964    5.2  35.5   52.5  -0.2632  -2.2    8.2	H1820-303
263.1469 -33.7229    5.2  26.1   40.1  -0.1695  -2.2   10.3	GX 354-0
 90.4482 -79.5250    2.6  47.0  172.3   0.5273   4.5 ------	UNKNOWN
238.7915 -70.5856    2.7  18.6  162.9   0.2393   4.2 ------	UNKNOWN
226.8013 -41.3526    0.9  12.8  -53.3   0.6971  12.4 ------	UNKNOWN
Post-slew image of 15-350 keV band
Time interval of the image:
101.796590 815.996600

# RAcent  DECcent POSerr Theta    Phi  PeakCts   SNR AngSep     Name
#  [deg]    [deg]    ['] [deg]  [deg]                   [']
170.3190 -60.6206   17.9  38.8 -165.3   1.3363   0.6    0.2	Cen X-3
186.4192 -62.8818    4.4  31.9 -172.1   4.2079   2.6    9.3	GX 301-2
244.9777 -15.6115    1.1  30.1   10.7  20.3660  10.1    1.7	Sco X-1
255.9512 -37.7196    2.9  22.7   64.4   7.7253   4.0    7.7	4U 1700-377
256.4766 -36.5507    4.6  23.4   62.0   5.1388   2.5    7.9	GX 349+2
263.0077 -24.7450  101.4  34.2   46.4  -0.3997  -0.1    0.1	GX 1+4
264.8279 -44.4361   11.4  27.8   83.3   2.8340   1.0    3.7	4U 1735-44
270.4456 -25.1449   20.2  39.4   53.7   2.7742   0.6    9.6	GX 5-1
270.4051 -25.6573    6.8  39.1   54.3   8.1436   1.7    7.6	GRS 1758-258
275.9467 -30.2466    9.6  40.8   64.4  -9.9701  -1.2    7.3	H1820-303
262.9457 -33.8621  117.0  29.4   61.1  -0.2933  -0.1    2.7	GX 354-0
261.9352 -16.1964    0.5  39.3   34.7  94.0973  22.4 ------	UNKNOWN
256.3492  -1.0458    2.8  48.3   15.3  18.9900   4.1 ------	UNKNOWN
220.2355 -39.7594    2.8   5.2 -100.6   5.8429   4.1 ------	UNKNOWN
179.9244 -45.0765    2.9  33.9 -138.4   8.5975   4.0 ------	UNKNOWN
148.3291 -43.1615    2.9  55.9 -146.3  41.5790   4.1 ------	UNKNOWN
165.0205 -34.6805    3.7  48.1 -129.2  20.1973   3.1 ------	UNKNOWN
Plot creation:
Wed Dec 27 00:33:35 EST 2023