Estimated redshift from machine learning (Ukwatta et al. 2016) - may take a few minute to calcaulte
Image
Pre-slew 15.0-350.0 keV image (Event data)
#   RAcent    DECcent   POSerr    Theta     Phi              Peak Cts       SNR   Name
   23.8233    83.7942   0.0024    20.1363   -43.3119        13.8237120     79.025 TRIG_01194500

Foreground time interval of the image:
-13.392  14.077 (delta_t =  27.469 [sec])
Background time interval of the image:
-168.923 -13.392 (delta_t = 155.531 [sec])
Lightcurves
Notes:
- 1) The mask-weighted light curves are using the flight position.
- 2) Multiple plots of different time binning/intervals are shown to cover all scenarios of short/long GRBs, rate/image triggers, and real/false positives.
- 3) For all the mask-weighted lightcurves, the y-axis units are counts/sec/det where a det is 0.4 x 0.4 = 0.16 sq cm.
- 4) The verticle lines correspond to following: green dotted lines are T50 interval, black dotted lines are T90 interval, blue solid line(s) is a spacecraft slew start time, and orange solid line(s) is a spacecraft slew end time.
- 5) Time of each bin is in the middle of the bin.
1 s binning
From T0-310 s to T0+310 s
From T100_start - 20 s to T100_end + 30 s

Full time interval
64 ms binning
Full time interval
From T100_start to T100_end

From T0-5 sec to T0+5 sec
16 ms binning
From T100_start-5 s to T100_start+5 s

Blue+Cyan dotted lines: Time interval of the scaled map
From 0.000000 to 1.024000
8 ms binning
From T100_start-3 s to T100_start+3 s
Blue+Cyan dotted lines: Time interval of the scaled map
From 0.000000 to 1.024000
2 ms binning
From T100_start-1 s to T100_start+1 s
Blue+Cyan dotted lines: Time interval of the scaled map
From 0.000000 to 1.024000
SN=5 or 10 sec. binning (whichever binning is satisfied first)
SN=5 or 10 sec. binning (T < 200 sec)
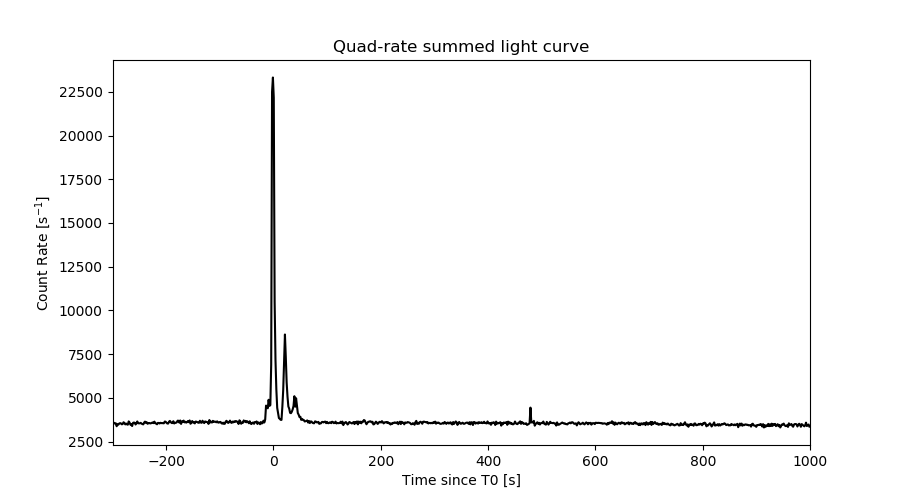
Quad-rate summed light curves (from T0-300s to T0+1000s)
Spectral Evolution

Spectra
Notes:
- 1) The fitting includes the systematic errors.
- 2) When the burst includes telescope slew time periods, the fitting uses an average response file made from multiple 5-s response files through out the slew time plus single time preiod for the non-slew times, and weighted by the total counts in the corresponding time period using addrmf. An average response file is needed becuase a spectral fit using the pre-slew DRM will introduce some errors in both a spectral shape and a normalization if the PHA file contains a lot of the slew/post-slew time interval.
- 3) For fits to more complicated models (e.g. a power-law over a cutoff power-law), the BAT team has decided to require a chi-square improvement of more than 6 for each extra dof.
Time averaged spectrum fit using the average DRM
Power-law model

Time interval is from  -13.392 sec. to   55.832 sec.

Spectral model in power-law:
------------------------------------------------------------
Parameters  : value       lower 90%   higher 90%
Photon index: 1.23926     ( -0.0308713   0.030772 )
Norm@50keV  : 1.87600E-02    ( -0.000308644   0.000307866 )
------------------------------------------------------------
#Fit statistic  : Chi-Squared                   47.26     using 59 bins.
 Reduced chi-squared = 0.829123
# Null hypothesis probability of 8.18e-01 with 57 degrees of freedom

Photon flux (15-150 keV)    in 69.22 sec: 2.21500 ( -0.04101  0.04122 ) ph/cm2/s
Energy fluence (15-150 keV)             : 1.30344e-05 ( -2.0662e-07  2.07232e-07 ) ergs/cm2
Cutoff power-law model
Time interval is from  -13.392 sec. to   55.832 sec.
Spectral model in the cutoff power-law:
------------------------------------------------------------
Parameters  : value       lower 90%   higher 90%
Photon index: 1.23491     ( -0.0315365   0.0306619 )
Epeak [keV] : 9999.36      ( -9999.36 -9999.36 )
Norm@50keV  : 1.88293E-02    ( -0.000293811   0.00172402 )
------------------------------------------------------------
#Fit statistic  : Chi-Squared                   47.32     using 59 bins.
 Reduced chi-squared = 0.845
# Null hypothesis probability of 7.89e-01 with 56 degrees of freedom

Photon flux (15-150 keV)    in 69.22 sec: 2.21917 ( -0.04606  0.03611 ) ph/cm2/s
Energy fluence (15-150 keV)             : 5.18444e-06 ( -2.32201e-07  8.83642e-08 ) ergs/cm2
Band function

Time interval is from  -13.392 sec. to   55.832 sec.


Spectral model in the Band function:
------------------------------------------------------------
Parameters  : value       lower 90%   higher 90%
alpha       :    (     )
beta        :     (     )
Epeak [keV] :       (   )
Norm@50keV   :     (     )
------------------------------------------------------------

Photon flux (15-150 keV)    in  sec:  (    ) ph/cm2/s
Energy fluence (15-150 keV)             : 0 ( 0  0 ) ergs/cm2
Single BB
Spectral model blackbody:
------------------------------------------------------------
Parameters  : value    Lower 90%  Upper 90%
kT [keV]    : 21.8412  (  )
R^2/D10^2   : 7.29578E-02  (   )
(R is the radius in km and D10 is the distance to the source in units of 10 kpc)
------------------------------------------------------------
#Fit statistic  : Chi-Squared                  824.72     using 59 bins.
 Reduced chi-squared =
# Null hypothesis probability of 1.27e-136 with 57 degrees of freedom

Energy  Fluence     90% Error
[keV]   [erg/cm2]   [erg/cm2]
15- 25  4.473e-07   1.516e-08
25- 50  2.355e-06   6.368e-08
50-150  8.392e-06   1.904e-07
15-150  1.119e-05   1.869e-07
Thermal bremsstrahlung (OTTB)
Spectral model: thermal bremsstrahlung
------------------------------------------------------------
Parameters  : value         Lower 90%    Upper 90%
kT [keV]    : 199.363       (      )
Norm        : 9.70562       (     )
------------------------------------------------------------
#Fit statistic  : Chi-Squared                  452.84     using 59 bins.
 Reduced chi-squared =
# Null hypothesis probability of 5.29e-63 with 57 degrees of freedom

Energy  Fluence     90% Error
[keV]   [erg/cm2]   [erg/cm2]
15- 25  1.673e-06   3.253e-08
25- 50  3.218e-06   5.711e-08
50-150  7.058e-06   1.281e-07
15-150  1.195e-05   2.180e-07
Double BB
Spectral model: bbodyrad<1> + bbodyrad<2>
------------------------------------------------------------
Parameters  : value         Lower 90%    Upper 90%
kT1 [keV]   : 8.67091        (-0.572352      0.602722)
R1^2/D10^2  : 0.954731        (-0.187892      0.246976)
kT2 [keV]   : 36.2831        (-2.31093      2.82442)
R2^2/D10^2  : 1.19456E-02    (-0.00253839   0.00287194)
------------------------------------------------------------
#Fit statistic  : Chi-Squared                   57.03     using 59 bins.
 Reduced chi-squared =
# Null hypothesis probability of 3.99e-01 with 55 degrees of freedom

Energy  Fluence     90% Error
[keV]   [erg/cm2]   [erg/cm2]
15- 25  1.098e-06   7.026e-08
25- 50  2.894e-06   9.137e-08
50-150  9.033e-06   2.665e-07
15-150  1.302e-05   3.669e-07
Peak spectrum fit
Power-law model

Time interval is from    0.240 sec. to    1.240 sec.

Spectral model in power-law:
------------------------------------------------------------
Parameters  : value       lower 90%   higher 90%
Photon index: 0.824163     ( -0.0429028   0.0426581 )
Norm@50keV  : 0.217964    ( -0.00519388   0.00517721 )
------------------------------------------------------------
#Fit statistic  : Chi-Squared                   52.03     using 59 bins.
 Reduced chi-squared = 0.912807
# Null hypothesis probability of 6.62e-01 with 57 degrees of freedom

Photon flux (15-150 keV)    in 1 sec: 25.0326 ( -0.5879  0.5882 ) ph/cm2/s
Energy fluence (15-150 keV)             : 2.52185e-06 ( -6.34644e-08  6.35039e-08 ) ergs/cm2
Cutoff power-law model

Time interval is from    0.240 sec. to    1.240 sec.
Spectral model in the cutoff power-law:
------------------------------------------------------------
Parameters  : value       lower 90%   higher 90%
Photon index: 0.747172     ( -0.166692   0.0913525 )
Epeak [keV] : 999.584      ( -999.962 -999.962 )
Norm@50keV  : 0.234600    ( -0.00533861   0.0391374 )
------------------------------------------------------------
#Fit statistic  : Chi-Squared                   51.42     using 59 bins.
 Reduced chi-squared = 0.918214
# Null hypothesis probability of 6.49e-01 with 56 degrees of freedom

Photon flux (15-150 keV)    in 1 sec: 24.9502 ( -0.61  0.5848 ) ph/cm2/s
Energy fluence (15-150 keV)             : 2.51495e-06 ( -6.521e-08  5.98885e-08 ) ergs/cm2
Band function

Time interval is from    0.240 sec. to    1.240 sec.


Spectral model in the Band function:
------------------------------------------------------------
Parameters  : value       lower 90%   higher 90%
alpha       :    (     )
beta        :     (     )
Epeak [keV] :       (   )
Norm@50keV   :     (     )
------------------------------------------------------------

Photon flux (15-150 keV)    in  sec:  (    ) ph/cm2/s
Energy fluence (15-150 keV)             : 0 ( 0  0 ) ergs/cm2
Single BB

Spectral model blackbody:
------------------------------------------------------------
Parameters  : value    Lower 90%  Upper 90%
kT [keV]    : 25.6560  (  )
R^2/D10^2   : 0.583399  (   )
(R is the radius in km and D10 is the distance to the source in units of 10 kpc)
------------------------------------------------------------
#Fit statistic  : Chi-Squared                  322.80     using 59 bins.
 Reduced chi-squared =
# Null hypothesis probability of 8.81e-39 with 57 degrees of freedom

Energy  Fluence     90% Error
[keV]   [erg/cm2]   [erg/cm2]
15- 25  6.579e-08   3.195e-09
25- 50  3.781e-07   1.310e-08
50-150  1.838e-06   6.250e-08
15-150  2.282e-06   6.400e-08
Thermal bremsstrahlung (OTTB)
Spectral model: thermal bremsstrahlung
------------------------------------------------------------
Parameters  : value         Lower 90%    Upper 90%
kT [keV]    : 199.363       (      )
Norm        : 98.8888       (     )
------------------------------------------------------------
#Fit statistic  : Chi-Squared                  816.25     using 59 bins.
 Reduced chi-squared =
# Null hypothesis probability of 6.64e-135 with 57 degrees of freedom

Energy  Fluence     90% Error
[keV]   [erg/cm2]   [erg/cm2]
15- 25  2.462e-07   6.150e-09
25- 50  4.737e-07   1.165e-08
50-150  1.039e-06   2.500e-08
15-150  1.759e-06   4.150e-08
Double BB
Spectral model: bbodyrad<1> + bbodyrad<2>
------------------------------------------------------------
Parameters  : value         Lower 90%    Upper 90%
kT1 [keV]   : 9.89435        (-1.10583      1.20859)
R1^2/D10^2  : 5.35562        (-1.42559      2.1484)
kT2 [keV]   : 44.6090        (-4.96323      7.2986)
R2^2/D10^2  : 0.102173    (-0.0347182   0.0414994)
------------------------------------------------------------
#Fit statistic  : Chi-Squared                   48.79     using 59 bins.
 Reduced chi-squared =
# Null hypothesis probability of 7.10e-01 with 55 degrees of freedom

Energy  Fluence     90% Error
[keV]   [erg/cm2]   [erg/cm2]
15- 25  1.306e-07   1.395e-08
25- 50  4.308e-07   2.865e-08
50-150  1.980e-06   1.605e-07
15-150  2.541e-06   1.680e-07
Pre-slew spectrum (Pre-slew PHA with pre-slew DRM)
Power-law model

Spectral model in power-law:
------------------------------------------------------------
Parameters  : value       lower 90%   higher 90%
Photon index: 1.07237     ( -0.0310315   0.0309073 )
Norm@50keV  : 3.32608E-02    ( -0.000568187   0.000566388 )
------------------------------------------------------------
#Fit statistic  : Chi-Squared                   42.74     using 59 bins.
 Reduced chi-squared =
# Null hypothesis probability of 9.20e-01 with 57 degrees of freedom

Photon flux (15-150 keV)    in 27.47 sec: 3.84838 ( -0.0697438  0.0698862 ) ph/cm2/s
Energy fluence (15-150 keV)             : 9.63862e-06 ( -1.5848e-07  1.58546e-07 ) ergs/cm2
Cutoff power-law model

Spectral model in the cutoff power-law:
------------------------------------------------------------
Parameters  : value       lower 90%   higher 90%
Photon index: 1.06714     ( -0.122594   0.0309734 )
Epeak [keV] : 9997.10      ( -9993.32 -9993.32 )
Norm@50keV  : 3.34599E-02    ( -0.00054299   0.00559098 )
------------------------------------------------------------
#Fit statistic  : Chi-Squared                   42.64     using 59 bins.
 Reduced chi-squared =
# Null hypothesis probability of 9.06e-01 with 56 degrees of freedom

Photon flux (15-150 keV)    in 27.47 sec: 3.83353 ( -0.07532  0.07956 ) ph/cm2/s
Energy fluence (15-150 keV)             : 9.6226e-06 ( -1.59244e-07  1.53283e-07 ) ergs/cm2
Band function
Spectral model in the Band function:
------------------------------------------------------------
Parameters  : value       lower 90%   higher 90%
alpha       :    (     )
beta        :     (     )
Epeak [keV] :       (   )
Norm@50keV   :     (     )
------------------------------------------------------------

Photon flux (15-150 keV)    in  sec:  (    ) ph/cm2/s
Energy fluence (15-150 keV)             : 0 ( 0  0 ) ergs/cm2
S(25-50 keV) vs. S(50-100 keV) plot
S(25-50 keV)  = 2.80e-06
S(50-100 keV) = 4.75e-06
T90 vs. Hardness ratio plot
T90                                   = 46.7119998931885 sec.
Hardness ratio (energy fluence ratio) = 1.69643
Color vs. Color plot
Count Ratio  (25-50 keV) / (15-25 keV) = 1.52003
Count Ratio (50-100 keV) / (15-25 keV) = 1.34559
Mask shadow pattern

IMX = 2.667976350640010E-01, IMY = 2.515223821690920E-01
TIME vs. PHA plot around the trigger time
Blue+Cyan dotted lines: Time interval of the scaled map
From 0.000000 to 1.024000
TIME vs. DetID plot around the trigger time
Blue+Cyan dotted lines: Time interval of the scaled map
From 0.000000 to 1.024000
100 us light curve (15-350 keV)
Blue+Cyan dotted lines: Time interval of the scaled map
From 0.000000 to 1.024000
Spacecraft aspect plot
Bright source in the pre-burst/pre-slew/post-slew images
Pre-burst image of 15-350 keV band
Time interval of the image:
-168.923400 -13.392000

# RAcent  DECcent POSerr Theta    Phi  PeakCts   SNR AngSep     Name
#  [deg]    [deg]    ['] [deg]  [deg]                   [']
299.5879  35.1903    1.2  48.8 -141.5   6.2656   9.7    0.7	Cyg X-1
308.1383  40.9963    2.9  40.2 -144.8   1.6622   4.0    2.9	Cyg X-3
326.1313  38.2766    8.0  35.0 -166.4   0.4537   1.4    3.3	Cyg X-2
 75.4520  53.6428    3.1  35.2   25.0   1.5623   3.8 ------	UNKNOWN
Pre-slew background subtracted image of 15-350 keV band
Time interval of the image:
-13.392000 14.076590

# RAcent  DECcent POSerr Theta    Phi  PeakCts   SNR AngSep     Name
#  [deg]    [deg]    ['] [deg]  [deg]                   [']
299.6329  35.1725   12.0  48.8 -141.5   0.4695   1.0    2.7	Cyg X-1
308.1459  41.0018    6.0  40.2 -144.8   0.4986   1.9    3.4	Cyg X-3
326.3257  38.2912    7.8  34.9 -166.6   0.3010   1.5    7.5	Cyg X-2
 23.7510  30.4309    3.0  35.3  105.0   1.5301   3.9 ------	UNKNOWN
332.8280  22.7971    2.3  46.8  175.7   1.7818   5.1 ------	UNKNOWN
 23.8231  83.7941    0.1  20.1  -43.3  13.8197  79.0 ------	UNKNOWN
308.8190  20.7062    2.2  57.5 -159.2   4.0826   5.2 ------	UNKNOWN
Post-slew image of 15-350 keV band
Time interval of the image:
70.676590 719.756000
720.776000 962.889800

# RAcent  DECcent POSerr Theta    Phi  PeakCts   SNR AngSep     Name
#  [deg]    [deg]    ['] [deg]  [deg]                   [']
299.5916  35.1806    2.3  54.4 -165.5  18.2610   5.1    1.3	Cyg X-1
308.2232  40.9708    3.7  47.8 -173.1   8.3396   3.1    5.2	Cyg X-3
325.9646  38.2115    0.0  48.7  168.2  -5.5969  -1.5   11.8	Cyg X-2
349.0709  45.5702    3.0  39.4  144.8  12.0508   3.9 ------	UNKNOWN
154.4647  61.2929    2.4  33.1  -32.2   7.0391   4.7 ------	UNKNOWN
263.7796  45.3222    2.8  48.0 -129.1  21.3483   4.1 ------	UNKNOWN
Plot creation:
Tue Dec 26 17:03:00 EST 2023