Special notes of this burst
Image
Pre-slew 15.0-350.0 keV image (Event data)

#   RAcent    DECcent   POSerr    Theta     Phi              Peak Cts       SNR   Name
  356.2546    82.6281   0.0087    38.7939   149.6650         2.3323629     22.126 TRIG_01195733

Foreground time interval of the image:
 -1.404  15.076 (delta_t =  16.480 [sec])
Background time interval of the image:
-133.067  -1.404 (delta_t = 131.663 [sec])
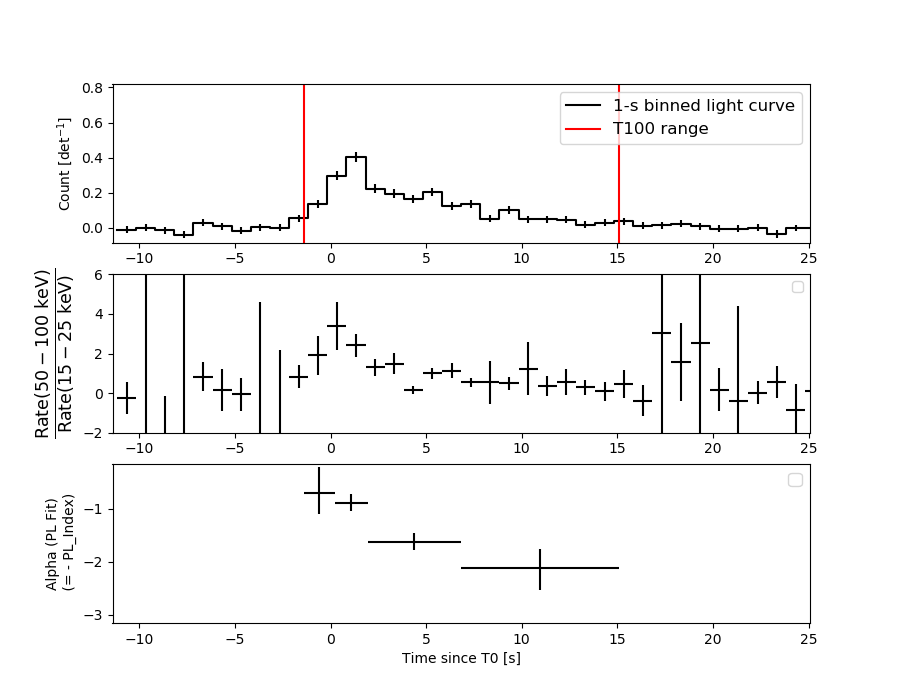
Lightcurves
Notes:
- 1) The mask-weighted light curves are using the flight position.
- 2) Multiple plots of different time binning/intervals are shown to cover all scenarios of short/long GRBs, rate/image triggers, and real/false positives.
- 3) For all the mask-weighted lightcurves, the y-axis units are counts/sec/det where a det is 0.4 x 0.4 = 0.16 sq cm.
- 4) The verticle lines correspond to following: green dotted lines are T50 interval, black dotted lines are T90 interval, blue solid line(s) is a spacecraft slew start time, and orange solid line(s) is a spacecraft slew end time.
- 5) Time of each bin is in the middle of the bin.
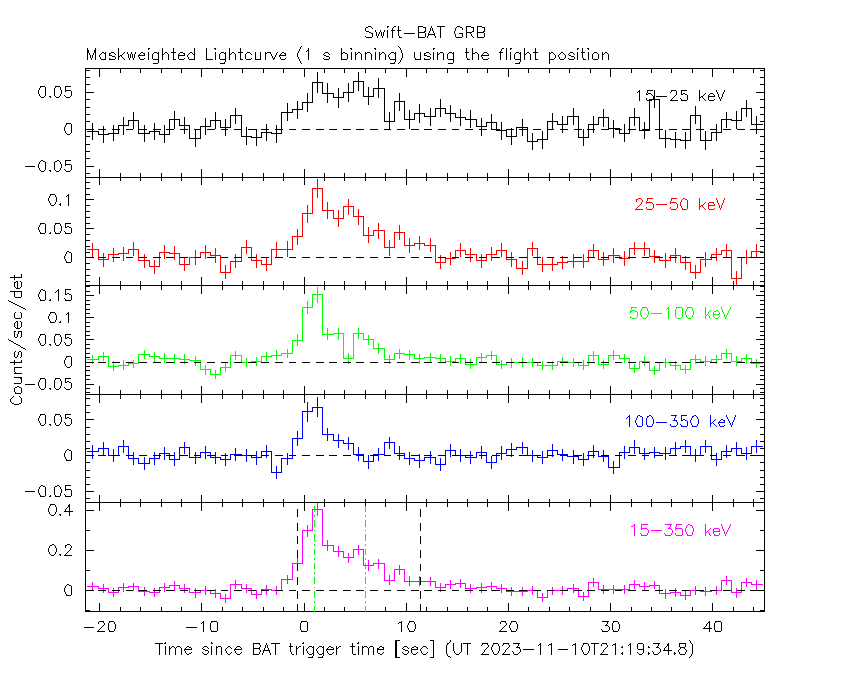
1 s binning
From T0-310 s to T0+310 s
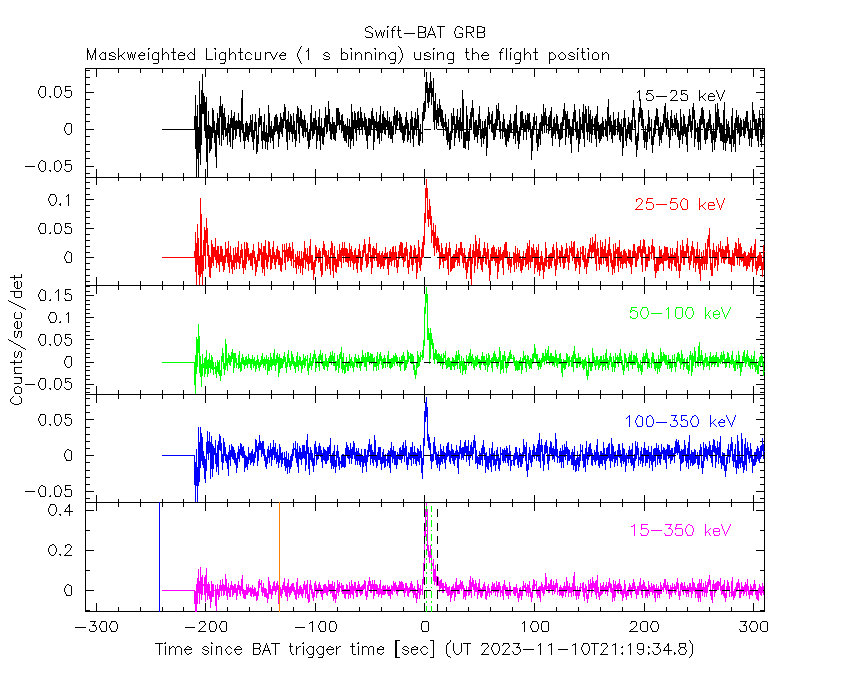
From T100_start - 20 s to T100_end + 30 s
Full time interval

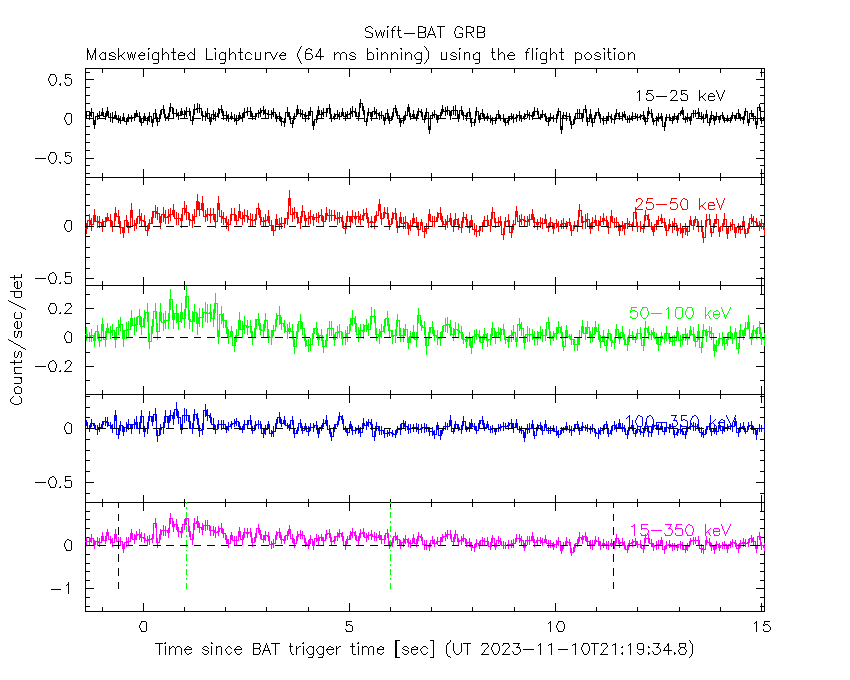
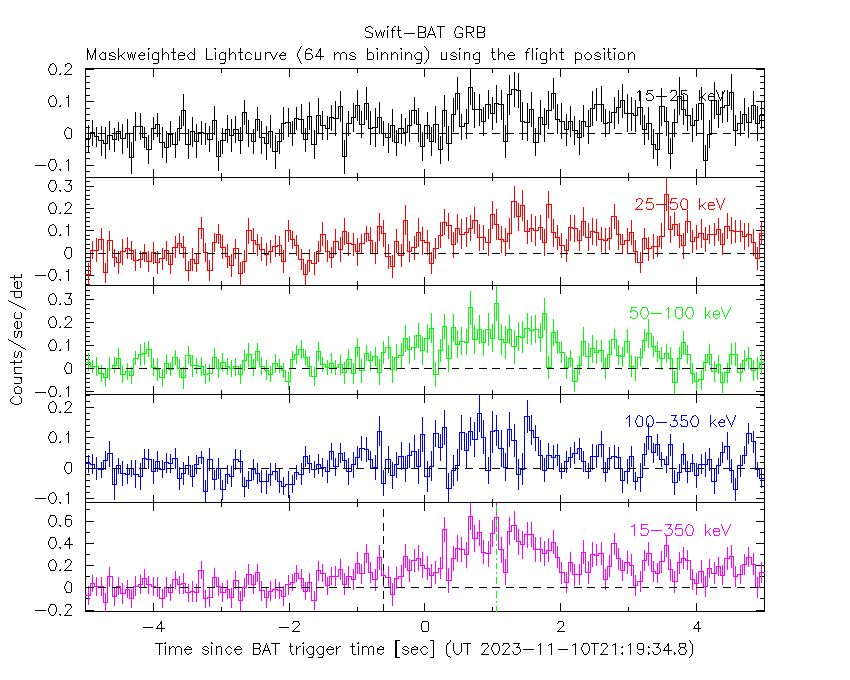
64 ms binning
Full time interval

From T100_start to T100_end
From T0-5 sec to T0+5 sec
16 ms binning
From T100_start-5 s to T100_start+5 s
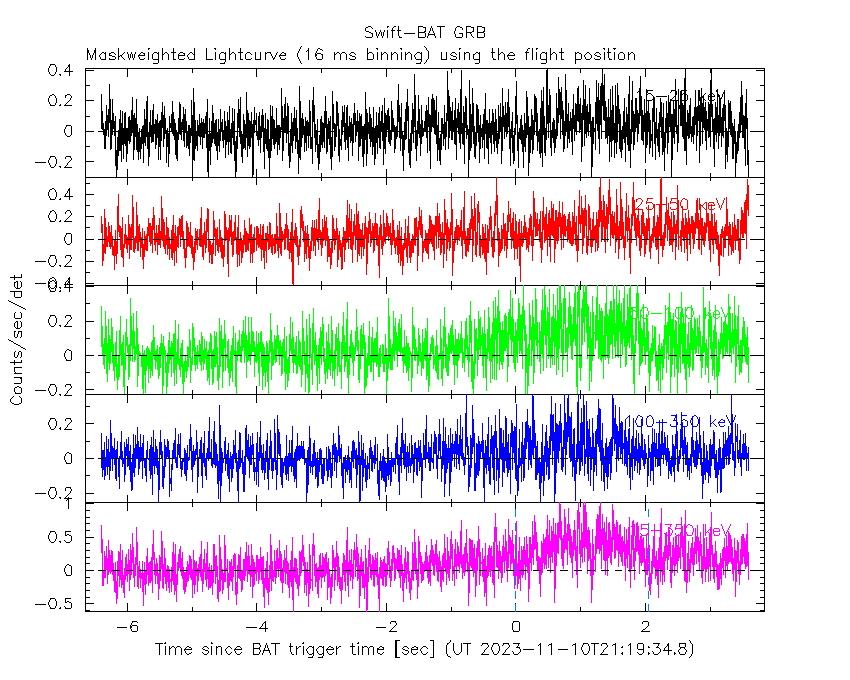
Blue+Cyan dotted lines: Time interval of the scaled map
From 0.000000 to 2.048000
8 ms binning
From T100_start-3 s to T100_start+3 s
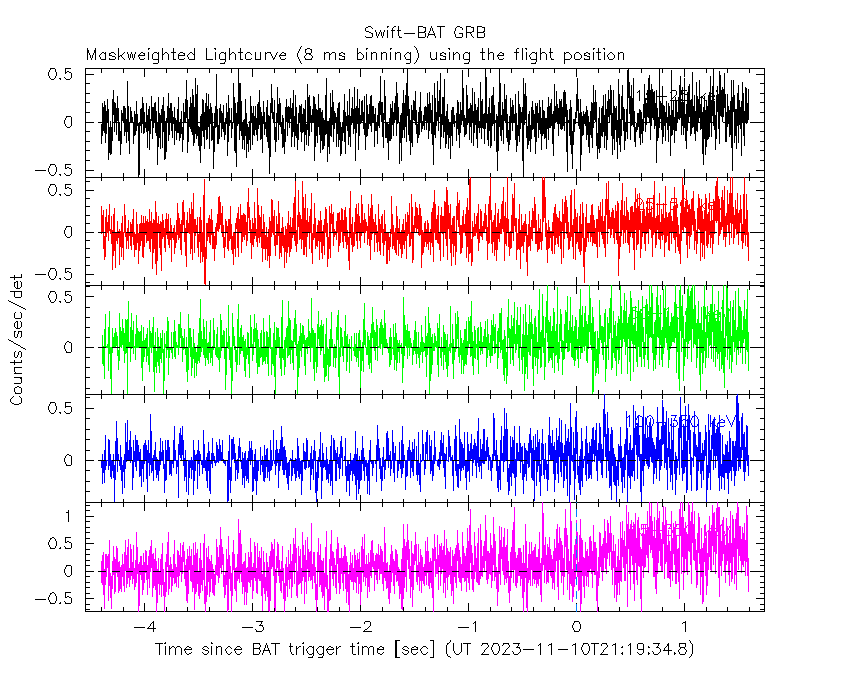
Blue+Cyan dotted lines: Time interval of the scaled map
From 0.000000 to 2.048000
2 ms binning
From T100_start-1 s to T100_start+1 s
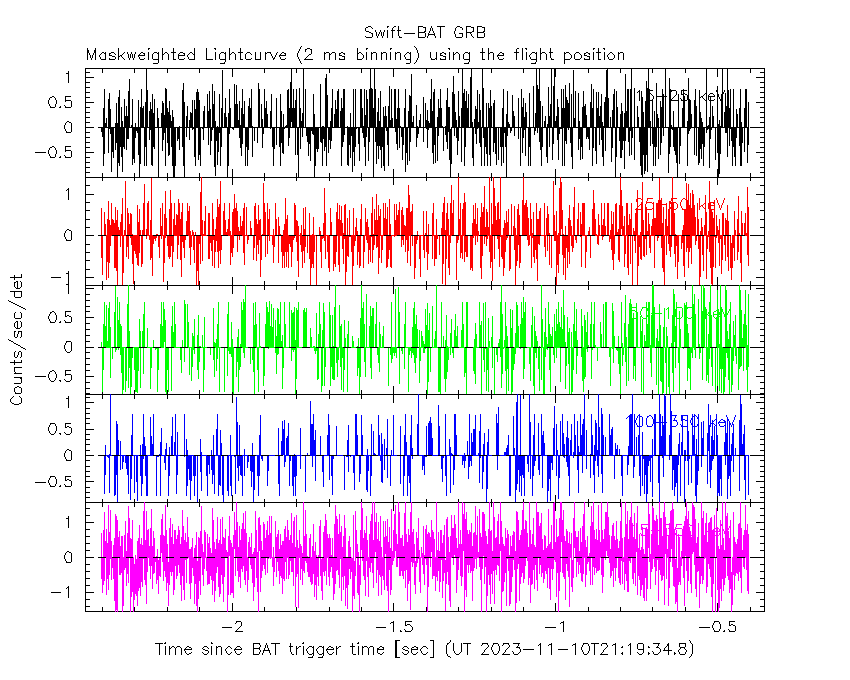
Blue+Cyan dotted lines: Time interval of the scaled map
From 0.000000 to 2.048000
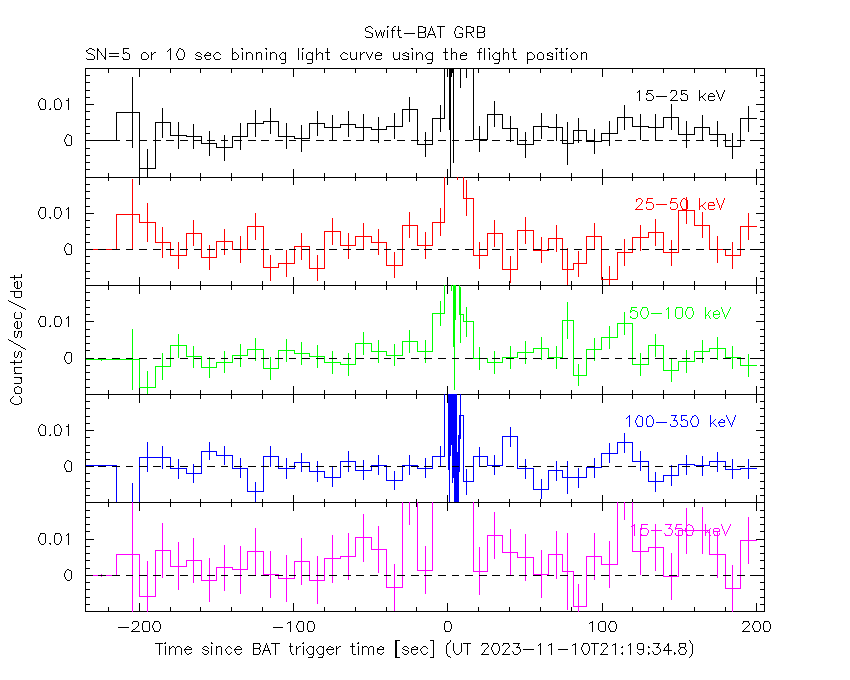
SN=5 or 10 sec. binning (whichever binning is satisfied first)

SN=5 or 10 sec. binning (T < 200 sec)
Quad-rate summed light curves (from T0-300s to T0+1000s)

Spectral Evolution
Spectra
Notes:
- 1) The fitting includes the systematic errors.
- 2) When the burst includes telescope slew time periods, the fitting uses an average response file made from multiple 5-s response files through out the slew time plus single time preiod for the non-slew times, and weighted by the total counts in the corresponding time period using addrmf. An average response file is needed becuase a spectral fit using the pre-slew DRM will introduce some errors in both a spectral shape and a normalization if the PHA file contains a lot of the slew/post-slew time interval.
- 3) For fits to more complicated models (e.g. a power-law over a cutoff power-law), the BAT team has decided to require a chi-square improvement of more than 6 for each extra dof.
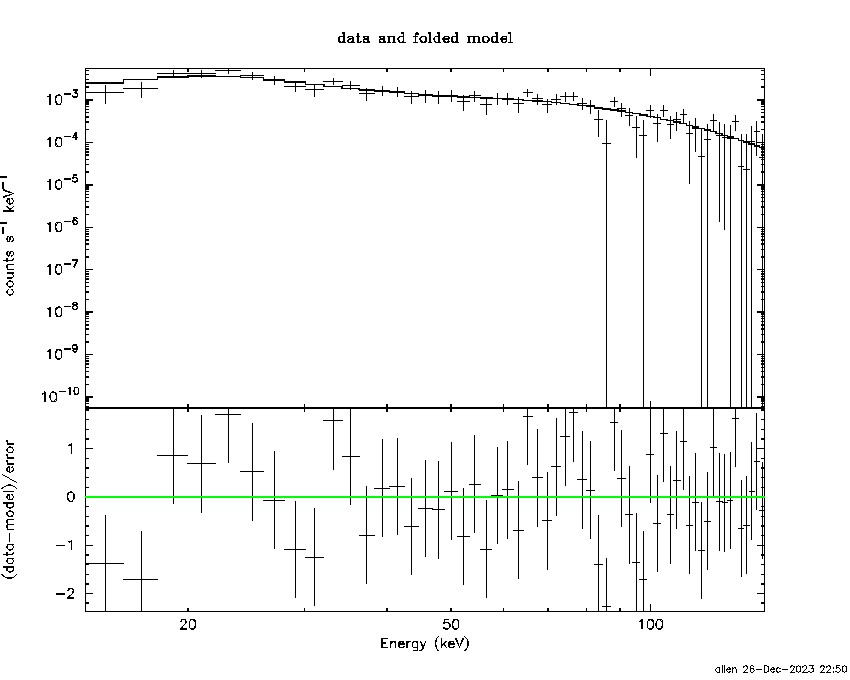
Time averaged spectrum fit using the average DRM
Power-law model
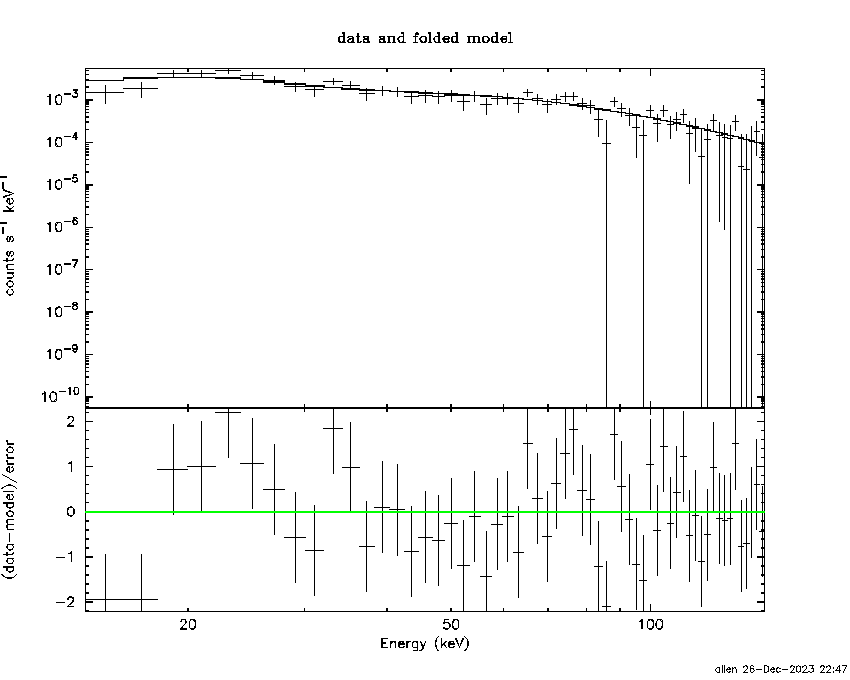
Time interval is from   -1.404 sec. to   15.076 sec.

Spectral model in power-law:
------------------------------------------------------------
Parameters  : value       lower 90%   higher 90%
Photon index: 1.40462     ( -0.120272   0.119653 )
Norm@50keV  : 9.45068E-03    ( -0.000652983   0.000652254 )
------------------------------------------------------------
#Fit statistic  : Chi-Squared                   60.79     using 59 bins.
 Reduced chi-squared = 1.06649
# Null hypothesis probability of 3.41e-01 with 57 degrees of freedom

Photon flux (15-150 keV)    in 16.48 sec: 1.15215 ( -0.08278  0.08296 ) ph/cm2/s
Energy fluence (15-150 keV)             : 1.50369e-06 ( -1.1275e-07  1.13341e-07 ) ergs/cm2
Cutoff power-law model

Time interval is from   -1.404 sec. to   15.076 sec.
Spectral model in the cutoff power-law:
------------------------------------------------------------
Parameters  : value       lower 90%   higher 90%
Photon index: 1.40148     ( -0.390268   0.169476 )
Epeak [keV] : 9997.54      ( -9997.42 -9997.42 )
Norm@50keV  : 9.48489E-03    ( -0.000655329   0.00591799 )
------------------------------------------------------------
#Fit statistic  : Chi-Squared                   60.79     using 59 bins.
 Reduced chi-squared = 1.08554
# Null hypothesis probability of 3.08e-01 with 56 degrees of freedom

Photon flux (15-150 keV)    in 16.48 sec: 1.15150 ( -0.0849  0.08376 ) ph/cm2/s
Energy fluence (15-150 keV)             : 1.50223e-06 ( -1.19312e-07  1.14645e-07 ) ergs/cm2
Band function

Time interval is from   -1.404 sec. to   15.076 sec.


Spectral model in the Band function:
------------------------------------------------------------
Parameters  : value       lower 90%   higher 90%
alpha       :    (     )
beta        :     (     )
Epeak [keV] :       (   )
Norm@50keV   :     (     )
------------------------------------------------------------

Photon flux (15-150 keV)    in  sec:  (    ) ph/cm2/s
Energy fluence (15-150 keV)             : 0 ( 0  0 ) ergs/cm2
Single BB
Spectral model blackbody:
------------------------------------------------------------
Parameters  : value    Lower 90%  Upper 90%
kT [keV]    : 16.9552  (  )
R^2/D10^2   : 8.55205E-02  (   )
(R is the radius in km and D10 is the distance to the source in units of 10 kpc)
------------------------------------------------------------
#Fit statistic  : Chi-Squared                  127.90     using 59 bins.
 Reduced chi-squared =
# Null hypothesis probability of 2.31e-07 with 57 degrees of freedom

Energy  Fluence     90% Error
[keV]   [erg/cm2]   [erg/cm2]
15- 25  8.258e-08   1.177e-08
25- 50  3.646e-07   3.650e-08
50-150  7.477e-07   9.830e-08
15-150  1.195e-06   1.087e-07
Thermal bremsstrahlung (OTTB)
Spectral model: thermal bremsstrahlung
------------------------------------------------------------
Parameters  : value         Lower 90%    Upper 90%
kT [keV]    : 200.000       (-24.9844      -200)
Norm        : 4.78271       (-0.33046     0.33046)
------------------------------------------------------------
#Fit statistic  : Chi-Squared                   66.45     using 59 bins.
 Reduced chi-squared =
# Null hypothesis probability of 1.84e-01 with 57 degrees of freedom

Energy  Fluence     90% Error
[keV]   [erg/cm2]   [erg/cm2]
15- 25  1.963e-07   1.516e-08
25- 50  3.775e-07   3.494e-08
50-150  8.280e-07   2.469e-07
15-150  1.402e-06   2.422e-07
Double BB
Spectral model: bbodyrad<1> + bbodyrad<2>
------------------------------------------------------------
Parameters  : value         Lower 90%    Upper 90%
kT1 [keV]   : 7.00133        (-1.04587      1.25576)
R1^2/D10^2  : 1.28168        (-0.562267      1.02655)
kT2 [keV]   : 32.0228        (-5.73263      9.64884)
R2^2/D10^2  : 8.33662E-03    (-0.00461708   0.00769939)
------------------------------------------------------------
#Fit statistic  : Chi-Squared                   52.97     using 59 bins.
 Reduced chi-squared =
# Null hypothesis probability of 5.52e-01 with 55 degrees of freedom

Energy  Fluence     90% Error
[keV]   [erg/cm2]   [erg/cm2]
15- 25  1.875e-07   4.272e-08
25- 50  3.618e-07   7.770e-08
50-150  9.807e-07   3.050e-07
15-150  1.530e-06   3.804e-07
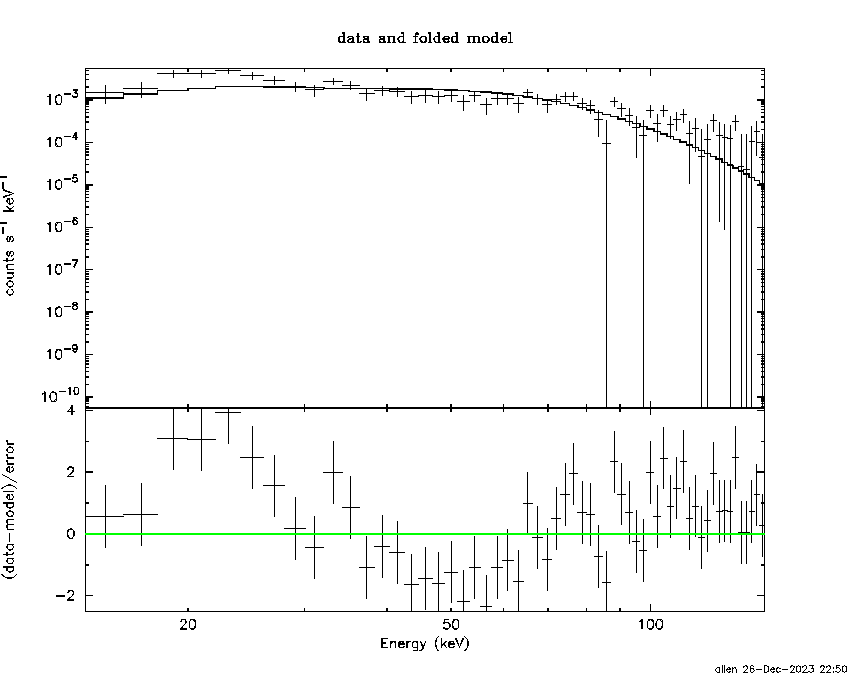
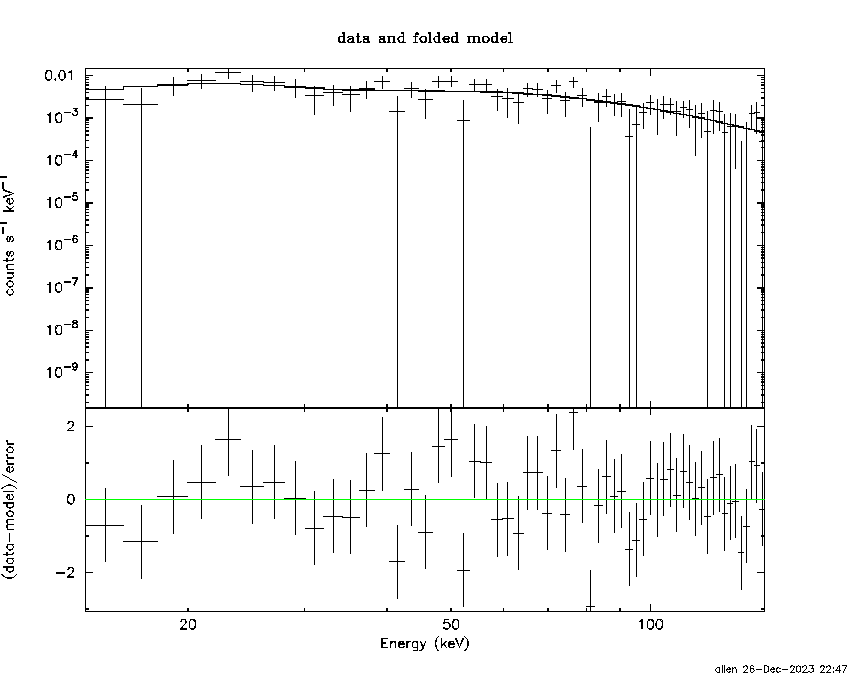
Peak spectrum fit
Power-law model

Time interval is from    0.636 sec. to    1.636 sec.

Spectral model in power-law:
------------------------------------------------------------
Parameters  : value       lower 90%   higher 90%
Photon index: 0.882562     ( -0.209456   0.200901 )
Norm@50keV  : 2.78518E-02    ( -0.00339965   0.00336629 )
------------------------------------------------------------
#Fit statistic  : Chi-Squared                   53.44     using 59 bins.
 Reduced chi-squared = 0.937544
# Null hypothesis probability of 6.09e-01 with 57 degrees of freedom

Photon flux (15-150 keV)    in 1 sec: 3.19647 ( -0.38754  0.38839 ) ph/cm2/s
Energy fluence (15-150 keV)             : 3.14746e-07 ( -3.94309e-08  3.95531e-08 ) ergs/cm2
Cutoff power-law model
Time interval is from    0.636 sec. to    1.636 sec.
Spectral model in the cutoff power-law:
------------------------------------------------------------
Parameters  : value       lower 90%   higher 90%
Photon index: 0.731923     ( -0.86841   0.521211 )
Epeak [keV] : 501.777      ( -501.784 -501.784 )
Norm@50keV  : 3.23943E-02    ( -0.00713674   0.0415057 )
------------------------------------------------------------
#Fit statistic  : Chi-Squared                   53.33     using 59 bins.
 Reduced chi-squared = 0.952321
# Null hypothesis probability of 5.77e-01 with 56 degrees of freedom

Photon flux (15-150 keV)    in 1 sec: 3.18370 ( -0.3927  0.39093 ) ph/cm2/s
Energy fluence (15-150 keV)             : 3.13437e-07 ( -4.05015e-08  3.9218e-08 ) ergs/cm2
Band function

Time interval is from    0.636 sec. to    1.636 sec.


Spectral model in the Band function:
------------------------------------------------------------
Parameters  : value       lower 90%   higher 90%
alpha       :    (     )
beta        :     (     )
Epeak [keV] :       (   )
Norm@50keV   :     (     )
------------------------------------------------------------

Photon flux (15-150 keV)    in  sec:  (    ) ph/cm2/s
Energy fluence (15-150 keV)             : 0 ( 0  0 ) ergs/cm2
Single BB

Spectral model blackbody:
------------------------------------------------------------
Parameters  : value    Lower 90%  Upper 90%
kT [keV]    : 24.5527  (-3.74903  4.88944)
R^2/D10^2   : 8.47311E-02  (-0.0358565   0.0567242)
(R is the radius in km and D10 is the distance to the source in units of 10 kpc)
------------------------------------------------------------
#Fit statistic  : Chi-Squared                   64.95     using 59 bins.
 Reduced chi-squared =
# Null hypothesis probability of 2.19e-01 with 57 degrees of freedom

Energy  Fluence     90% Error
[keV]   [erg/cm2]   [erg/cm2]
15- 25  8.958e-09   2.396e-09
25- 50  5.035e-08   1.023e-08
50-150  2.256e-07   4.090e-08
15-150  2.849e-07   4.575e-08
Thermal bremsstrahlung (OTTB)

Spectral model: thermal bremsstrahlung
------------------------------------------------------------
Parameters  : value         Lower 90%    Upper 90%
kT [keV]    : 200.000       (-22.8377      -200)
Norm        : 12.7107       (-1.60258     1.60258)
------------------------------------------------------------
#Fit statistic  : Chi-Squared                   82.32     using 59 bins.
 Reduced chi-squared =
# Null hypothesis probability of 1.58e-02 with 57 degrees of freedom

Energy  Fluence     90% Error
[keV]   [erg/cm2]   [erg/cm2]
15- 25  3.164e-08   1.794e-08
25- 50  6.086e-08   3.407e-08
50-150  1.335e-07   7.350e-08
15-150  2.260e-07   1.247e-07
Double BB
Spectral model: bbodyrad<1> + bbodyrad<2>
------------------------------------------------------------
Parameters  : value         Lower 90%    Upper 90%
kT1 [keV]   : 9.01450        (-4.08491      4.56675)
R1^2/D10^2  : 0.954817        (-0.709722      5.7345)
kT2 [keV]   : 40.0663        (-13.3695      -40.4713)
R2^2/D10^2  : 1.69752E-02    (-0.0157289   0.0413473)
------------------------------------------------------------
#Fit statistic  : Chi-Squared                   53.27     using 59 bins.
 Reduced chi-squared =
# Null hypothesis probability of 5.41e-01 with 55 degrees of freedom

Energy  Fluence     90% Error
[keV]   [erg/cm2]   [erg/cm2]
15- 25  1.863e-08   1.086e-08
25- 50  5.618e-08   3.032e-08
50-150  2.419e-07   1.305e-07
15-150  3.167e-07   1.630e-07
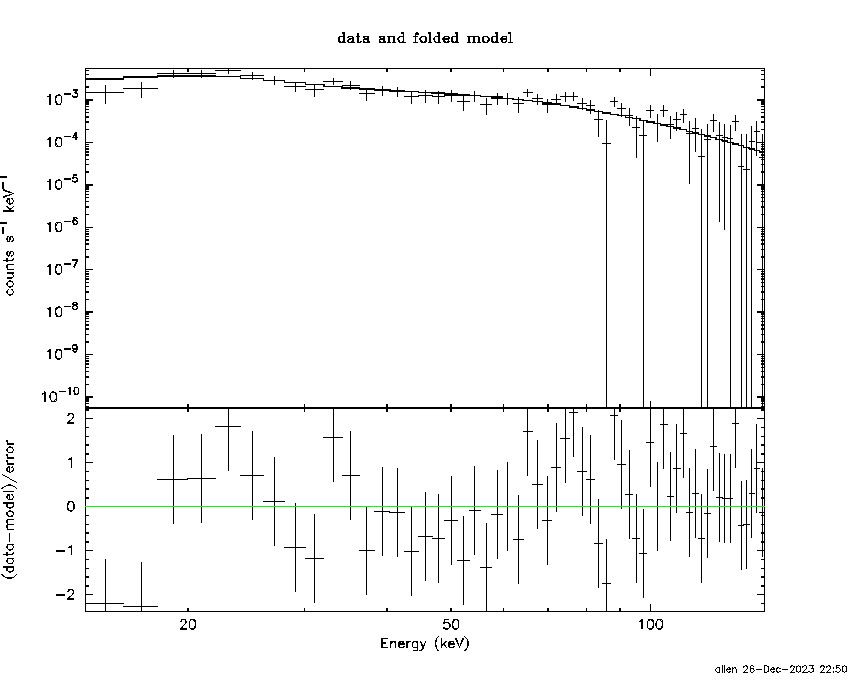
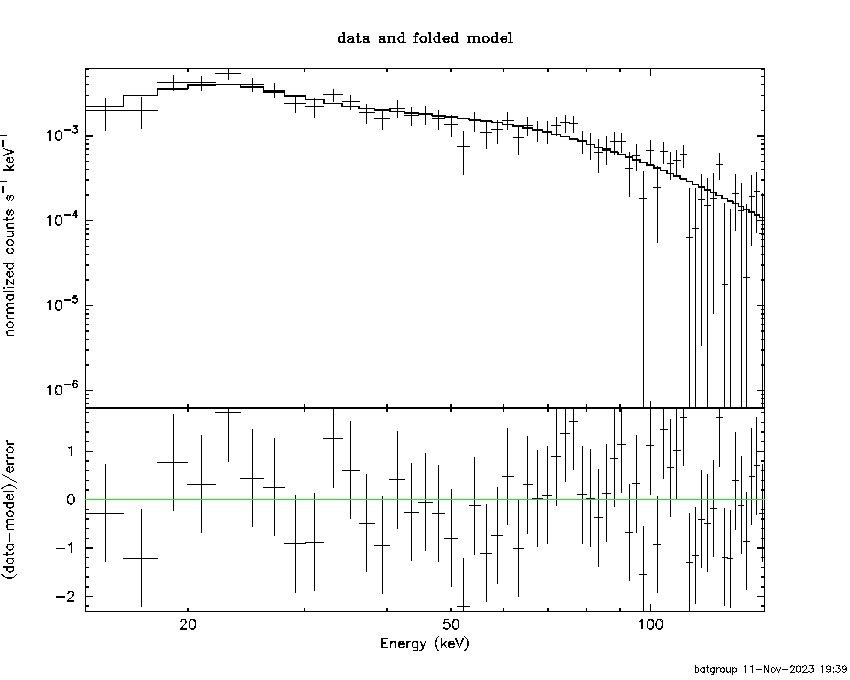
Pre-slew spectrum (Pre-slew PHA with pre-slew DRM)
Power-law model

Spectral model in power-law:
------------------------------------------------------------
Parameters  : value       lower 90%   higher 90%
Photon index: 1.40462     ( -0.120272   0.119653 )
Norm@50keV  : 9.45068E-03    ( -0.000652983   0.000652254 )
------------------------------------------------------------
#Fit statistic  : Chi-Squared                   60.79     using 59 bins.
 Reduced chi-squared =
# Null hypothesis probability of 3.41e-01 with 57 degrees of freedom

Photon flux (15-150 keV)    in 16.48 sec: 1.15213 ( -0.0827754  0.0829557 ) ph/cm2/s
Energy fluence (15-150 keV)             : 1.50351e-06 ( -1.12875e-07  1.13495e-07 ) ergs/cm2
Cutoff power-law model

Spectral model in the cutoff power-law:
------------------------------------------------------------
Parameters  : value       lower 90%   higher 90%
Photon index: 1.40148     ( -0.392622   0.166577 )
Epeak [keV] : 9997.85      ( -9997.76 -9997.76 )
Norm@50keV  : 9.48489E-03    ( -0.000655328   0.00591799 )
------------------------------------------------------------
#Fit statistic  : Chi-Squared                   60.79     using 59 bins.
 Reduced chi-squared =
# Null hypothesis probability of 3.08e-01 with 56 degrees of freedom

Photon flux (15-150 keV)    in 16.48 sec: 1.15107 ( -0.04327  0.08359 ) ph/cm2/s
Energy fluence (15-150 keV)             : 1.50531e-06 ( -1.2125e-07  1.11365e-07 ) ergs/cm2
Band function
Spectral model in the Band function:
------------------------------------------------------------
Parameters  : value       lower 90%   higher 90%
alpha       :    (     )
beta        :     (     )
Epeak [keV] :       (   )
Norm@50keV   :     (     )
------------------------------------------------------------

Photon flux (15-150 keV)    in  sec:  (    ) ph/cm2/s
Energy fluence (15-150 keV)             : 0 ( 0  0 ) ergs/cm2
S(25-50 keV) vs. S(50-100 keV) plot
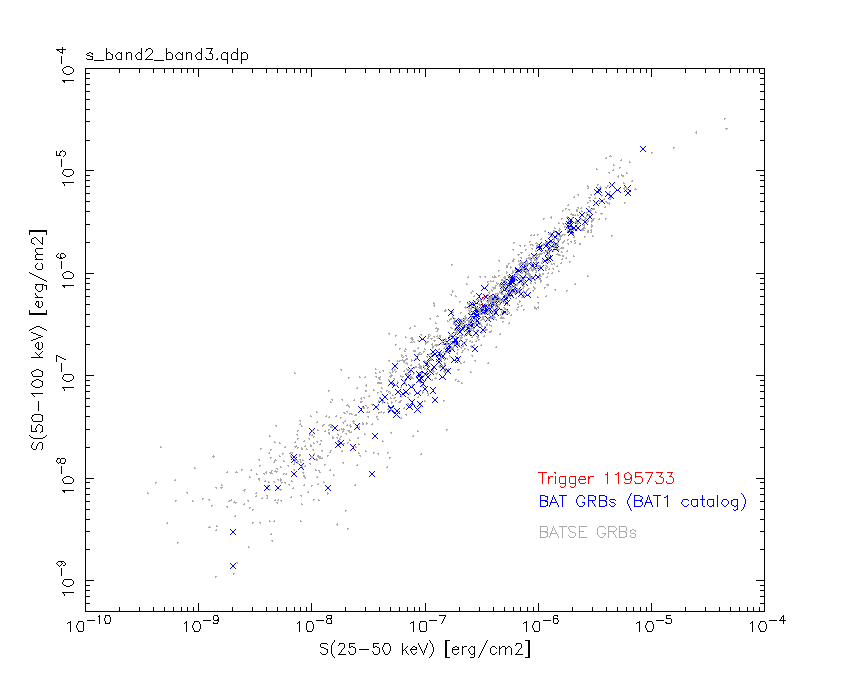
S(25-50 keV)  = 3.54e-07
S(50-100 keV) = 5.36e-07
T90 vs. Hardness ratio plot
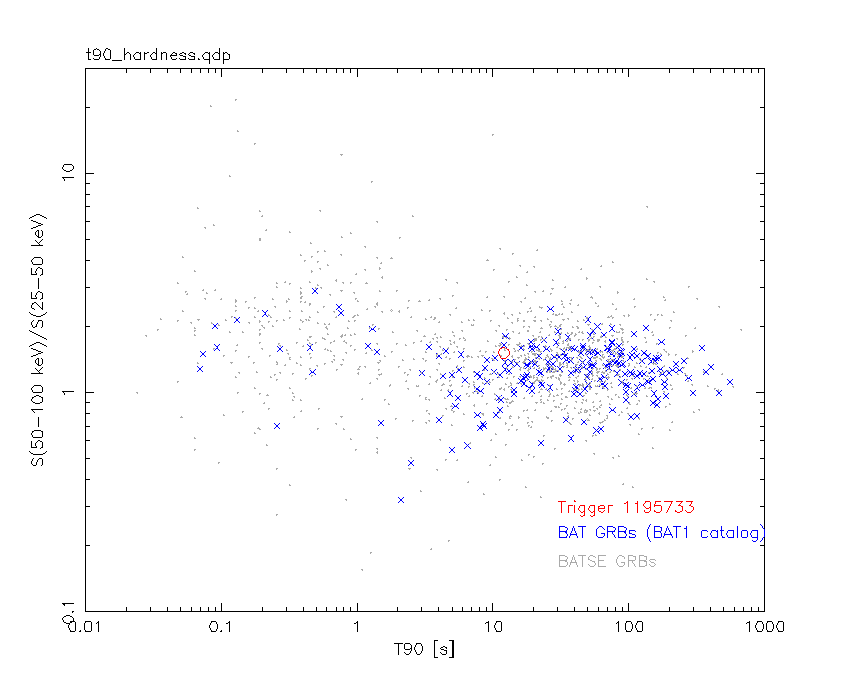
T90                                   = 12.0119999647141 sec.
Hardness ratio (energy fluence ratio) = 1.51412
Color vs. Color plot
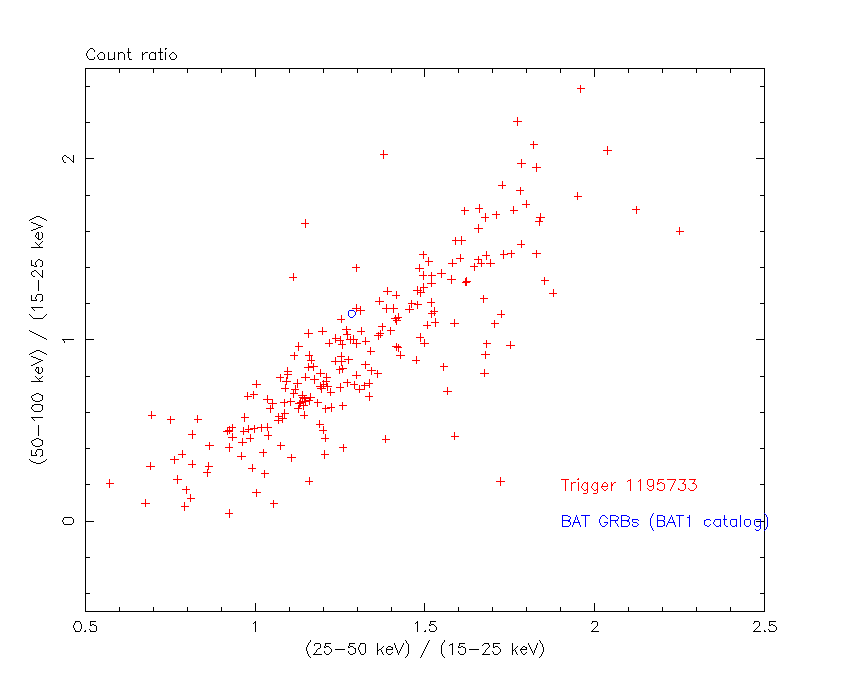
Count Ratio  (25-50 keV) / (15-25 keV) = 1.28462
Count Ratio (50-100 keV) / (15-25 keV) = 1.14539
Mask shadow pattern
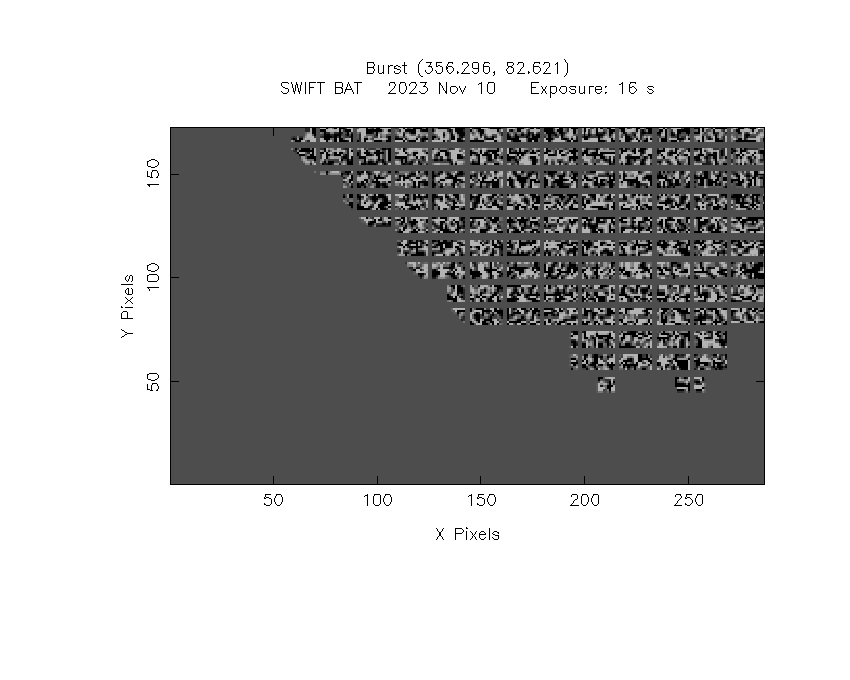
IMX = -6.937893841732251E-01, IMY = -4.059862301839708E-01
TIME vs. PHA plot around the trigger time
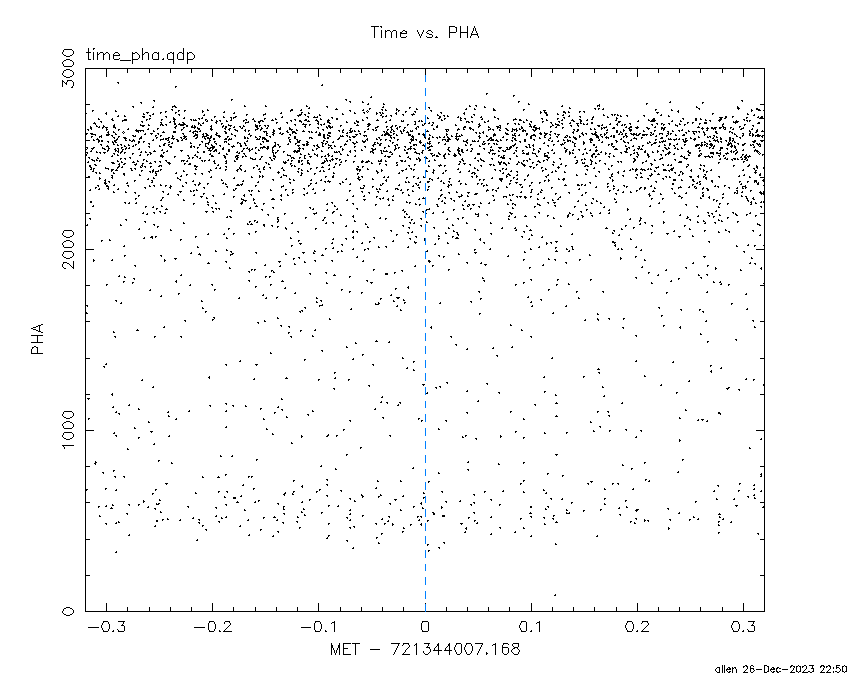
Blue+Cyan dotted lines: Time interval of the scaled map
From 0.000000 to 2.048000
TIME vs. DetID plot around the trigger time
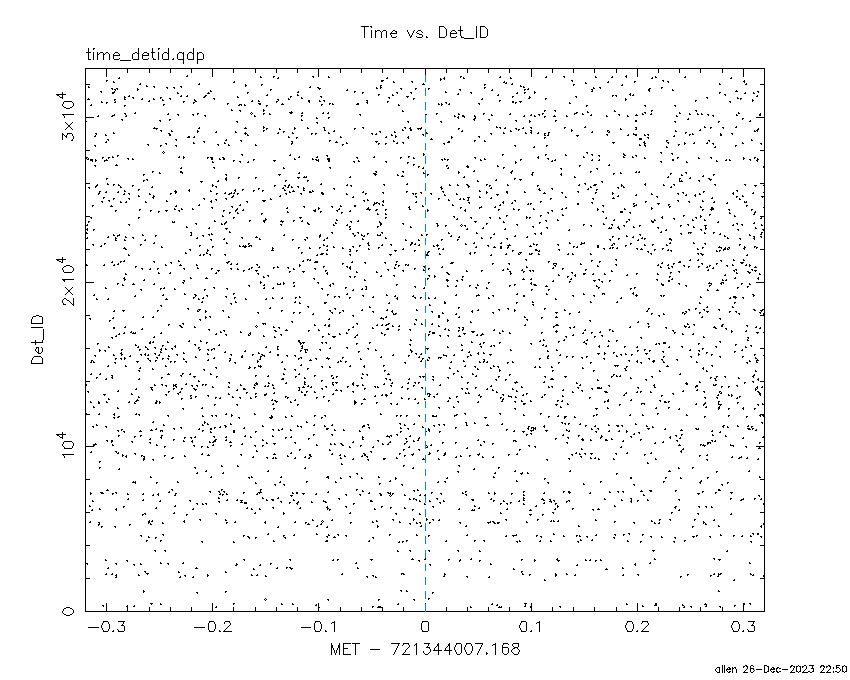
Blue+Cyan dotted lines: Time interval of the scaled map
From 0.000000 to 2.048000
100 us light curve (15-350 keV)
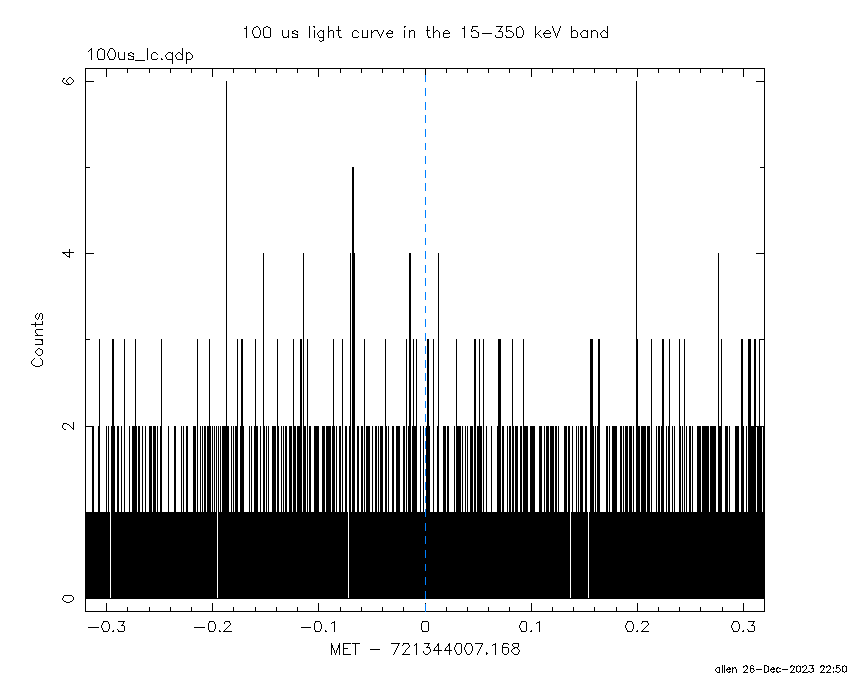
Blue+Cyan dotted lines: Time interval of the scaled map
From 0.000000 to 2.048000
Spacecraft aspect plot

Bright source in the pre-burst/pre-slew/post-slew images
Pre-burst image of 15-350 keV band
Time interval of the image:
-133.067410 -1.404000

# RAcent  DECcent POSerr Theta    Phi  PeakCts   SNR AngSep     Name
#  [deg]    [deg]    ['] [deg]  [deg]                   [']
168.3586  47.9006    3.0  10.9  -16.0   0.7631   3.8 ------	UNKNOWN
Pre-slew background subtracted image of 15-350 keV band
Time interval of the image:
-1.404000 15.076000

# RAcent  DECcent POSerr Theta    Phi  PeakCts   SNR AngSep     Name
#  [deg]    [deg]    ['] [deg]  [deg]                   [']
356.2546  82.6281    0.5  38.8  149.7   2.3323  22.1 ------	UNKNOWN
270.2835  79.2854    2.4  34.5  169.5   0.3322   4.7 ------	UNKNOWN
172.3993  45.5927    2.0  13.0  -30.4   0.2989   5.9 ------	UNKNOWN
220.7717  55.7642    2.3  25.9 -134.6   0.2994   5.0 ------	UNKNOWN
262.4749  42.2995    1.8  55.1 -145.1   1.7305   6.5 ------	UNKNOWN
Post-slew image of 15-350 keV band
Time interval of the image:
Plot creation:
Tue Dec 26 22:50:44 EST 2023