Estimated redshift from machine learning (Ukwatta et al. 2016) - may take a few minutes to calcaulte
Image
Pre-slew 15-350 keV image (Event data; bkg subtracted)

Foreground time interval of the image:
Background time interval of the image:
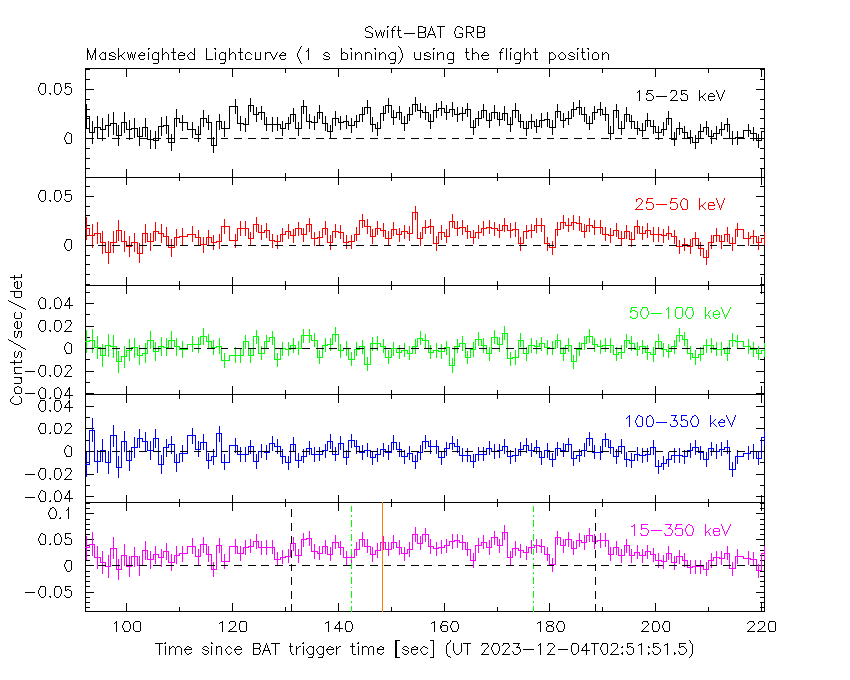
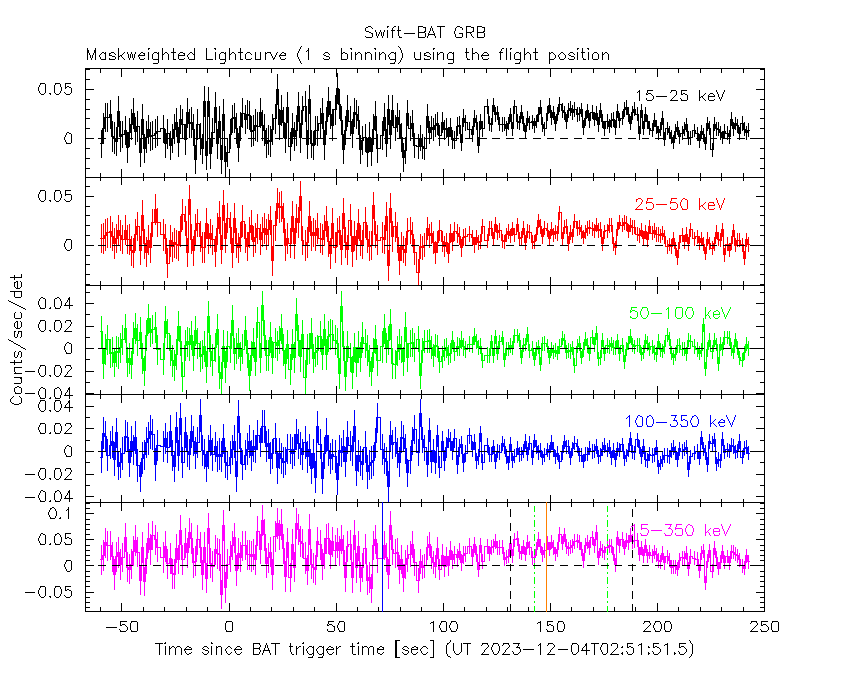
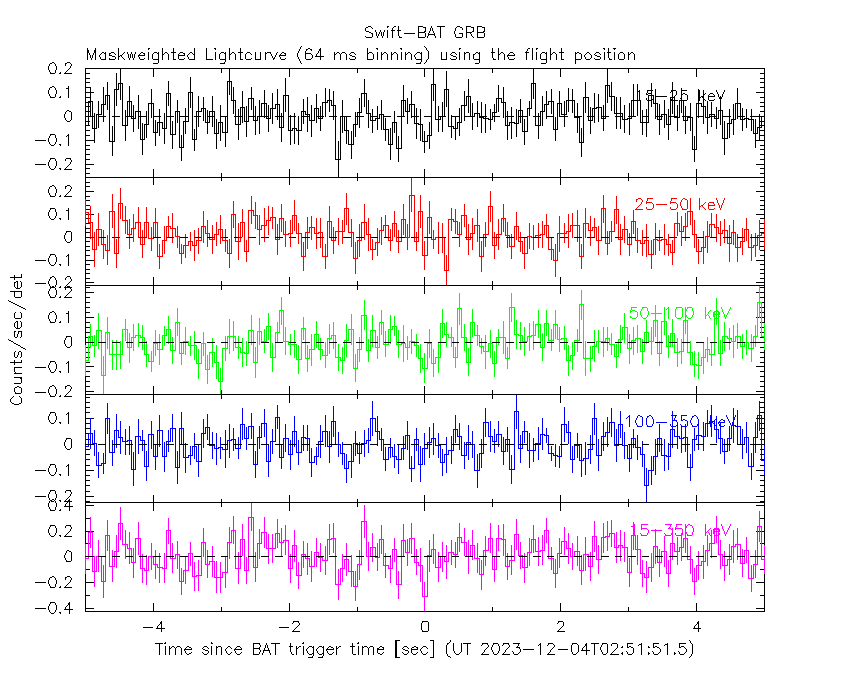
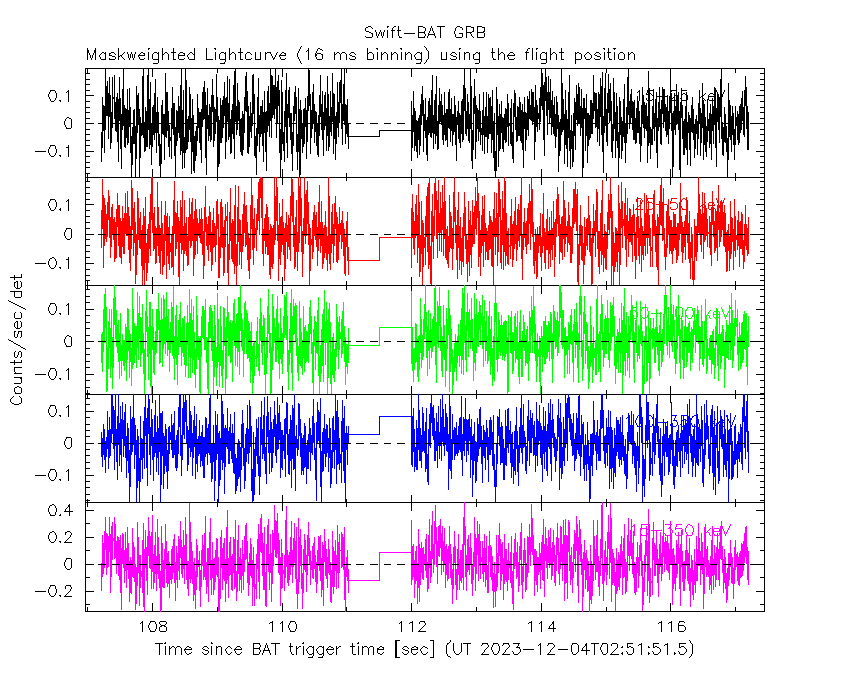
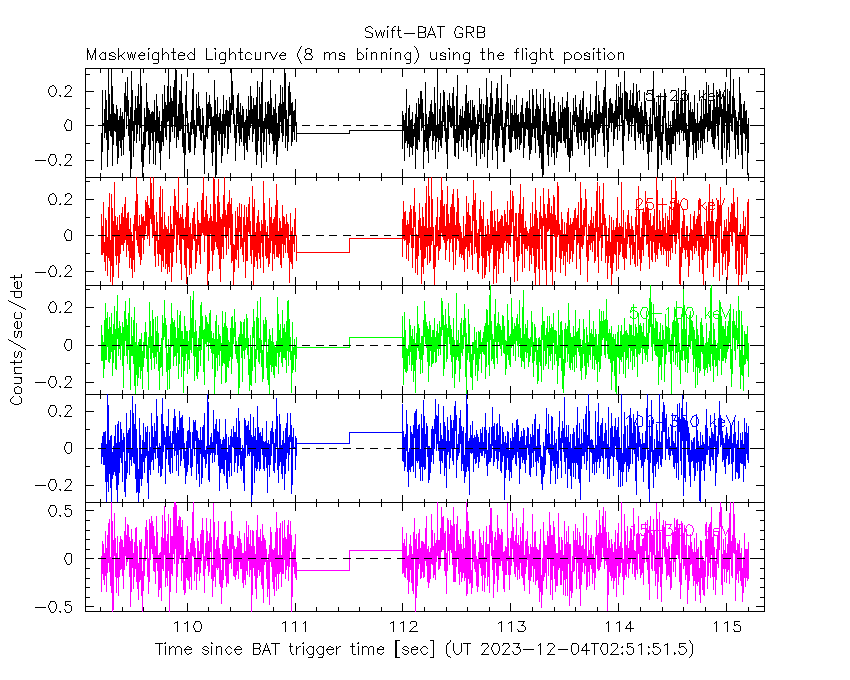
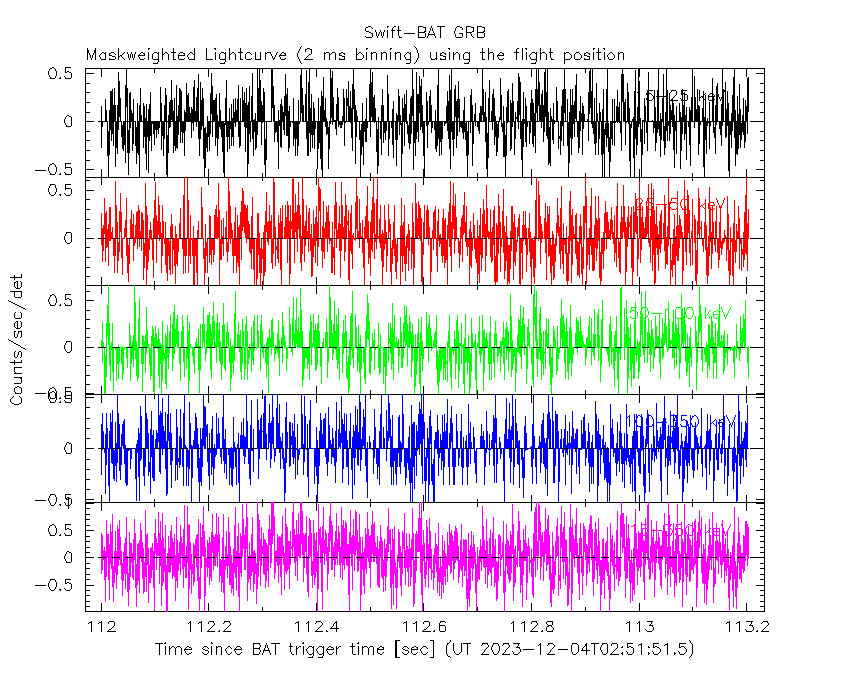
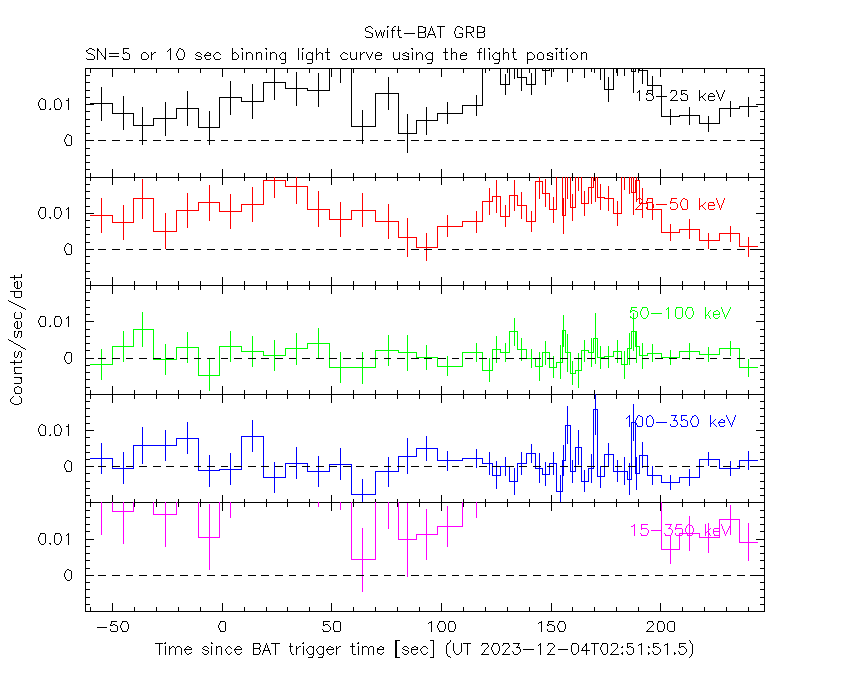
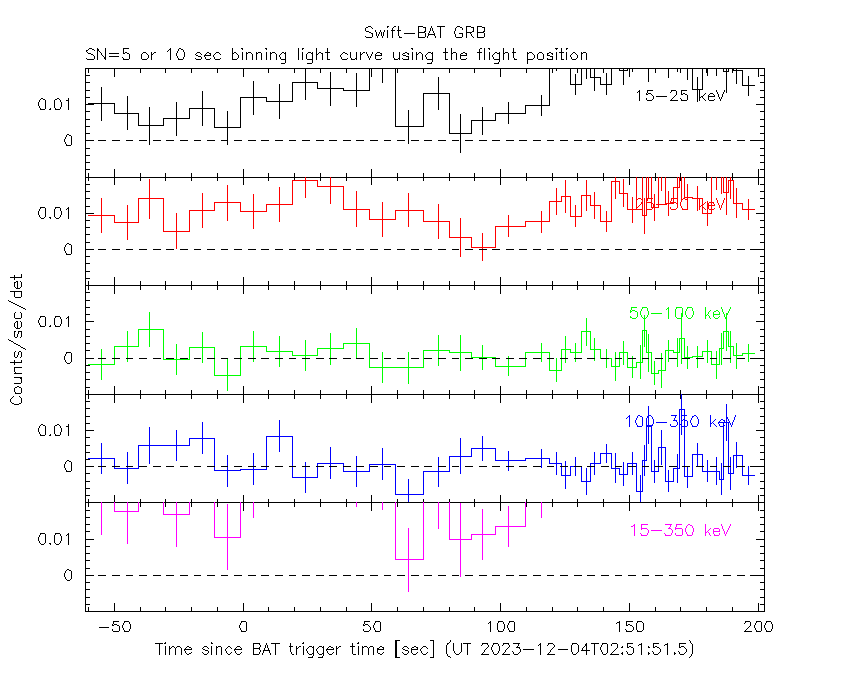
Lightcurves
Notes:
- 1) All plots contain as much data as has been downloaded to date.
- 2) The mask-weighted light curves are using the flight position.
- 3) Multiple plots of different time binning/intervals are shown to cover all scenarios of short/long GRBs, rate/image triggers, and real/false positives.
- 4) For all the mask-weighted lightcurves, the y-axis units are counts/sec/det where a det is 0.4 x 0.4 = 0.16 sq cm.
- 5) The verticle lines correspond to following: green dotted lines are T50 interval, black dotted lines are T90 interval, blue solid line(s) is a spacecraft slew start time, and orange solid line(s) is a spacecraft slew end time.
- 6) Time of each bin is in the middle of the bin.
1 s binning
From T0-310 s to T0+310 s

From T100_start - 20 s to T100_end + 30 s
Full time interval
64 ms binning
Full time interval

From T100_start to T100_end

From T0-5 sec to T0+5 sec
16 ms binning
From T100_start-5 s to T100_start+5 s
8 ms binning
From T100_start-3 s to T100_start+3 s
2 ms binning
From T100_start-1 s to T100_start+1 s
SN=5 or 10 sec. binning (whichever binning is satisfied first)
SN=5 or 10 sec. binning (T < 200 sec)
Spectra
Notes:
- 1) The fitting includes the systematic errors.
- 2) For long bursts, a spectral fit of the pre-slew DRM will introduce some errors in both a spectral shape and a normalization if the PHA file contains a lot of the slew/post-slew time interval.
- 3) For fits to more complicated models (e.g. a power-law over a cutoff power-law), the BAT team has decided to require a chi-square improvement of more than 6 for each extra dof.
- 4) For short bursts (T90<1sec), the specrtum is also fit with Blackbody, OTTB, and Double Blackbody.
Time averaged spectrum fit using the pre-slew DRM
Power-law model

Multiple GTIs in the spectrum
tstart tstop
112.204000 119.140000
120.000000 190.572000
Usage: bat_spec_fit_sys_xspec12.sh (pha file) (response file) (script folder) (folder of taka's xspec lmodel)
       This script tries to add the systematic column to the PHA
       file before doing the fitting
script folder: /local/data/BATtools/battools/bin/GRB_spec_fit_v2
folder of taka's xspec lmodel: /local/data/bat1/prebascript/xspec_taka_lmodel
Cutoff power-law model

Multiple GTIs in the spectrum
tstart tstop
112.204000 119.140000
120.000000 190.572000
Usage: bat_spec_fit_cutoff_sys_xspec12.sh (pha file) (response file) (script folder) (folder of taka's xspec lmodel)
       This script tries to add the systematic column to the PHA
       file before doing the fitting
script folder: /local/data/bat2/BATtools/battools/bin/GRB_spec_fit_v2
folder of taka's xspec lmodel: /local/data/bat1/prebascript/xspec_taka_lmodel
Band function

Multiple GTIs in the spectrum
tstart tstop
112.204000 119.140000
120.000000 190.572000
Usage: bat_spec_fit_band_sys.sh (pha file) (response file) (script folder) (folder of taka's xspec lmodel)
       This script tries to add the systematic column to the PHA
       file before doing the fitting
script folder: /local/data/bat2/BATtools/battools/bin/GRB_spec_fit_v2
folder of taka's xspec lmodel: /local/data/bat1/prebascript/xspec_taka_lmodel
Single BB

Usage: bat_spec_fit_bb_sys.sh (pha file) (response file)
       This script tries to add the systematic column to the PHA
       file before doing the fitting
Thermal bremsstrahlung (OTTB)

Usage: bat_spec_fit_brems_sys.sh (pha file) (response file)
       This script tries to add the systematic column to the PHA
       file before doing the fitting
Double BB

Usage: bat_spec_fit_2bb_sys.sh (pha file) (response file)
       This script tries to add the systematic column to the PHA
       file before doing the fitting
Peak spectrum fit
Power-law model

Time interval is from  169.452 sec. to  170.452 sec.
Usage: bat_spec_fit_sys_xspec12.sh (pha file) (response file) (script folder) (folder of taka's xspec lmodel)
       This script tries to add the systematic column to the PHA
       file before doing the fitting
script folder: /local/data/BATtools/battools/bin/GRB_spec_fit_v2
folder of taka's xspec lmodel: /local/data/bat1/prebascript/xspec_taka_lmodel
Cutoff power-law model

Time interval is from  169.452 sec. to  170.452 sec.
Usage: bat_spec_fit_cutoff_sys_xspec12.sh (pha file) (response file) (script folder) (folder of taka's xspec lmodel)
       This script tries to add the systematic column to the PHA
       file before doing the fitting
script folder: /local/data/bat2/BATtools/battools/bin/GRB_spec_fit_v2
folder of taka's xspec lmodel: /local/data/bat1/prebascript/xspec_taka_lmodel
Band function

Time interval is from  169.452 sec. to  170.452 sec.
Usage: bat_spec_fit_band_sys.sh (pha file) (response file) (script folder) (folder of taka's xspec lmodel)
       This script tries to add the systematic column to the PHA
       file before doing the fitting
script folder: /local/data/bat2/BATtools/battools/bin/GRB_spec_fit_v2
folder of taka's xspec lmodel: /local/data/bat1/prebascript/xspec_taka_lmodel
Single BB

Usage: bat_spec_fit_bb_sys.sh (pha file) (response file)
       This script tries to add the systematic column to the PHA
       file before doing the fitting
Thermal bremsstrahlung (OTTB)

Usage: bat_spec_fit_brems_sys.sh (pha file) (response file)
       This script tries to add the systematic column to the PHA
       file before doing the fitting
Double BB

Usage: bat_spec_fit_2bb_sys.sh (pha file) (response file)
       This script tries to add the systematic column to the PHA
       file before doing the fitting
Pre-slew spectrum (Pre-slew PHA with pre-slew DRM)
Power-law model

Cutoff power-law model

Band function

S(25-50 keV) vs. S(50-100 keV) plot

S(25-50 keV)  = --------
S(50-100 keV) = --------
T90 vs. Hardness ratio plot

T90                                   = 57.3599998950958 sec.
Hardness ratio (energy fluence ratio) =
Color vs. Color plot
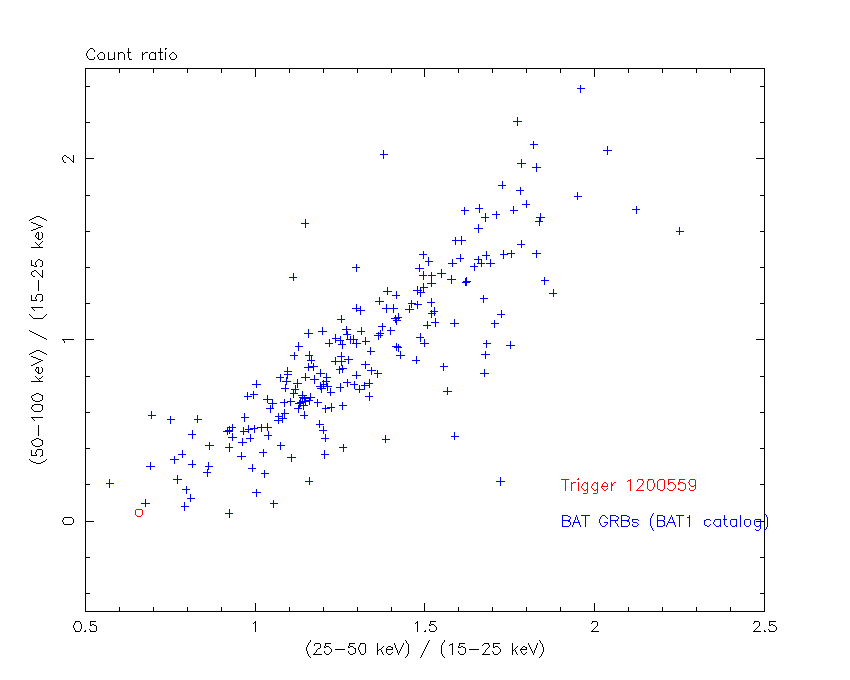
Count Ratio  (25-50 keV) / (15-25 keV) = 0.657984
Count Ratio (50-100 keV) / (15-25 keV) = 0.0458131
Mask shadow pattern

IMX = 0, IMY = 0
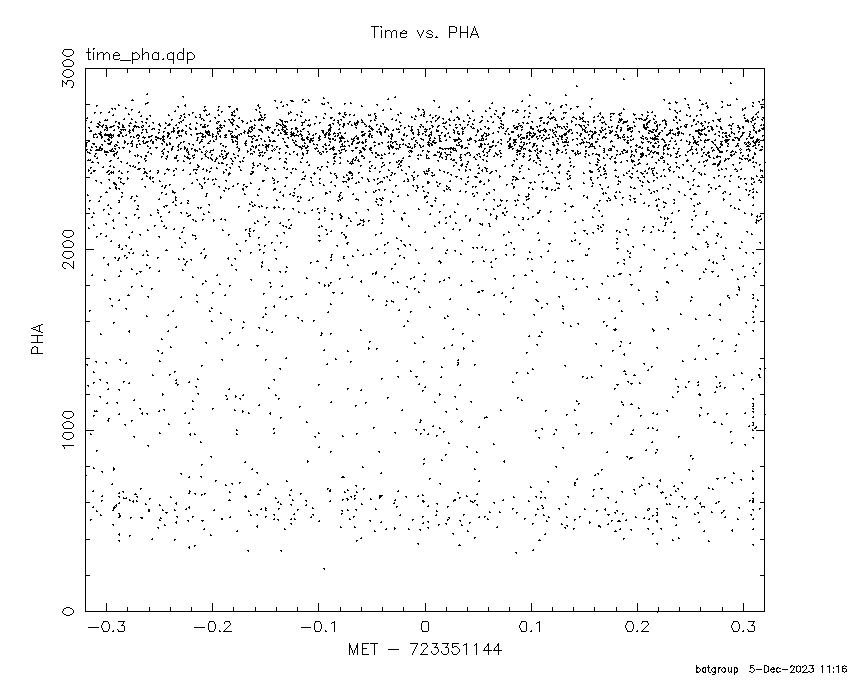
TIME vs. PHA plot around the trigger time
TIME vs. DetID plot around the trigger time

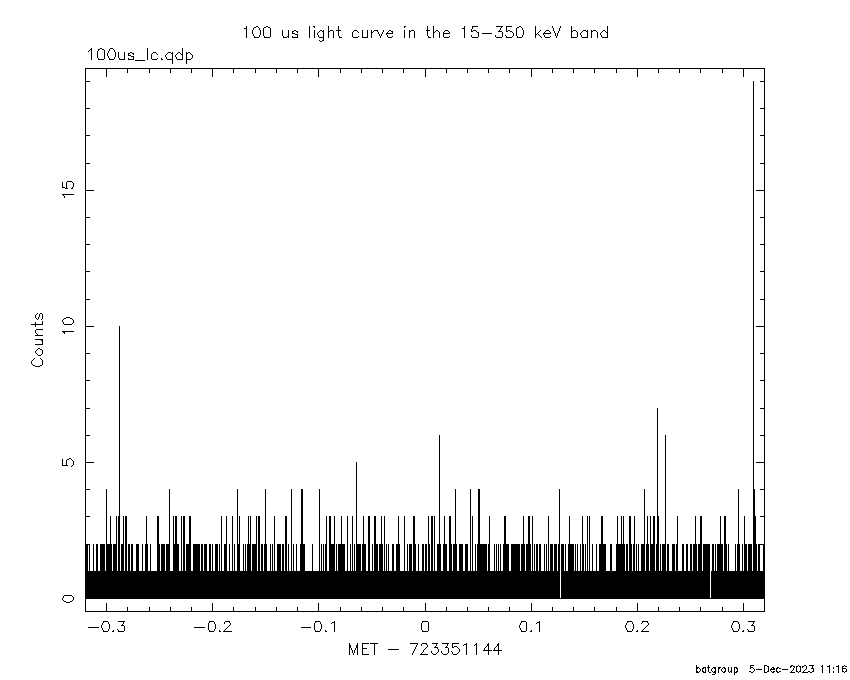
100 us light curve (15-350 keV)
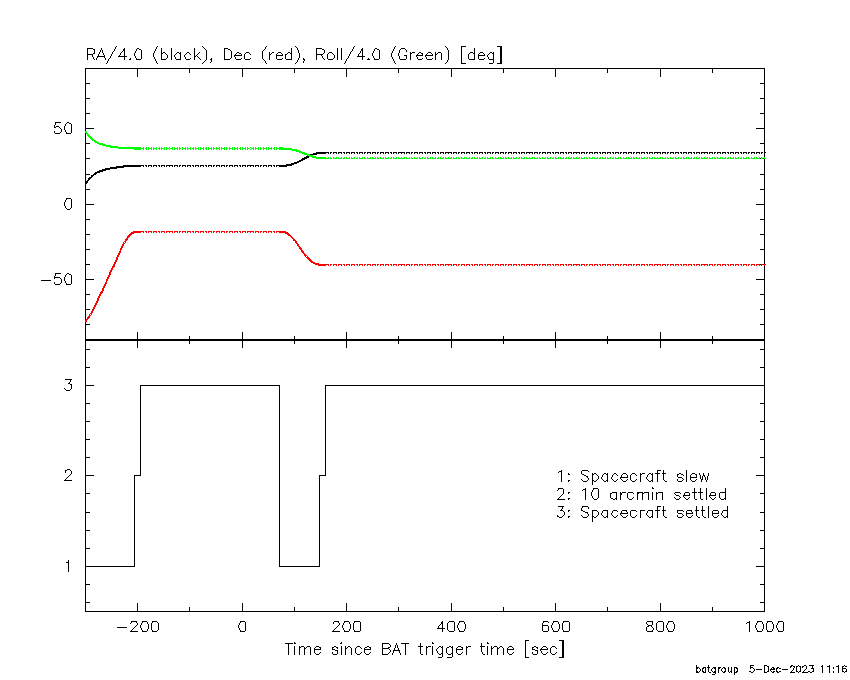
Spacecraft aspect plot
Bright source in the pre-burst/pre-slew/post-slew images
Pre-burst image of 15-350 keV band
Time interval of the image:
-60.000000 -32.423000
-31.000000 70.080000
71.000000 71.600600

# RAcent  DECcent POSerr Theta    Phi  PeakCts   SNR AngSep     Name
#  [deg]    [deg]    ['] [deg]  [deg]                   [']
135.5680 -40.4158    4.1  36.7 -103.0   1.5966   2.8    8.5	Vela X-1
 61.5737 -11.5802    2.6  39.1   36.5   1.9433   4.4 ------	UNKNOWN
 69.7580 -55.3010    2.6  44.2  -32.1   1.8659   4.4 ------	UNKNOWN
152.9444 -25.6385    2.1  48.0 -129.0   5.8744   5.6 ------	UNKNOWN
Pre-slew background subtracted image of 15-350 keV band
Time interval of the image:
Post-slew image of 15-350 keV band
Time interval of the image:
148.400590 216.300000
217.000000 243.061700

# RAcent  DECcent POSerr Theta    Phi  PeakCts   SNR AngSep     Name
#  [deg]    [deg]    ['] [deg]  [deg]                   [']
135.6319 -40.4269    2.2   0.2   -7.6   1.0092   5.2    9.0	Vela X-1
170.4663 -60.5569    4.9  29.4  -67.0  -0.5955  -2.4    5.9	Cen X-3
186.3511 -62.8494    6.6  37.3  -67.8   0.7208   1.7    9.6	GX 301-2
144.1403  -6.6914    2.3  34.4  162.7   1.3220   4.9 ------	UNKNOWN
162.9447 -41.1038    2.4  20.6 -110.9   0.9494   4.8 ------	UNKNOWN
188.1480 -21.4303    2.2  48.0 -129.0   4.8675   5.3 ------	UNKNOWN
Plot creation:
Tue Dec  5 11:17:00 EST 2023