Estimated redshift from machine learning (Ukwatta et al. 2016) - may take a few minute to calcaulte
Image
Pre-slew 15.0-350.0 keV image (Event data)
#   RAcent    DECcent   POSerr    Theta     Phi              Peak Cts       SNR   Name
  305.6688   -72.4314   0.0055    34.8187  -124.5726         8.6888983     34.389 TRIG_01202386

Foreground time interval of the image:
 -5.368  14.637 (delta_t =  20.005 [sec])
Background time interval of the image:
-60.864  -5.368 (delta_t =  55.496 [sec])
Lightcurves
Notes:
- 1) The mask-weighted light curves are using the flight position.
- 2) Multiple plots of different time binning/intervals are shown to cover all scenarios of short/long GRBs, rate/image triggers, and real/false positives.
- 3) For all the mask-weighted lightcurves, the y-axis units are counts/sec/det where a det is 0.4 x 0.4 = 0.16 sq cm.
- 4) The verticle lines correspond to following: green dotted lines are T50 interval, black dotted lines are T90 interval, blue solid line(s) is a spacecraft slew start time, and orange solid line(s) is a spacecraft slew end time.
- 5) Time of each bin is in the middle of the bin.
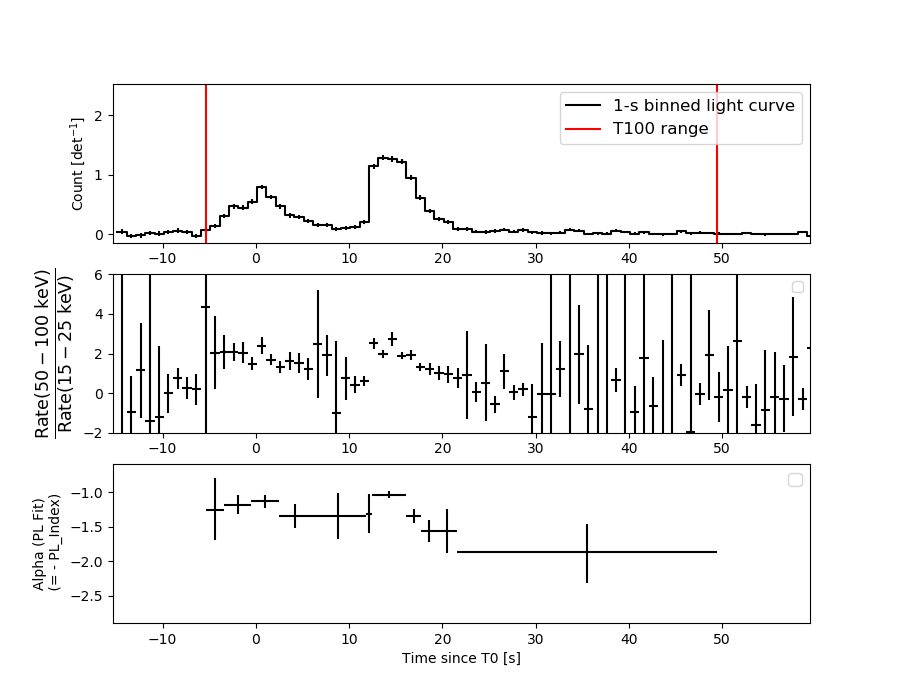
1 s binning
From T0-310 s to T0+310 s
From T100_start - 20 s to T100_end + 30 s

Full time interval

64 ms binning
Full time interval
From T100_start to T100_end

From T0-5 sec to T0+5 sec
16 ms binning
From T100_start-5 s to T100_start+5 s
Blue+Cyan dotted lines: Time interval of the scaled map
From 0.000000 to 1.024000
8 ms binning
From T100_start-3 s to T100_start+3 s

Blue+Cyan dotted lines: Time interval of the scaled map
From 0.000000 to 1.024000
2 ms binning
From T100_start-1 s to T100_start+1 s

Blue+Cyan dotted lines: Time interval of the scaled map
From 0.000000 to 1.024000
SN=5 or 10 sec. binning (whichever binning is satisfied first)
SN=5 or 10 sec. binning (T < 200 sec)

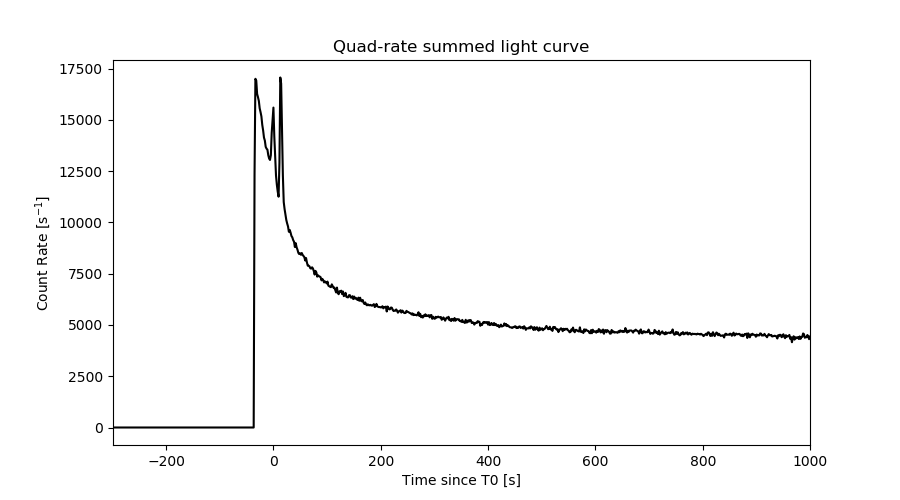
Quad-rate summed light curves (from T0-300s to T0+1000s)
Spectral Evolution
Spectra
Notes:
- 1) The fitting includes the systematic errors.
- 2) When the burst includes telescope slew time periods, the fitting uses an average response file made from multiple 5-s response files through out the slew time plus single time preiod for the non-slew times, and weighted by the total counts in the corresponding time period using addrmf. An average response file is needed becuase a spectral fit using the pre-slew DRM will introduce some errors in both a spectral shape and a normalization if the PHA file contains a lot of the slew/post-slew time interval.
- 3) For fits to more complicated models (e.g. a power-law over a cutoff power-law), the BAT team has decided to require a chi-square improvement of more than 6 for each extra dof.
Time averaged spectrum fit using the average DRM
Power-law model

Time interval is from   -5.368 sec. to   49.420 sec.

Spectral model in power-law:
------------------------------------------------------------
Parameters  : value       lower 90%   higher 90%
Photon index: 1.25119     ( -0.0538469   0.0536518 )
Norm@50keV  : 1.79607E-02    ( -0.000538575   0.000538445 )
------------------------------------------------------------
#Fit statistic  : Chi-Squared                   69.43     using 59 bins.
 Reduced chi-squared = 1.21807
# Null hypothesis probability of 1.25e-01 with 57 degrees of freedom

Photon flux (15-150 keV)    in 54.79 sec: 2.12469 ( -0.06791  0.06802 ) ph/cm2/s
Energy fluence (15-150 keV)             : 9.84648e-06 ( -3.14316e-07  3.15106e-07 ) ergs/cm2
Cutoff power-law model

Time interval is from   -5.368 sec. to   49.420 sec.
Spectral model in the cutoff power-law:
------------------------------------------------------------
Parameters  : value       lower 90%   higher 90%
Photon index: 0.882333     ( -0.234526   0.222689 )
Epeak [keV] : 171.015      ( -45.0378 163.706 )
Norm@50keV  : 2.63279E-02    ( -0.00530745   0.0070244 )
------------------------------------------------------------
#Fit statistic  : Chi-Squared                   61.21     using 59 bins.
 Reduced chi-squared = 1.09304
# Null hypothesis probability of 2.94e-01 with 56 degrees of freedom

Photon flux (15-150 keV)    in 54.79 sec: 2.08175 ( -0.07218  0.07238 ) ph/cm2/s
Energy fluence (15-150 keV)             : 9.6534e-06 ( -3.39287e-07  3.37659e-07 ) ergs/cm2
Band function

Time interval is from   -5.368 sec. to   49.420 sec.


Spectral model in the Band function:
------------------------------------------------------------
Parameters  : value       lower 90%   higher 90%
alpha       :    (     )
beta        :     (     )
Epeak [keV] :       (   )
Norm@50keV   :     (     )
------------------------------------------------------------

Photon flux (15-150 keV)    in  sec:  (    ) ph/cm2/s
Energy fluence (15-150 keV)             : 0 ( 0  0 ) ergs/cm2
Single BB

Spectral model blackbody:
------------------------------------------------------------
Parameters  : value    Lower 90%  Upper 90%
kT [keV]    : 19.0712  (  )
R^2/D10^2   : 0.112354  (   )
(R is the radius in km and D10 is the distance to the source in units of 10 kpc)
------------------------------------------------------------
#Fit statistic  : Chi-Squared                  229.11     using 59 bins.
 Reduced chi-squared =
# Null hypothesis probability of 1.70e-22 with 57 degrees of freedom

Energy  Fluence     90% Error
[keV]   [erg/cm2]   [erg/cm2]
15- 25  4.395e-07   2.739e-08
25- 50  2.119e-06   9.369e-08
50-150  5.669e-06   2.772e-07
15-150  8.228e-06   2.959e-07
Thermal bremsstrahlung (OTTB)

Spectral model: thermal bremsstrahlung
------------------------------------------------------------
Parameters  : value         Lower 90%    Upper 90%
kT [keV]    : 199.363       (      )
Norm        : 8.98260       (     )
------------------------------------------------------------
#Fit statistic  : Chi-Squared                  158.69     using 59 bins.
 Reduced chi-squared =
# Null hypothesis probability of 1.58e-11 with 57 degrees of freedom

Energy  Fluence     90% Error
[keV]   [erg/cm2]   [erg/cm2]
15- 25  1.225e-06   3.863e-08
25- 50  2.357e-06   7.999e-08
50-150  5.170e-06   1.745e-07
15-150  8.753e-06   2.931e-07
Double BB

Spectral model: bbodyrad<1> + bbodyrad<2>
------------------------------------------------------------
Parameters  : value         Lower 90%    Upper 90%
kT1 [keV]   : 8.71140        (-1.25523      1.42881)
R1^2/D10^2  : 0.847261        (-0.289765      0.507493)
kT2 [keV]   : 31.3292        (-3.9374      6.46187)
R2^2/D10^2  : 1.74316E-02    (-0.008173   0.0106921)
------------------------------------------------------------
#Fit statistic  : Chi-Squared                   66.88     using 59 bins.
 Reduced chi-squared =
# Null hypothesis probability of 1.31e-01 with 55 degrees of freedom

Energy  Fluence     90% Error
[keV]   [erg/cm2]   [erg/cm2]
15- 25  8.165e-07   9.616e-08
25- 50  2.256e-06   1.786e-07
50-150  6.569e-06   6.410e-07
15-150  9.641e-06   9.205e-07
Peak spectrum fit
Power-law model

Time interval is from   12.572 sec. to   13.572 sec.

Spectral model in power-law:
------------------------------------------------------------
Parameters  : value       lower 90%   higher 90%
Photon index: 0.892976     ( -0.0938206   0.0921557 )
Norm@50keV  : 9.89504E-02    ( -0.00549766   0.00547629 )
------------------------------------------------------------
#Fit statistic  : Chi-Squared                   67.55     using 59 bins.
 Reduced chi-squared = 1.18509
# Null hypothesis probability of 1.60e-01 with 57 degrees of freedom

Photon flux (15-150 keV)    in 1 sec: 0.606597 ( -0.030182  0.061394 ) ph/cm2/s
Energy fluence (15-150 keV)             : 1.11365e-06 ( -6.41076e-08  6.42543e-08 ) ergs/cm2
Cutoff power-law model

Time interval is from   12.572 sec. to   13.572 sec.
Spectral model in the cutoff power-law:
------------------------------------------------------------
Parameters  : value       lower 90%   higher 90%
Photon index: 0.608339     ( -0.388363   0.318442 )
Epeak [keV] : 296.024      ( -135.166 -296.024 )
Norm@50keV  : 0.130861    ( -0.0344049   0.0574791 )
------------------------------------------------------------
#Fit statistic  : Chi-Squared                   65.70     using 59 bins.
 Reduced chi-squared = 1.17321
# Null hypothesis probability of 1.76e-01 with 56 degrees of freedom

Photon flux (15-150 keV)    in 1 sec: 1.38775E-04 ( -0.000138775  -0.000138775 ) ph/cm2/s
Energy fluence (15-150 keV)             : 1.10599e-06 ( -6.56387e-08  6.55038e-08 ) ergs/cm2
Band function

Time interval is from   12.572 sec. to   13.572 sec.


Spectral model in the Band function:
------------------------------------------------------------
Parameters  : value       lower 90%   higher 90%
alpha       :    (     )
beta        :     (     )
Epeak [keV] :       (   )
Norm@50keV   :     (     )
------------------------------------------------------------

Photon flux (15-150 keV)    in  sec:  (    ) ph/cm2/s
Energy fluence (15-150 keV)             : 0 ( 0  0 ) ergs/cm2
Single BB

Spectral model blackbody:
------------------------------------------------------------
Parameters  : value    Lower 90%  Upper 90%
kT [keV]    : 24.9228  (-1.79144  2.00383)
R^2/D10^2   : 0.288780  (-0.0606389   0.0743943)
(R is the radius in km and D10 is the distance to the source in units of 10 kpc)
------------------------------------------------------------
#Fit statistic  : Chi-Squared                  111.52     using 59 bins.
 Reduced chi-squared =
# Null hypothesis probability of 2.14e-05 with 57 degrees of freedom

Energy  Fluence     90% Error
[keV]   [erg/cm2]   [erg/cm2]
15- 25  3.121e-08   3.780e-09
25- 50  1.768e-07   1.400e-08
50-150  8.147e-07   6.610e-08
15-150  1.023e-06   7.090e-08
Thermal bremsstrahlung (OTTB)

Spectral model: thermal bremsstrahlung
------------------------------------------------------------
Parameters  : value         Lower 90%    Upper 90%
kT [keV]    : 199.363       (      )
Norm        : 45.1596       (     )
------------------------------------------------------------
#Fit statistic  : Chi-Squared                  201.86     using 59 bins.
 Reduced chi-squared =
# Null hypothesis probability of 4.52e-18 with 57 degrees of freedom

Energy  Fluence     90% Error
[keV]   [erg/cm2]   [erg/cm2]
15- 25  1.125e-07   7.250e-09
25- 50  2.163e-07   1.605e-08
50-150  4.744e-07   1.110e-07
15-150  8.032e-07   1.053e-07
Double BB

Spectral model: bbodyrad<1> + bbodyrad<2>
------------------------------------------------------------
Parameters  : value         Lower 90%    Upper 90%
kT1 [keV]   : 7.12626        (-1.61569      2.13869)
R1^2/D10^2  : 6.27431        (-3.53763      9.21296)
kT2 [keV]   : 33.0785        (-4.04182      6.26974)
R2^2/D10^2  : 0.110943    (-0.0463363   0.0567716)
------------------------------------------------------------
#Fit statistic  : Chi-Squared                   63.24     using 59 bins.
 Reduced chi-squared =
# Null hypothesis probability of 2.08e-01 with 55 degrees of freedom

Energy  Fluence     90% Error
[keV]   [erg/cm2]   [erg/cm2]
15- 25  6.998e-08   2.607e-08
25- 50  1.883e-07   4.430e-08
50-150  8.584e-07   1.240e-07
15-150  1.117e-06   1.735e-07
Pre-slew spectrum (Pre-slew PHA with pre-slew DRM)
Power-law model

Spectral model in power-law:
------------------------------------------------------------
Parameters  : value       lower 90%   higher 90%
Photon index: 1.15743     ( -0.0603338   0.0599587 )
Norm@50keV  : 3.01572E-02    ( -0.00103089   0.00103019 )
------------------------------------------------------------
#Fit statistic  : Chi-Squared                   66.42     using 59 bins.
 Reduced chi-squared =
# Null hypothesis probability of 1.84e-01 with 57 degrees of freedom

Photon flux (15-150 keV)    in 20 sec: 3.52010 ( -0.126412  0.126587 ) ph/cm2/s
Energy fluence (15-150 keV)             : 6.19522e-06 ( -2.24714e-07  2.25052e-07 ) ergs/cm2
Cutoff power-law model

Spectral model in the cutoff power-law:
------------------------------------------------------------
Parameters  : value       lower 90%   higher 90%
Photon index: 0.768775     ( -0.263712   0.248717 )
Epeak [keV] : 181.408      ( -50.6836 205.112 )
Norm@50keV  : 4.49284E-02    ( -0.00989442   0.0135147 )
------------------------------------------------------------
#Fit statistic  : Chi-Squared                   59.11     using 59 bins.
 Reduced chi-squared =
# Null hypothesis probability of 3.63e-01 with 56 degrees of freedom

Photon flux (15-150 keV)    in 20 sec: 3.45349 ( -0.13267  0.13288 ) ph/cm2/s
Energy fluence (15-150 keV)             : 6.08438e-06 ( -2.3988e-07  2.3872e-07 ) ergs/cm2
Band function

Spectral model in the Band function:
------------------------------------------------------------
Parameters  : value       lower 90%   higher 90%
alpha       :    (     )
beta        :     (     )
Epeak [keV] :       (   )
Norm@50keV   :     (     )
------------------------------------------------------------

Photon flux (15-150 keV)    in  sec:  (    ) ph/cm2/s
Energy fluence (15-150 keV)             : 0 ( 0  0 ) ergs/cm2
S(25-50 keV) vs. S(50-100 keV) plot

S(25-50 keV)  = 2.13e-06
S(50-100 keV) = 3.58e-06
T90 vs. Hardness ratio plot
T90                                   = 27.635999917984 sec.
Hardness ratio (energy fluence ratio) = 1.68075
Color vs. Color plot

Count Ratio  (25-50 keV) / (15-25 keV) = 1.75756
Count Ratio (50-100 keV) / (15-25 keV) = 1.63601
Mask shadow pattern

IMX = -3.946623614373017E-01, IMY = 5.726816273078305E-01
TIME vs. PHA plot around the trigger time

Blue+Cyan dotted lines: Time interval of the scaled map
From 0.000000 to 1.024000
TIME vs. DetID plot around the trigger time
Blue+Cyan dotted lines: Time interval of the scaled map
From 0.000000 to 1.024000
100 us light curve (15-350 keV)
Blue+Cyan dotted lines: Time interval of the scaled map
From 0.000000 to 1.024000
Spacecraft aspect plot

Bright source in the pre-burst/pre-slew/post-slew images
Pre-burst image of 15-350 keV band
Time interval of the image:
-60.864000 -5.368000

# RAcent  DECcent POSerr Theta    Phi  PeakCts   SNR AngSep     Name
#  [deg]    [deg]    ['] [deg]  [deg]                   [']
 37.6571 -28.0064    2.6  31.6   84.7   1.7794   4.4 ------	UNKNOWN
323.3415 -24.5655    2.0  42.6  -42.5   2.6147   5.7 ------	UNKNOWN
209.3041 -74.2015    3.0  55.0 -145.4   5.4037   3.8 ------	UNKNOWN
311.7520 -32.4721    2.5  44.4  -61.1   5.1089   4.5 ------	UNKNOWN
Pre-slew background subtracted image of 15-350 keV band
Time interval of the image:
-5.368000 14.636600

# RAcent  DECcent POSerr Theta    Phi  PeakCts   SNR AngSep     Name
#  [deg]    [deg]    ['] [deg]  [deg]                   [']
 10.1890   1.6620    3.3  51.7   30.7   2.2033   3.5 ------	UNKNOWN
337.1696 -20.5096    2.4  38.1  -23.0   0.9037   4.8 ------	UNKNOWN
305.6689 -72.4314    0.3  34.8 -124.6   8.6882  34.4 ------	UNKNOWN
Post-slew image of 15-350 keV band
Time interval of the image:
88.836600 481.636600

# RAcent  DECcent POSerr Theta    Phi  PeakCts   SNR AngSep     Name
#  [deg]    [deg]    ['] [deg]  [deg]                   [']
170.4314 -60.4623   13.5  43.6  171.5   1.5040   0.9   10.2	Cen X-3
186.5147 -62.8857    9.9  38.6 -179.0   1.5313   1.2    7.9	GX 301-2
264.8492 -44.5841   21.1  33.8  -95.8   0.8099   0.5    9.2	4U 1735-44
145.5902 -60.0095    3.1  46.8  154.8   9.7704   3.7 ------	UNKNOWN
343.8640 -40.2967    2.7  37.1   12.6   4.7571   4.2 ------	UNKNOWN
175.1518 -58.2136    2.4  45.0  175.8   9.0972   4.9 ------	UNKNOWN
287.9265 -29.1171    2.6  44.4  -61.2  18.1806   4.5 ------	UNKNOWN
Plot creation:
Tue Dec 26 16:58:13 EST 2023