Estimated redshift from machine learning (Ukwatta et al. 2016) - may take a few minute to calcaulte
Image
Pre-slew 15.0-350.0 keV image (Event data)
#   RAcent    DECcent   POSerr    Theta     Phi              Peak Cts       SNR   Name
    9.7298    57.6337   0.0091    57.1930  -174.1937        14.3297439     20.988 TRIG_01202522

Foreground time interval of the image:
 -7.040  21.120 (delta_t =  28.160 [sec])
Background time interval of the image:
-239.824  -7.040 (delta_t = 232.784 [sec])
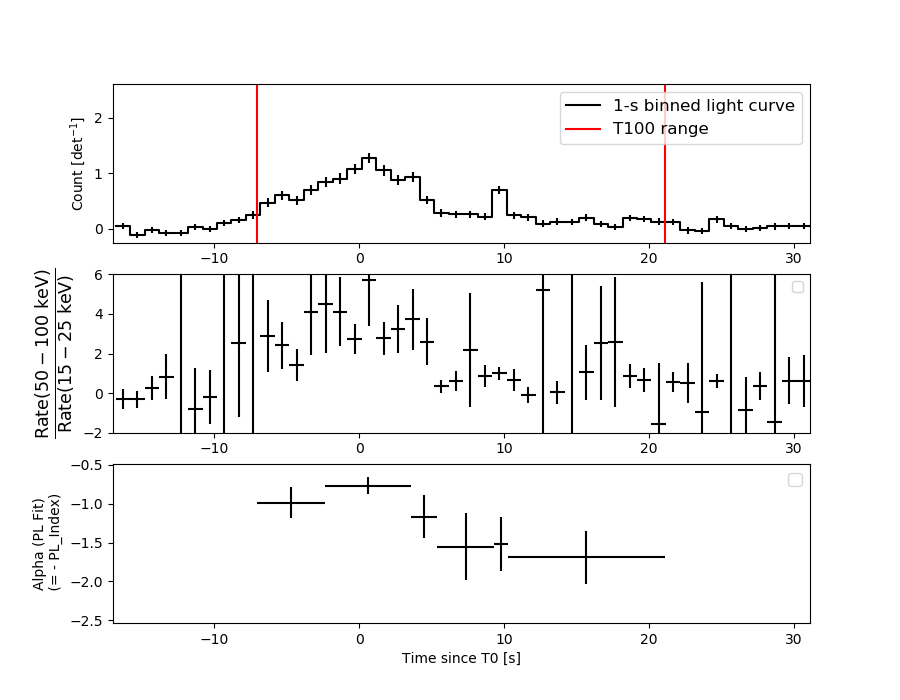
Lightcurves
Notes:
- 1) The mask-weighted light curves are using the flight position.
- 2) Multiple plots of different time binning/intervals are shown to cover all scenarios of short/long GRBs, rate/image triggers, and real/false positives.
- 3) For all the mask-weighted lightcurves, the y-axis units are counts/sec/det where a det is 0.4 x 0.4 = 0.16 sq cm.
- 4) The verticle lines correspond to following: green dotted lines are T50 interval, black dotted lines are T90 interval, blue solid line(s) is a spacecraft slew start time, and orange solid line(s) is a spacecraft slew end time.
- 5) Time of each bin is in the middle of the bin.
1 s binning
From T0-310 s to T0+310 s

From T100_start - 20 s to T100_end + 30 s
Full time interval
64 ms binning
Full time interval
From T100_start to T100_end
From T0-5 sec to T0+5 sec

16 ms binning
From T100_start-5 s to T100_start+5 s

Blue+Cyan dotted lines: Time interval of the scaled map
From 0.000000 to 2.048000
8 ms binning
From T100_start-3 s to T100_start+3 s
Blue+Cyan dotted lines: Time interval of the scaled map
From 0.000000 to 2.048000
2 ms binning
From T100_start-1 s to T100_start+1 s

Blue+Cyan dotted lines: Time interval of the scaled map
From 0.000000 to 2.048000
SN=5 or 10 sec. binning (whichever binning is satisfied first)
SN=5 or 10 sec. binning (T < 200 sec)
Quad-rate summed light curves (from T0-300s to T0+1000s)

Spectral Evolution
Spectra
Notes:
- 1) The fitting includes the systematic errors.
- 2) When the burst includes telescope slew time periods, the fitting uses an average response file made from multiple 5-s response files through out the slew time plus single time preiod for the non-slew times, and weighted by the total counts in the corresponding time period using addrmf. An average response file is needed becuase a spectral fit using the pre-slew DRM will introduce some errors in both a spectral shape and a normalization if the PHA file contains a lot of the slew/post-slew time interval.
- 3) For fits to more complicated models (e.g. a power-law over a cutoff power-law), the BAT team has decided to require a chi-square improvement of more than 6 for each extra dof.
Time averaged spectrum fit using the average DRM
Power-law model

Time interval is from   -7.040 sec. to   21.120 sec.

Spectral model in power-law:
------------------------------------------------------------
Parameters  : value       lower 90%   higher 90%
Photon index: 1.03128     ( -0.0917248   0.0898922 )
Norm@50keV  : 3.44510E-02    ( -0.00187769   0.0018622 )
------------------------------------------------------------
#Fit statistic  : Chi-Squared                   55.81     using 59 bins.
 Reduced chi-squared = 0.979123
# Null hypothesis probability of 5.20e-01 with 57 degrees of freedom

Photon flux (15-150 keV)    in 28.16 sec: 3.97370 ( -0.2258  0.22679 ) ph/cm2/s
Energy fluence (15-150 keV)             : 1.03777e-05 ( -5.24426e-07  5.24666e-07 ) ergs/cm2
Cutoff power-law model

Time interval is from   -7.040 sec. to   21.120 sec.
Spectral model in the cutoff power-law:
------------------------------------------------------------
Parameters  : value       lower 90%   higher 90%
Photon index: 1.02503     ( -0.367008   0.106016 )
Epeak [keV] : 9999.99      ( -9999.99 -9999.99 )
Norm@50keV  : 3.46515E-02    ( -0.00187888   0.00172177 )
------------------------------------------------------------
#Fit statistic  : Chi-Squared                   55.81     using 59 bins.
 Reduced chi-squared = 0.996607
# Null hypothesis probability of 4.82e-01 with 56 degrees of freedom

Photon flux (15-150 keV)    in 28.16 sec: 3.97132 ( -0.23369  0.2282 ) ph/cm2/s
Energy fluence (15-150 keV)             : 1.03818e-05 ( -5.19856e-07  5.12078e-07 ) ergs/cm2
Band function

Time interval is from   -7.040 sec. to   21.120 sec.


Spectral model in the Band function:
------------------------------------------------------------
Parameters  : value       lower 90%   higher 90%
alpha       :    (     )
beta        :     (     )
Epeak [keV] :       (   )
Norm@50keV   :     (     )
------------------------------------------------------------

Photon flux (15-150 keV)    in  sec:  (    ) ph/cm2/s
Energy fluence (15-150 keV)             : 0 ( 0  0 ) ergs/cm2
Single BB

Spectral model blackbody:
------------------------------------------------------------
Parameters  : value    Lower 90%  Upper 90%
kT [keV]    : 24.9465  (  )
R^2/D10^2   : 9.48969E-02  (   )
(R is the radius in km and D10 is the distance to the source in units of 10 kpc)
------------------------------------------------------------
#Fit statistic  : Chi-Squared                  129.69     using 59 bins.
 Reduced chi-squared =
# Null hypothesis probability of 1.38e-07 with 57 degrees of freedom

Energy  Fluence     90% Error
[keV]   [erg/cm2]   [erg/cm2]
15- 25  2.892e-07   3.110e-08
25- 50  1.639e-06   1.488e-07
50-150  7.566e-06   5.294e-07
15-150  9.494e-06   5.688e-07
Thermal bremsstrahlung (OTTB)

Spectral model: thermal bremsstrahlung
------------------------------------------------------------
Parameters  : value         Lower 90%    Upper 90%
kT [keV]    : 199.363       (      )
Norm        : 17.4997       (     )
------------------------------------------------------------
#Fit statistic  : Chi-Squared                  163.40     using 59 bins.
 Reduced chi-squared =
# Null hypothesis probability of 3.31e-12 with 57 degrees of freedom

Energy  Fluence     90% Error
[keV]   [erg/cm2]   [erg/cm2]
15- 25  1.227e-06   7.124e-08
25- 50  2.360e-06   1.433e-07
50-150  5.177e-06   3.520e-07
15-150  8.765e-06   5.350e-07
Double BB
Spectral model: bbodyrad<1> + bbodyrad<2>
------------------------------------------------------------
Parameters  : value         Lower 90%    Upper 90%
kT1 [keV]   : 9.58521        (-2.00402      2.36911)
R1^2/D10^2  : 1.13195        (-0.533201      1.24978)
kT2 [keV]   : 42.1176        (-7.79057      16.6284)
R2^2/D10^2  : 1.62114E-02    (-0.00983631   0.0145557)
------------------------------------------------------------
#Fit statistic  : Chi-Squared                   57.21     using 59 bins.
 Reduced chi-squared =
# Null hypothesis probability of 3.93e-01 with 55 degrees of freedom

Energy  Fluence     90% Error
[keV]   [erg/cm2]   [erg/cm2]
15- 25  6.877e-07   1.721e-07
25- 50  2.070e-06   4.000e-07
50-150  7.718e-06   1.954e-06
15-150  1.048e-05   2.291e-06
Peak spectrum fit
Power-law model
Time interval is from    0.180 sec. to    1.180 sec.

Spectral model in power-law:
------------------------------------------------------------
Parameters  : value       lower 90%   higher 90%
Photon index: 0.919778     ( -0.219477   0.210331 )
Norm@50keV  : 8.63562E-02    ( -0.01208   0.0119194 )
------------------------------------------------------------
#Fit statistic  : Chi-Squared                   66.97     using 59 bins.
 Reduced chi-squared = 1.17491
# Null hypothesis probability of 1.72e-01 with 57 degrees of freedom

Photon flux (15-150 keV)    in 1 sec: 0.102950 (    ) ph/cm2/s
Energy fluence (15-150 keV)             : 9.619e-07 ( -1.2818e-07  1.28284e-07 ) ergs/cm2
Cutoff power-law model
Time interval is from    0.180 sec. to    1.180 sec.
Spectral model in the cutoff power-law:
------------------------------------------------------------
Parameters  : value       lower 90%   higher 90%
Photon index: -0.220065     ( -1.25958   0.9826 )
Epeak [keV] : 124.516      ( -34.5802 320.669 )
Norm@50keV  : 0.244962    ( -0.143571   0.460534 )
------------------------------------------------------------
#Fit statistic  : Chi-Squared                   62.97     using 59 bins.
 Reduced chi-squared = 1.12446
# Null hypothesis probability of 2.43e-01 with 56 degrees of freedom

Photon flux (15-150 keV)    in 1 sec: 2.35713E-02 ( -0.0235713  -0.0235713 ) ph/cm2/s
Energy fluence (15-150 keV)             : 9.54113e-07 ( -1.33591e-07  1.32238e-07 ) ergs/cm2
Band function

Time interval is from    0.180 sec. to    1.180 sec.


Spectral model in the Band function:
------------------------------------------------------------
Parameters  : value       lower 90%   higher 90%
alpha       :    (     )
beta        :     (     )
Epeak [keV] :       (   )
Norm@50keV   :     (     )
------------------------------------------------------------

Photon flux (15-150 keV)    in  sec:  (    ) ph/cm2/s
Energy fluence (15-150 keV)             : 0 ( 0  0 ) ergs/cm2
Single BB

Spectral model blackbody:
------------------------------------------------------------
Parameters  : value    Lower 90%  Upper 90%
kT [keV]    : 24.7798  (-3.51578  4.41618)
R^2/D10^2   : 0.265191  (-0.106902   0.165183)
(R is the radius in km and D10 is the distance to the source in units of 10 kpc)
------------------------------------------------------------
#Fit statistic  : Chi-Squared                   65.30     using 59 bins.
 Reduced chi-squared =
# Null hypothesis probability of 2.11e-01 with 57 degrees of freedom

Energy  Fluence     90% Error
[keV]   [erg/cm2]   [erg/cm2]
15- 25  2.842e-08   7.885e-09
25- 50  1.605e-07   3.595e-08
50-150  7.317e-07   1.499e-07
15-150  9.206e-07   1.696e-07
Thermal bremsstrahlung (OTTB)
Spectral model: thermal bremsstrahlung
------------------------------------------------------------
Parameters  : value         Lower 90%    Upper 90%
kT [keV]    : 200.000       (-24.9424      -200)
Norm        : 41.4686       (-5.81595     5.81595)
------------------------------------------------------------
#Fit statistic  : Chi-Squared                   90.47     using 59 bins.
 Reduced chi-squared =
# Null hypothesis probability of 3.15e-03 with 57 degrees of freedom

Energy  Fluence     90% Error
[keV]   [erg/cm2]   [erg/cm2]
15- 25  1.033e-07   5.780e-08
25- 50  1.987e-07   1.128e-07
50-150  4.358e-07   2.425e-07
15-150  7.378e-07   4.135e-07
Double BB
Spectral model: bbodyrad<1> + bbodyrad<2>
------------------------------------------------------------
Parameters  : value         Lower 90%    Upper 90%
kT1 [keV]   : 10.1302        (-10.1557      -10.1557)
R1^2/D10^2  : 1.30184        (-1.29764      -1.29764)
kT2 [keV]   : 30.6070        (-7.57052      -30.6235)
R2^2/D10^2  : 0.118771    (-0.118503   0.201726)
------------------------------------------------------------
#Fit statistic  : Chi-Squared                   62.77     using 59 bins.
 Reduced chi-squared =
# Null hypothesis probability of 2.20e-01 with 55 degrees of freedom

Energy  Fluence     90% Error
[keV]   [erg/cm2]   [erg/cm2]
15- 25  4.452e-08   2.527e-08
25- 50  1.761e-07   9.370e-08
50-150  7.393e-07   3.962e-07
15-150  9.599e-07   4.878e-07
Pre-slew spectrum (Pre-slew PHA with pre-slew DRM)
Power-law model
Spectral model in power-law:
------------------------------------------------------------
Parameters  : value       lower 90%   higher 90%
Photon index: 1.03128     ( -0.0917248   0.0898922 )
Norm@50keV  : 3.44510E-02    ( -0.00187769   0.0018622 )
------------------------------------------------------------
#Fit statistic  : Chi-Squared                   55.81     using 59 bins.
 Reduced chi-squared =
# Null hypothesis probability of 5.20e-01 with 57 degrees of freedom

Photon flux (15-150 keV)    in 28.16 sec: 3.97363 ( -0.225744  0.226832 ) ph/cm2/s
Energy fluence (15-150 keV)             : 1.03767e-05 ( -5.24559e-07  5.24598e-07 ) ergs/cm2
Cutoff power-law model

Spectral model in the cutoff power-law:
------------------------------------------------------------
Parameters  : value       lower 90%   higher 90%
Photon index: 1.02472     ( -0.366661   0.0908835 )
Epeak [keV] : 9809.35      ( -9690.91 -9690.91 )
Norm@50keV  : 3.46524E-02    ( -0.00177866   0.0134864 )
------------------------------------------------------------
#Fit statistic  : Chi-Squared                   55.81     using 59 bins.
 Reduced chi-squared =
# Null hypothesis probability of 4.82e-01 with 56 degrees of freedom

Photon flux (15-150 keV)    in 28.16 sec: 3.96808 ( -0.23063  0.22998 ) ph/cm2/s
Energy fluence (15-150 keV)             : 1.03864e-05 ( -5.16145e-07  5.19355e-07 ) ergs/cm2
Band function
Spectral model in the Band function:
------------------------------------------------------------
Parameters  : value       lower 90%   higher 90%
alpha       :    (     )
beta        :     (     )
Epeak [keV] :       (   )
Norm@50keV   :     (     )
------------------------------------------------------------

Photon flux (15-150 keV)    in  sec:  (    ) ph/cm2/s
Energy fluence (15-150 keV)             : 0 ( 0  0 ) ergs/cm2
S(25-50 keV) vs. S(50-100 keV) plot
S(25-50 keV)  = 1.96e-06
S(50-100 keV) = 3.83e-06
T90 vs. Hardness ratio plot
T90                                   = 22.0960000753403 sec.
Hardness ratio (energy fluence ratio) = 1.95408
Color vs. Color plot
Count Ratio  (25-50 keV) / (15-25 keV) = 1.86124
Count Ratio (50-100 keV) / (15-25 keV) = 2.32832
Mask shadow pattern

IMX = -1.543322842016900E+00, IMY = 1.569353617951765E-01
TIME vs. PHA plot around the trigger time
Blue+Cyan dotted lines: Time interval of the scaled map
From 0.000000 to 2.048000
TIME vs. DetID plot around the trigger time
Blue+Cyan dotted lines: Time interval of the scaled map
From 0.000000 to 2.048000
100 us light curve (15-350 keV)
Blue+Cyan dotted lines: Time interval of the scaled map
From 0.000000 to 2.048000
Spacecraft aspect plot
Bright source in the pre-burst/pre-slew/post-slew images
Pre-burst image of 15-350 keV band
Time interval of the image:
-239.824000 -7.040000

# RAcent  DECcent POSerr Theta    Phi  PeakCts   SNR AngSep     Name
#  [deg]    [deg]    ['] [deg]  [deg]                   [']
 98.9896  26.0216    2.1  31.6   84.7   3.6983   5.5 ------	UNKNOWN
 44.9802  72.5856    2.0  37.4 -166.9   2.7386   5.7 ------	UNKNOWN
187.7312  41.3832    2.8  44.4  -61.2   6.9021   4.1 ------	UNKNOWN
Pre-slew background subtracted image of 15-350 keV band
Time interval of the image:
-7.040000 21.120000

# RAcent  DECcent POSerr Theta    Phi  PeakCts   SNR AngSep     Name
#  [deg]    [deg]    ['] [deg]  [deg]                   [']
 88.8185  21.5761    3.4  40.1   94.8   1.2125   3.4 ------	UNKNOWN
 78.1280  45.9002    2.1  29.2  137.1   0.6467   5.4 ------	UNKNOWN
  9.7298  57.6337    0.6  57.2 -174.2  14.3340  20.8 ------	UNKNOWN
  9.3605  76.8847    2.9  44.3 -155.6   0.6977   4.0 ------	UNKNOWN
173.4315  55.1581    3.7  29.7  -74.4   0.4385   3.1 ------	UNKNOWN
Post-slew image of 15-350 keV band
Time interval of the image:
217.476590 664.076600

# RAcent  DECcent POSerr Theta    Phi  PeakCts   SNR AngSep     Name
#  [deg]    [deg]    ['] [deg]  [deg]                   [']
170.3945 -60.5898    4.2  54.3   -8.0   3.3557   2.7    3.1	Cen X-3
186.7995 -62.7886    9.8  52.4  -17.8   1.8559   1.2    4.1	GX 301-2
244.9889 -15.6126    1.1  41.8 -106.0  32.9606  10.3    1.7	Sco X-1
171.0281  -2.6884    4.3  32.1   77.1   2.9885   2.7 ------	UNKNOWN
163.5477 -25.7401    2.9  39.0   36.6   4.2599   4.0 ------	UNKNOWN
226.0558  17.4344    1.8  37.4 -167.0   5.2388   6.4 ------	UNKNOWN
Plot creation:
Tue Dec 26 16:57:39 EST 2023