Estimated redshift from machine learning (Ukwatta et al. 2016) - may take a few minute to calcaulte
Image
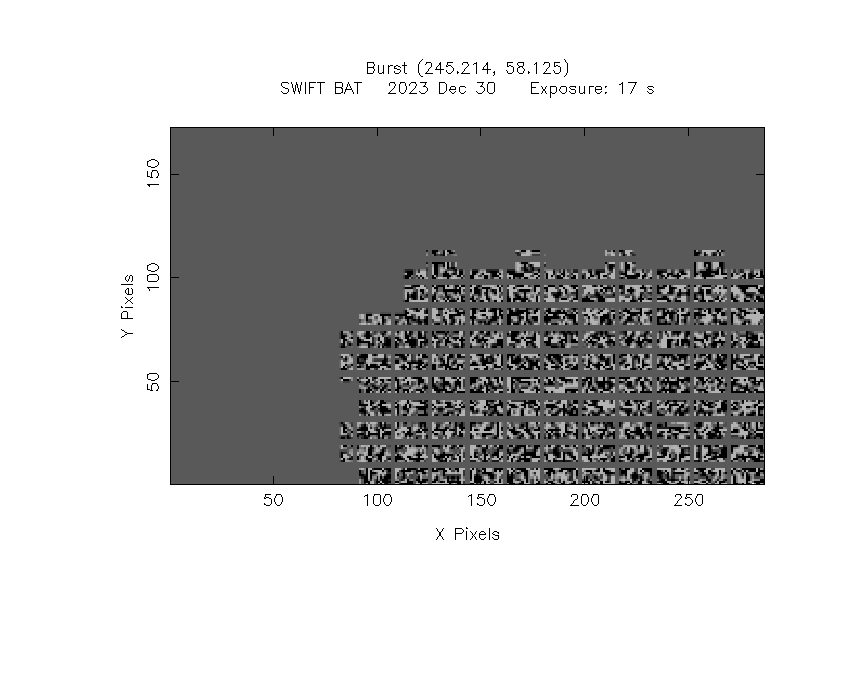
Pre-slew 15.0-350.0 keV image (Event data)

#   RAcent    DECcent   POSerr    Theta     Phi              Peak Cts       SNR   Name
  245.2222    58.1319   0.0074    45.7784  -152.6068         3.0612679     25.669 TRIG_01205319

Foreground time interval of the image:
  0.252  17.264 (delta_t =  17.012 [sec])
Background time interval of the image:
-239.376   0.252 (delta_t = 239.628 [sec])
Lightcurves
Notes:
- 1) The mask-weighted light curves are using the flight position.
- 2) Multiple plots of different time binning/intervals are shown to cover all scenarios of short/long GRBs, rate/image triggers, and real/false positives.
- 3) For all the mask-weighted lightcurves, the y-axis units are counts/sec/det where a det is 0.4 x 0.4 = 0.16 sq cm.
- 4) The verticle lines correspond to following: green dotted lines are T50 interval, black dotted lines are T90 interval, blue solid line(s) is a spacecraft slew start time, and orange solid line(s) is a spacecraft slew end time.
- 5) Time of each bin is in the middle of the bin.
1 s binning
From T0-310 s to T0+310 s

From T100_start - 20 s to T100_end + 30 s

Full time interval

64 ms binning
Full time interval

From T100_start to T100_end

From T0-5 sec to T0+5 sec

16 ms binning
From T100_start-5 s to T100_start+5 s

Blue+Cyan dotted lines: Time interval of the scaled map
From 0.000000 to 3.072000
8 ms binning
From T100_start-3 s to T100_start+3 s

Blue+Cyan dotted lines: Time interval of the scaled map
From 0.000000 to 3.072000
2 ms binning
From T100_start-1 s to T100_start+1 s

Blue+Cyan dotted lines: Time interval of the scaled map
From 0.000000 to 3.072000
SN=5 or 10 sec. binning (whichever binning is satisfied first)

SN=5 or 10 sec. binning (T < 200 sec)

Quad-rate summed light curves (from T0-300s to T0+1000s)

Spectral Evolution

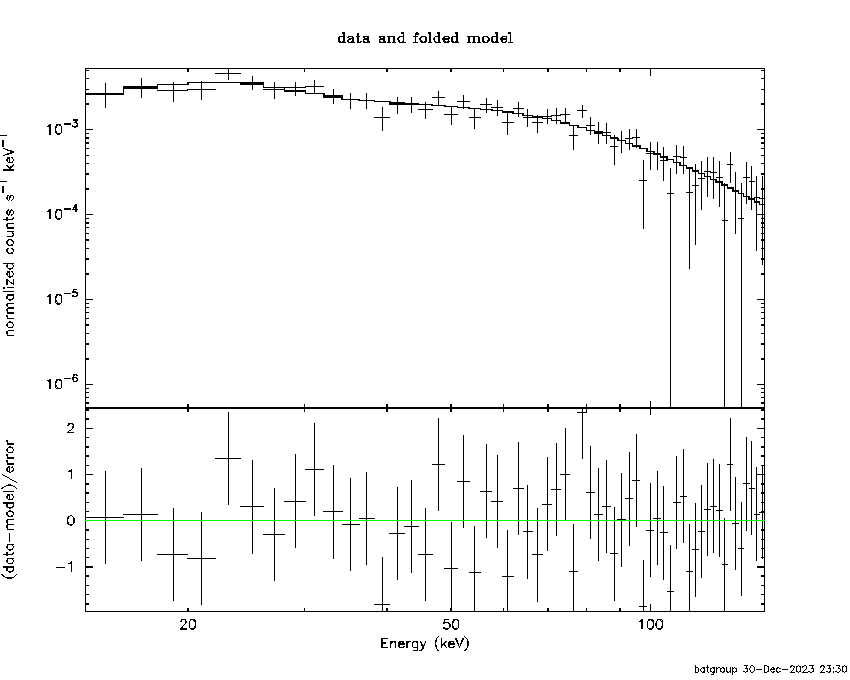
Spectra
Notes:
- 1) The fitting includes the systematic errors.
- 2) When the burst includes telescope slew time periods, the fitting uses an average response file made from multiple 5-s response files through out the slew time plus single time preiod for the non-slew times, and weighted by the total counts in the corresponding time period using addrmf. An average response file is needed becuase a spectral fit using the pre-slew DRM will introduce some errors in both a spectral shape and a normalization if the PHA file contains a lot of the slew/post-slew time interval.
- 3) For fits to more complicated models (e.g. a power-law over a cutoff power-law), the BAT team has decided to require a chi-square improvement of more than 6 for each extra dof.
Time averaged spectrum fit using the average DRM
Power-law model
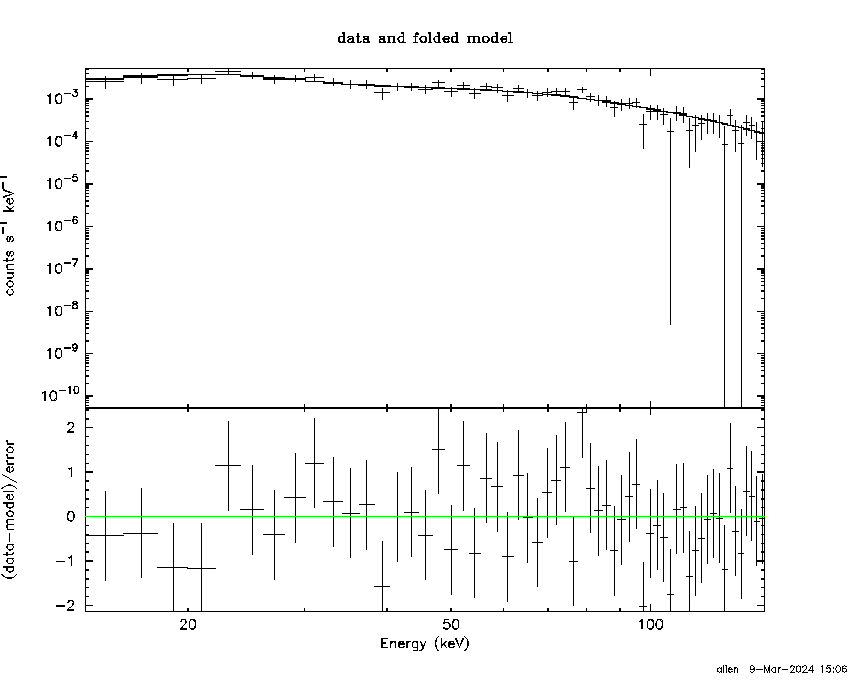
Time interval is from    0.252 sec. to   17.264 sec.

Spectral model in power-law:
------------------------------------------------------------
Parameters  : value       lower 90%   higher 90%
Photon index: 1.27724     ( -0.0955486   0.0945992 )
Norm@50keV  : 1.26752E-02    ( -0.000704192   0.00070336 )
------------------------------------------------------------
#Fit statistic  : Chi-Squared                   41.72     using 59 bins.
 Reduced chi-squared = 0.73193
# Null hypothesis probability of 9.36e-01 with 57 degrees of freedom

Photon flux (15-150 keV)    in 17.01 sec: 1.50604 ( -0.08971  0.08997 ) ph/cm2/s
Energy fluence (15-150 keV)             : 2.14292e-06 ( -1.24069e-07  1.24304e-07 ) ergs/cm2
Cutoff power-law model
Time interval is from    0.252 sec. to   17.264 sec.
Spectral model in the cutoff power-law:
------------------------------------------------------------
Parameters  : value       lower 90%   higher 90%
Photon index: 0.888209     ( -0.416189   0.378134 )
Epeak [keV] : 162.298      ( -55.8615 1805.85 )
Norm@50keV  : 1.90098E-02    ( -0.00598626   0.00985355 )
------------------------------------------------------------
#Fit statistic  : Chi-Squared                   38.67     using 59 bins.
 Reduced chi-squared = 0.690536
# Null hypothesis probability of 9.63e-01 with 56 degrees of freedom

Photon flux (15-150 keV)    in 17.01 sec: 1.47977 ( -0.09323  0.09348 ) ph/cm2/s
Energy fluence (15-150 keV)             : 2.11035e-06 ( -1.29757e-07  1.29223e-07 ) ergs/cm2
Band function

Time interval is from    0.252 sec. to   17.264 sec.


Spectral model in the Band function:
------------------------------------------------------------
Parameters  : value       lower 90%   higher 90%
alpha       :    (     )
beta        :     (     )
Epeak [keV] :       (   )
Norm@50keV   :     (     )
------------------------------------------------------------

Photon flux (15-150 keV)    in  sec:  (    ) ph/cm2/s
Energy fluence (15-150 keV)             : 0 ( 0  0 ) ergs/cm2
Single BB

Spectral model blackbody:
------------------------------------------------------------
Parameters  : value    Lower 90%  Upper 90%
kT [keV]    : 19.3627  (-1.30501  1.43828)
R^2/D10^2   : 7.60639E-02  (-0.0165745   0.0206405)
(R is the radius in km and D10 is the distance to the source in units of 10 kpc)
------------------------------------------------------------
#Fit statistic  : Chi-Squared                   93.31     using 59 bins.
 Reduced chi-squared =
# Null hypothesis probability of 1.72e-03 with 57 degrees of freedom

Energy  Fluence     90% Error
[keV]   [erg/cm2]   [erg/cm2]
15- 25  9.469e-08   1.106e-08
25- 50  4.614e-07   3.751e-08
50-150  1.276e-06   1.158e-07
15-150  1.832e-06   1.305e-07
Thermal bremsstrahlung (OTTB)

Spectral model: thermal bremsstrahlung
------------------------------------------------------------
Parameters  : value         Lower 90%    Upper 90%
kT [keV]    : 200.000       (-10.4946      -200)
Norm        : 6.40628       (-0.358365     0.358365)
------------------------------------------------------------
#Fit statistic  : Chi-Squared                   65.75     using 59 bins.
 Reduced chi-squared =
# Null hypothesis probability of 2.00e-01 with 57 degrees of freedom

Energy  Fluence     90% Error
[keV]   [erg/cm2]   [erg/cm2]
15- 25  2.714e-07   1.786e-08
25- 50  5.222e-07   3.393e-08
50-150  1.145e-06   1.001e-07
15-150  1.939e-06   2.532e-07
Double BB

Spectral model: bbodyrad<1> + bbodyrad<2>
------------------------------------------------------------
Parameters  : value         Lower 90%    Upper 90%
kT1 [keV]   : 7.27094        (-1.53428      2.00285)
R1^2/D10^2  : 1.07111        (-0.572396      1.39144)
kT2 [keV]   : 27.8100        (-3.77393      6.42563)
R2^2/D10^2  : 1.91224E-02    (-0.00996478   0.0133182)
------------------------------------------------------------
#Fit statistic  : Chi-Squared                   38.74     using 59 bins.
 Reduced chi-squared =
# Null hypothesis probability of 9.53e-01 with 55 degrees of freedom

Energy  Fluence     90% Error
[keV]   [erg/cm2]   [erg/cm2]
15- 25  2.019e-07   5.992e-08
25- 50  4.825e-07   9.662e-08
50-150  1.423e-06   2.503e-07
15-150  2.108e-06   3.736e-07
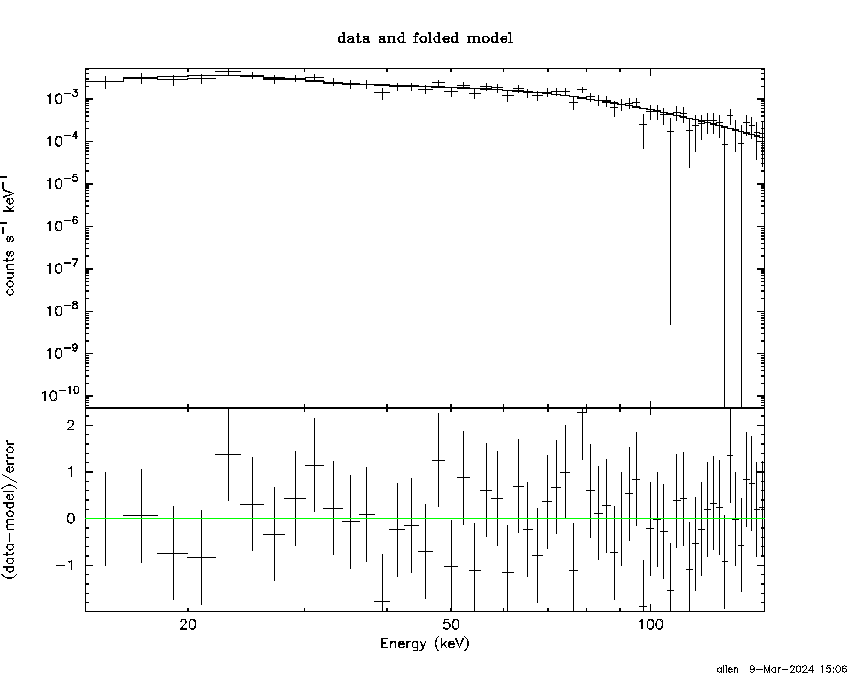
Peak spectrum fit
Power-law model
Time interval is from    7.636 sec. to    8.636 sec.

Spectral model in power-law:
------------------------------------------------------------
Parameters  : value       lower 90%   higher 90%
Photon index: 1.25692     ( -0.248183   0.240893 )
Norm@50keV  : 1.89766E-02    ( -0.00290896   0.00290174 )
------------------------------------------------------------
#Fit statistic  : Chi-Squared                   47.21     using 59 bins.
 Reduced chi-squared = 0.828246
# Null hypothesis probability of 8.19e-01 with 57 degrees of freedom

Photon flux (15-150 keV)    in 1 sec: 2.24699 ( -0.36542  0.36753 ) ph/cm2/s
Energy fluence (15-150 keV)             : 1.89596e-07 ( -2.98574e-08  2.99118e-08 ) ergs/cm2
Cutoff power-law model

Time interval is from    7.636 sec. to    8.636 sec.
Spectral model in the cutoff power-law:
------------------------------------------------------------
Parameters  : value       lower 90%   higher 90%
Photon index: 0.348376     ( -1.47532   1.00171 )
Epeak [keV] : 102.234      ( -102.234 -102.234 )
Norm@50keV  : 4.95795E-02    ( -0.0495796   0.175344 )
------------------------------------------------------------
#Fit statistic  : Chi-Squared                   45.22     using 59 bins.
 Reduced chi-squared = 0.8075
# Null hypothesis probability of 8.48e-01 with 56 degrees of freedom

Photon flux (15-150 keV)    in 1 sec: 2.18744 ( -0.37376  0.37569 ) ph/cm2/s
Energy fluence (15-150 keV)             : 1.8482e-07 ( -3.17077e-08  3.11234e-08 ) ergs/cm2
Band function

Time interval is from    7.636 sec. to    8.636 sec.


Spectral model in the Band function:
------------------------------------------------------------
Parameters  : value       lower 90%   higher 90%
alpha       :    (     )
beta        :     (     )
Epeak [keV] :       (   )
Norm@50keV   :     (     )
------------------------------------------------------------

Photon flux (15-150 keV)    in  sec:  (    ) ph/cm2/s
Energy fluence (15-150 keV)             : 0 ( 0  0 ) ergs/cm2
Single BB

Spectral model blackbody:
------------------------------------------------------------
Parameters  : value    Lower 90%  Upper 90%
kT [keV]    : 18.3899  (-2.82776  3.71664)
R^2/D10^2   : 0.142233  (-0.0678083   0.113053)
(R is the radius in km and D10 is the distance to the source in units of 10 kpc)
------------------------------------------------------------
#Fit statistic  : Chi-Squared                   49.12     using 59 bins.
 Reduced chi-squared =
# Null hypothesis probability of 7.62e-01 with 57 degrees of freedom

Energy  Fluence     90% Error
[keV]   [erg/cm2]   [erg/cm2]
15- 25  9.563e-09   2.996e-09
25- 50  4.493e-08   1.312e-08
50-150  1.109e-07   3.270e-08
15-150  1.654e-07   3.600e-08
Thermal bremsstrahlung (OTTB)

Spectral model: thermal bremsstrahlung
------------------------------------------------------------
Parameters  : value         Lower 90%    Upper 90%
kT [keV]    : 200.000       (-48.5353      -200)
Norm        : 9.61447       (-1.48231     1.48231)
------------------------------------------------------------
#Fit statistic  : Chi-Squared                   50.77     using 59 bins.
 Reduced chi-squared =
# Null hypothesis probability of 7.06e-01 with 57 degrees of freedom

Energy  Fluence     90% Error
[keV]   [erg/cm2]   [erg/cm2]
15- 25  2.395e-08   1.346e-08
25- 50  4.608e-08   2.581e-08
50-150  1.011e-07   5.685e-08
15-150  1.711e-07   9.625e-08
Double BB

Spectral model: bbodyrad<1> + bbodyrad<2>
------------------------------------------------------------
Parameters  : value         Lower 90%    Upper 90%
kT1 [keV]   : 13.2253        (-6.94041      5.16096)
R1^2/D10^2  : 0.321848        (-0.190118      3.81167)
kT2 [keV]   : 50.7079        (-54.6852      -54.6853)
R2^2/D10^2  : 3.06108E-03    (-0.00206643   0.120572)
------------------------------------------------------------
#Fit statistic  : Chi-Squared                   44.58     using 59 bins.
 Reduced chi-squared =
# Null hypothesis probability of 8.41e-01 with 55 degrees of freedom

Energy  Fluence     90% Error
[keV]   [erg/cm2]   [erg/cm2]
15- 25  1.464e-08   4.673e-09
25- 50  4.196e-08   1.263e-08
50-150  1.144e-07   3.526e-08
15-150  1.710e-07   3.925e-08
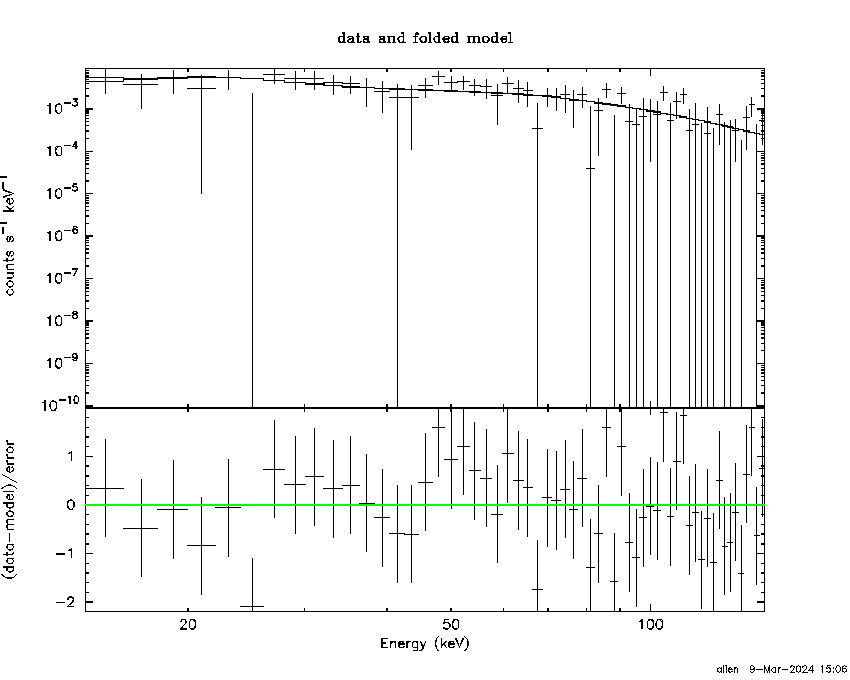
Pre-slew spectrum (Pre-slew PHA with pre-slew DRM)
Power-law model

Spectral model in power-law:
------------------------------------------------------------
Parameters  : value       lower 90%   higher 90%
Photon index: 1.27724     ( -0.0955486   0.0945992 )
Norm@50keV  : 1.26752E-02    ( -0.000704192   0.00070336 )
------------------------------------------------------------
#Fit statistic  : Chi-Squared                   41.72     using 59 bins.
 Reduced chi-squared =
# Null hypothesis probability of 9.36e-01 with 57 degrees of freedom

Photon flux (15-150 keV)    in 17.01 sec: 1.50603 ( -0.0897092  0.0899576 ) ph/cm2/s
Energy fluence (15-150 keV)             : 2.14265e-06 ( -1.24134e-07  1.24323e-07 ) ergs/cm2
Cutoff power-law model

Spectral model in the cutoff power-law:
------------------------------------------------------------
Parameters  : value       lower 90%   higher 90%
Photon index: 0.888210     ( -0.41619   0.378133 )
Epeak [keV] : 162.298      ( -55.8616 1804.93 )
Norm@50keV  : 1.90098E-02    ( -0.00598625   0.00985356 )
------------------------------------------------------------
#Fit statistic  : Chi-Squared                   38.67     using 59 bins.
 Reduced chi-squared =
# Null hypothesis probability of 9.63e-01 with 56 degrees of freedom

Photon flux (15-150 keV)    in 17.01 sec: 1.47966 ( -0.0932  0.09345 ) ph/cm2/s
Energy fluence (15-150 keV)             : 2.11125e-06 ( -1.29922e-07  1.2931e-07 ) ergs/cm2
Band function
Spectral model in the Band function:
------------------------------------------------------------
Parameters  : value       lower 90%   higher 90%
alpha       :    (     )
beta        :     (     )
Epeak [keV] :       (   )
Norm@50keV   :     (     )
------------------------------------------------------------

Photon flux (15-150 keV)    in  sec:  (    ) ph/cm2/s
Energy fluence (15-150 keV)             : 0 ( 0  0 ) ergs/cm2
S(25-50 keV) vs. S(50-100 keV) plot

S(25-50 keV)  = 4.71e-07
S(50-100 keV) = 7.77e-07
T90 vs. Hardness ratio plot

T90                                   = 15.2400000095367 sec.
Hardness ratio (energy fluence ratio) = 1.64968
Color vs. Color plot

Count Ratio  (25-50 keV) / (15-25 keV) = 1.78274
Count Ratio (50-100 keV) / (15-25 keV) = 1.86239
Mask shadow pattern
IMX = -9.123296062587759E-01, IMY = 4.727695310907867E-01
TIME vs. PHA plot around the trigger time

Blue+Cyan dotted lines: Time interval of the scaled map
From 0.000000 to 3.072000
TIME vs. DetID plot around the trigger time

Blue+Cyan dotted lines: Time interval of the scaled map
From 0.000000 to 3.072000
100 us light curve (15-350 keV)

Blue+Cyan dotted lines: Time interval of the scaled map
From 0.000000 to 3.072000
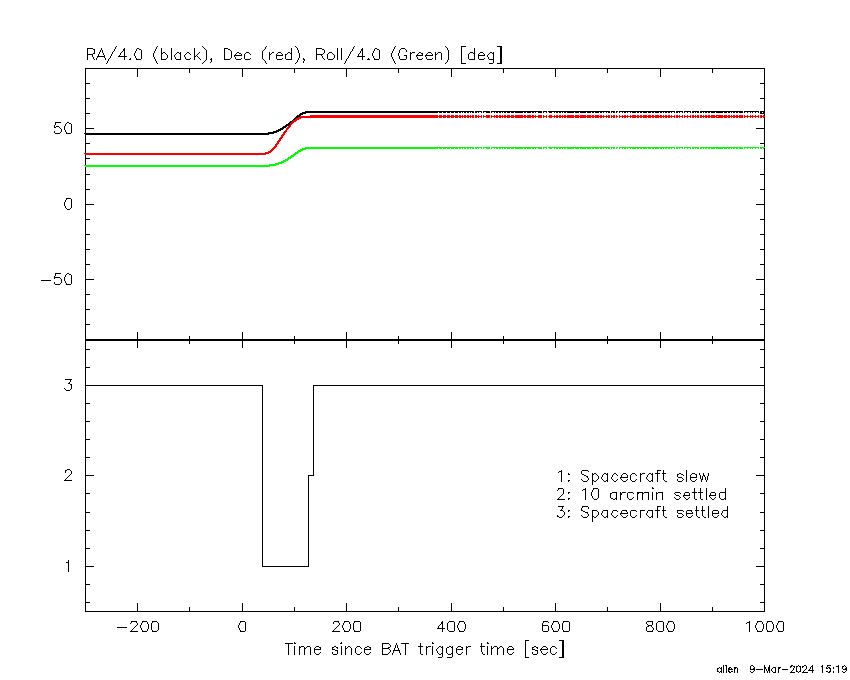
Spacecraft aspect plot
Bright source in the pre-burst/pre-slew/post-slew images
Pre-burst image of 15-350 keV band
Time interval of the image:
-239.376000 0.252000

# RAcent  DECcent POSerr Theta    Phi  PeakCts   SNR AngSep     Name
#  [deg]    [deg]    ['] [deg]  [deg]                   [']
149.6276  27.4243    3.1  32.2   77.4   2.9041   3.8 ------	UNKNOWN
185.7151  12.0491    2.8  21.5   -9.6   1.5196   4.1 ------	UNKNOWN
Pre-slew background subtracted image of 15-350 keV band
Time interval of the image:
0.252000 17.264000

# RAcent  DECcent POSerr Theta    Phi  PeakCts   SNR AngSep     Name
#  [deg]    [deg]    ['] [deg]  [deg]                   [']
126.6530  72.5296    2.4  49.3  148.3   1.1498   4.9 ------	UNKNOWN
245.2222  58.1319    0.4  45.8 -152.6   3.0611  25.6 ------	UNKNOWN
Post-slew image of 15-350 keV band
Time interval of the image:
126.124610 962.695700

# RAcent  DECcent POSerr Theta    Phi  PeakCts   SNR AngSep     Name
#  [deg]    [deg]    ['] [deg]  [deg]                   [']
254.4576  35.3424  108.5  23.6  -78.4   0.1406   0.1    0.0	Her X-1
299.5716  35.2236    1.4  42.2 -140.7  17.2011   8.5    1.6	Cyg X-1
308.1447  41.0549    3.1  42.4 -153.9   7.1467   3.8    6.3	Cyg X-3
326.2854  38.2895    4.8  53.9 -165.3  -7.9303  -2.4    5.7	Cyg X-2
172.9260  67.3621    3.0  32.2   77.5   9.6128   3.9 ------	UNKNOWN
293.4868  85.8685    2.1  29.3  127.2   9.0592   5.4 ------	UNKNOWN
240.0722  70.9455    2.4  13.0  113.6   5.5726   4.8 ------	UNKNOWN
203.8846  24.4512    2.4  44.5   -0.3  10.0829   4.9 ------	UNKNOWN
Plot creation:
Sat Mar  9 15:19:49 EST 2024