Estimated redshift from machine learning (Ukwatta et al. 2016) - may take a few minute to calcaulte
Image
Pre-slew 15.0-350.0 keV image (Event data)

#   RAcent    DECcent   POSerr    Theta     Phi              Peak Cts       SNR   Name
  352.0924    51.6206   0.0215     2.9025   -74.2657         1.5119953      8.958 TRIG_01205744

Foreground time interval of the image:
-54.584  73.069 (delta_t = 127.653 [sec])
Background time interval of the image:
-239.032 -54.584 (delta_t = 184.448 [sec])
Lightcurves
Notes:
- 1) The mask-weighted light curves are using the flight position.
- 2) Multiple plots of different time binning/intervals are shown to cover all scenarios of short/long GRBs, rate/image triggers, and real/false positives.
- 3) For all the mask-weighted lightcurves, the y-axis units are counts/sec/det where a det is 0.4 x 0.4 = 0.16 sq cm.
- 4) The verticle lines correspond to following: green dotted lines are T50 interval, black dotted lines are T90 interval, blue solid line(s) is a spacecraft slew start time, and orange solid line(s) is a spacecraft slew end time.
- 5) Time of each bin is in the middle of the bin.
1 s binning
From T0-310 s to T0+310 s

From T100_start - 20 s to T100_end + 30 s
Full time interval

64 ms binning
Full time interval
From T100_start to T100_end
From T0-5 sec to T0+5 sec

16 ms binning
From T100_start-5 s to T100_start+5 s
Blue+Cyan dotted lines: Time interval of the scaled map
From 0.000000 to 16.384000
8 ms binning
From T100_start-3 s to T100_start+3 s
Blue+Cyan dotted lines: Time interval of the scaled map
From 0.000000 to 16.384000
2 ms binning
From T100_start-1 s to T100_start+1 s

Blue+Cyan dotted lines: Time interval of the scaled map
From 0.000000 to 16.384000
SN=5 or 10 sec. binning (whichever binning is satisfied first)
SN=5 or 10 sec. binning (T < 200 sec)

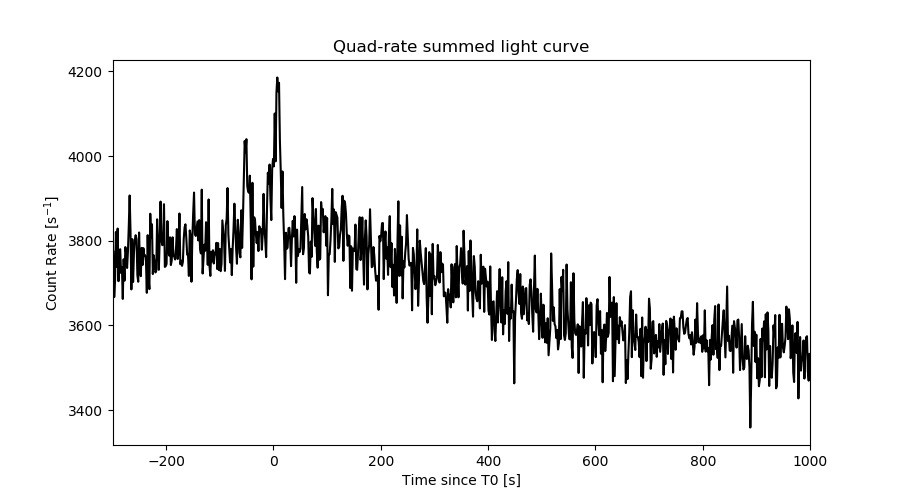
Quad-rate summed light curves (from T0-300s to T0+1000s)
Spectral Evolution

Spectra
Notes:
- 1) The fitting includes the systematic errors.
- 2) When the burst includes telescope slew time periods, the fitting uses an average response file made from multiple 5-s response files through out the slew time plus single time preiod for the non-slew times, and weighted by the total counts in the corresponding time period using addrmf. An average response file is needed becuase a spectral fit using the pre-slew DRM will introduce some errors in both a spectral shape and a normalization if the PHA file contains a lot of the slew/post-slew time interval.
- 3) For fits to more complicated models (e.g. a power-law over a cutoff power-law), the BAT team has decided to require a chi-square improvement of more than 6 for each extra dof.
Time averaged spectrum fit using the average DRM
Power-law model

Time interval is from  -54.584 sec. to  107.528 sec.

Spectral model in power-law:
------------------------------------------------------------
Parameters  : value       lower 90%   higher 90%
Photon index: 1.56026     ( -0.266988   0.275619 )
Norm@50keV  : 5.56837E-04    ( -9.40919e-05   9.24274e-05 )
------------------------------------------------------------
#Fit statistic  : Chi-Squared                   57.53     using 59 bins.
 Reduced chi-squared = 1.0093
# Null hypothesis probability of 4.56e-01 with 57 degrees of freedom

Photon flux (15-150 keV)    in 162.1 sec: 7.07055E-02 ( -0.011023  0.0110286 ) ph/cm2/s
Energy fluence (15-150 keV)             : 8.48639e-07 ( -1.54425e-07  1.57859e-07 ) ergs/cm2
Cutoff power-law model

Time interval is from  -54.584 sec. to  107.528 sec.
Spectral model in the cutoff power-law:
------------------------------------------------------------
Parameters  : value       lower 90%   higher 90%
Photon index: 0.885980     ( -1.43802   0.876441 )
Epeak [keV] : 77.8317      ( -30.8904 -77.8303 )
Norm@50keV  : 1.26955E-03    ( -0.000784587   0.00589663 )
------------------------------------------------------------
#Fit statistic  : Chi-Squared                   56.45     using 59 bins.
 Reduced chi-squared = 1.00804
# Null hypothesis probability of 4.58e-01 with 56 degrees of freedom

Photon flux (15-150 keV)    in 162.1 sec: 6.88549E-02 ( -0.0115095  0.0114482 ) ph/cm2/s
Energy fluence (15-150 keV)             : 7.99951e-07 ( -1.68597e-07  1.75831e-07 ) ergs/cm2
Band function

Time interval is from  -54.584 sec. to  107.528 sec.


Spectral model in the Band function:
------------------------------------------------------------
Parameters  : value       lower 90%   higher 90%
alpha       :    (     )
beta        :     (     )
Epeak [keV] :       (   )
Norm@50keV   :     (     )
------------------------------------------------------------

Photon flux (15-150 keV)    in  sec:  (    ) ph/cm2/s
Energy fluence (15-150 keV)             : 0 ( 0  0 ) ergs/cm2
Single BB
Spectral model blackbody:
------------------------------------------------------------
Parameters  : value    Lower 90%  Upper 90%
kT [keV]    : 13.6826  (-2.28198  2.85898)
R^2/D10^2   : 1.11684E-02  (-0.00550241   0.0101972)
(R is the radius in km and D10 is the distance to the source in units of 10 kpc)
------------------------------------------------------------
#Fit statistic  : Chi-Squared                   62.33     using 59 bins.
 Reduced chi-squared =
# Null hypothesis probability of 2.92e-01 with 57 degrees of freedom

Energy  Fluence     90% Error
[keV]   [erg/cm2]   [erg/cm2]
15- 25  7.173e-08   2.246e-08
25- 50  2.607e-07   6.144e-08
50-150  3.175e-07   1.050e-07
15-150  6.499e-07   1.423e-07
Thermal bremsstrahlung (OTTB)

Spectral model: thermal bremsstrahlung
------------------------------------------------------------
Parameters  : value         Lower 90%    Upper 90%
kT [keV]    : 180.279       (-92.2394      -180.371)
Norm        : 0.290316       (-0.0459096     0.0537894)
------------------------------------------------------------
#Fit statistic  : Chi-Squared                   56.75     using 59 bins.
 Reduced chi-squared =
# Null hypothesis probability of 4.84e-01 with 57 degrees of freedom

Energy  Fluence     90% Error
[keV]   [erg/cm2]   [erg/cm2]
15- 25  1.187e-07   6.838e-08
25- 50  2.255e-07   1.236e-07
50-150  4.777e-07   2.718e-07
15-150  8.218e-07   4.592e-07
Double BB

Spectral model: bbodyrad<1> + bbodyrad<2>
------------------------------------------------------------
Parameters  : value         Lower 90%    Upper 90%
kT1 [keV]   : 3.77394        (-2.68188      71.1156)
R1^2/D10^2  : 0.617221        (-0.603908      1966.46)
kT2 [keV]   : 16.7151        (-3.79373      58.3214)
R2^2/D10^2  : 4.97153E-03    (-0.00494066   0.0048232)
------------------------------------------------------------
#Fit statistic  : Chi-Squared                   56.54     using 59 bins.
 Reduced chi-squared =
# Null hypothesis probability of 4.17e-01 with 55 degrees of freedom

Energy  Fluence     90% Error
[keV]   [erg/cm2]   [erg/cm2]
15- 25  1.142e-07   5.705e-08
25- 50  2.218e-07   1.082e-07
50-150  3.990e-07   2.381e-07
15-150  7.351e-07   3.493e-07
Peak spectrum fit
Power-law model

Time interval is from   10.292 sec. to   11.292 sec.

Spectral model in power-law:
------------------------------------------------------------
Parameters  : value       lower 90%   higher 90%
Photon index: 1.67362     ( -0.540827   0.598564 )
Norm@50keV  : 3.63079E-03    ( -0.00128986   0.00121586 )
------------------------------------------------------------
#Fit statistic  : Chi-Squared                   63.07     using 59 bins.
 Reduced chi-squared = 1.10649
# Null hypothesis probability of 2.70e-01 with 57 degrees of freedom

Photon flux (15-150 keV)    in 1 sec: 0.477869 ( -0.14495  0.145051 ) ph/cm2/s
Energy fluence (15-150 keV)             : 3.36969e-08 ( -1.19974e-08  1.25849e-08 ) ergs/cm2
Cutoff power-law model
Time interval is from   10.292 sec. to   11.292 sec.
Spectral model in the cutoff power-law:
------------------------------------------------------------
Parameters  : value       lower 90%   higher 90%
Photon index: 0.881650     ( -5.52682   1.3525 )
Epeak [keV] : 64.8266      ( -50.9479 -64.6615 )
Norm@50keV  : 9.71273E-03    ( -0.00982107   4.8984 )
------------------------------------------------------------
#Fit statistic  : Chi-Squared                   62.86     using 59 bins.
 Reduced chi-squared = 1.1225
# Null hypothesis probability of 2.46e-01 with 56 degrees of freedom

Photon flux (15-150 keV)    in 1 sec: 0.462695 ( -0.164159  0.154076 ) ph/cm2/s
Energy fluence (15-150 keV)             : 3.14e-08 ( -1.21474e-08  1.37586e-08 ) ergs/cm2
Band function

Time interval is from   10.292 sec. to   11.292 sec.


Spectral model in the Band function:
------------------------------------------------------------
Parameters  : value       lower 90%   higher 90%
alpha       :    (     )
beta        :     (     )
Epeak [keV] :       (   )
Norm@50keV   :     (     )
------------------------------------------------------------

Photon flux (15-150 keV)    in  sec:  (    ) ph/cm2/s
Energy fluence (15-150 keV)             : 0 ( 0  0 ) ergs/cm2
Single BB

Spectral model blackbody:
------------------------------------------------------------
Parameters  : value    Lower 90%  Upper 90%
kT [keV]    : 13.1927  (-3.50396  5.07722)
R^2/D10^2   : 8.61228E-02  (-0.0861228   0.17393)
(R is the radius in km and D10 is the distance to the source in units of 10 kpc)
------------------------------------------------------------
#Fit statistic  : Chi-Squared                   63.66     using 59 bins.
 Reduced chi-squared =
# Null hypothesis probability of 2.54e-01 with 57 degrees of freedom

Energy  Fluence     90% Error
[keV]   [erg/cm2]   [erg/cm2]
15- 25  3.178e-09   2.007e-09
25- 50  1.112e-08   6.740e-09
50-150  1.234e-08   8.955e-09
15-150  2.664e-08   1.659e-08
Thermal bremsstrahlung (OTTB)
Spectral model: thermal bremsstrahlung
------------------------------------------------------------
Parameters  : value         Lower 90%    Upper 90%
kT [keV]    : 148.440       (-98.9431      -143.419)
Norm        : 1.95258       (-0.627566     1.04662)
------------------------------------------------------------
#Fit statistic  : Chi-Squared                   62.94     using 59 bins.
 Reduced chi-squared =
# Null hypothesis probability of 2.74e-01 with 57 degrees of freedom

Energy  Fluence     90% Error
[keV]   [erg/cm2]   [erg/cm2]
15- 25  4.876e-09   2.914e-09
25- 50  9.290e-09   5.435e-09
50-150  1.983e-08   1.185e-08
15-150  3.399e-08   2.045e-08
Double BB

Spectral model: bbodyrad<1> + bbodyrad<2>
------------------------------------------------------------
Parameters  : value         Lower 90%    Upper 90%
kT1 [keV]   : 1.85997        (-1.85556      5.41342)
R1^2/D10^2  : 448.188        (-464.123      -464.242)
kT2 [keV]   : 14.5730        (-4.05357      7.08316)
R2^2/D10^2  : 5.64494E-02    (-0.0270436   0.0533178)
------------------------------------------------------------
#Fit statistic  : Chi-Squared                   60.71     using 59 bins.
 Reduced chi-squared =
# Null hypothesis probability of 2.78e-01 with 55 degrees of freedom

Energy  Fluence     90% Error
[keV]   [erg/cm2]   [erg/cm2]
15- 25  4.652e-09   2.109e-09
25- 50  9.788e-09   5.880e-09
50-150  1.390e-08   9.520e-09
15-150  2.835e-08   1.744e-08
Pre-slew spectrum (Pre-slew PHA with pre-slew DRM)
Power-law model

Spectral model in power-law:
------------------------------------------------------------
Parameters  : value       lower 90%   higher 90%
Photon index: 1.51365     ( -0.2377   0.242588 )
Norm@50keV  : 6.96941E-04    ( -0.000104818   0.000103584 )
------------------------------------------------------------
#Fit statistic  : Chi-Squared                   59.98     using 59 bins.
 Reduced chi-squared =
# Null hypothesis probability of 3.68e-01 with 57 degrees of freedom

Photon flux (15-150 keV)    in 127.7 sec: 8.73287E-02 ( -0.0124049  0.0124125 ) ph/cm2/s
Energy fluence (15-150 keV)             : 8.42452e-07 ( -1.3787e-07  1.40613e-07 ) ergs/cm2
Cutoff power-law model
Spectral model in the cutoff power-law:
------------------------------------------------------------
Parameters  : value       lower 90%   higher 90%
Photon index: 0.654429     ( -1.28922   0.947367 )
Epeak [keV] : 73.7539      ( -20.1855 -73.7539 )
Norm@50keV  : 1.98948E-03    ( -0.00198948   0.00738107 )
------------------------------------------------------------
#Fit statistic  : Chi-Squared                   57.78     using 59 bins.
 Reduced chi-squared =
# Null hypothesis probability of 4.09e-01 with 56 degrees of freedom

Photon flux (15-150 keV)    in 127.7 sec: 8.45100E-02 ( -0.0128935  0.0128467 ) ph/cm2/s
Energy fluence (15-150 keV)             : 7.81837e-07 ( -1.49765e-07  1.56573e-07 ) ergs/cm2
Band function

Spectral model in the Band function:
------------------------------------------------------------
Parameters  : value       lower 90%   higher 90%
alpha       :    (     )
beta        :     (     )
Epeak [keV] :       (   )
Norm@50keV   :     (     )
------------------------------------------------------------

Photon flux (15-150 keV)    in  sec:  (    ) ph/cm2/s
Energy fluence (15-150 keV)             : 0 ( 0  0 ) ergs/cm2
S(25-50 keV) vs. S(50-100 keV) plot

S(25-50 keV)  = 2.16e-07
S(50-100 keV) = 2.93e-07
T90 vs. Hardness ratio plot

T90                                   = 134.015999913216 sec.
Hardness ratio (energy fluence ratio) = 1.35648
Color vs. Color plot
Count Ratio  (25-50 keV) / (15-25 keV) = 1.51198
Count Ratio (50-100 keV) / (15-25 keV) = 1.0195
Mask shadow pattern

IMX = 1.374898082235024E-02, IMY = 4.880133904148388E-02
TIME vs. PHA plot around the trigger time
Blue+Cyan dotted lines: Time interval of the scaled map
From 0.000000 to 16.384000
TIME vs. DetID plot around the trigger time

Blue+Cyan dotted lines: Time interval of the scaled map
From 0.000000 to 16.384000
100 us light curve (15-350 keV)
Blue+Cyan dotted lines: Time interval of the scaled map
From 0.000000 to 16.384000
Spacecraft aspect plot

Bright source in the pre-burst/pre-slew/post-slew images
Pre-burst image of 15-350 keV band
Time interval of the image:
-239.032000 -54.584000

# RAcent  DECcent POSerr Theta    Phi  PeakCts   SNR AngSep     Name
#  [deg]    [deg]    ['] [deg]  [deg]                   [']
308.1060  40.9718    3.1  34.5  -72.5   1.8954   3.7    1.2	Cyg X-3
326.0938  38.4462    7.2  25.1  -93.8   0.5852   1.6    8.3	Cyg X-2
 39.2080  18.0883    2.2  47.3  135.2   7.4700   5.3 ------	UNKNOWN
208.7426  69.2488    2.9  56.8    3.1   5.1057   4.0 ------	UNKNOWN
341.6547  73.6838    3.2  22.9    5.1   1.0646   3.6 ------	UNKNOWN
Pre-slew background subtracted image of 15-350 keV band
Time interval of the image:
-54.584000 73.068590

# RAcent  DECcent POSerr Theta    Phi  PeakCts   SNR AngSep     Name
#  [deg]    [deg]    ['] [deg]  [deg]                   [']
308.0687  41.1115    3.6  34.5  -72.3   0.9916   3.2    9.7	Cyg X-3
326.2894  38.3976    4.0  25.0  -94.1   0.6546   2.9    7.2	Cyg X-2
 16.1719  60.8074    1.9  14.0   58.1   0.9977   6.0 ------	UNKNOWN
214.3395  76.3957    2.2  49.6    5.2   2.4672   5.3 ------	UNKNOWN
352.0924  51.6207    1.3   2.9  -74.3   1.5118   9.0 ------	UNKNOWN
293.5263  40.2801    2.2  43.9  -63.1   3.4301   5.2 ------	UNKNOWN
Post-slew image of 15-350 keV band
Time interval of the image:
108.668590 963.118000

# RAcent  DECcent POSerr Theta    Phi  PeakCts   SNR AngSep     Name
#  [deg]    [deg]    ['] [deg]  [deg]                   [']
299.5960  35.1459    4.0  40.5  -63.4   8.0929   2.9    3.4	Cyg X-1
308.1808  40.9624    2.6  31.6  -62.7   6.6128   4.4    3.2	Cyg X-3
326.4003  38.3615   12.7  22.3  -87.0   1.2283   0.9   11.0	Cyg X-2
228.6406  63.3949    4.0  56.8    3.0  11.4828   2.9 ------	UNKNOWN
277.5090  53.5209    2.3  43.2  -27.3   9.4969   4.9 ------	UNKNOWN
Plot creation:
Sat Mar  9 15:18:32 EST 2024